Elearnmarkets - Financial Market Learning
  • Courses
  • Webinars
  • Stories
  • Language
    • English
    • Hindi
    • Bengali
No Result
View All Result
Get Free Course
  • Basic Finance
  • Derivatives
    • Futures
    • Options
  • Financial Planning
  • Fundamental Analysis
  • Technical Analysis
  • Mutual Funds
  • Marketshala
  • Miscellaneous
Elearnmarkets - Learn Stock Market, trading, investing for Free
  • Courses
  • Webinars
  • Stories
  • Language
    • English
    • Hindi
    • Bengali
No Result
View All Result
Get Free Course
Elearnmarkets - Learn Stock Market, trading, investing for Free
No Result
View All Result
Home Technical Analysis
williams r

Two effective Trading Strategies using Williams % R

Elearnmarkets by Elearnmarkets
October 17, 2024
in Technical Analysis, Charts, Patterns & Indicators
Reading Time: 4 mins read
3
21.9k
VIEWS
Share on FacebookShare on XShare on WhatsApp

Williams % R for Trading Strategies is a very simple but effective is a technical analysis oscillator described by Lary Williams in the year 1973.

It measures the capacity of bulls and bears to close prices each day near the edge of the recent range. Williams % R confirms the trend and gives us a warning of the upcoming reversal.

Williams % R gives us 3 types of trading signals. They are as follows-

Table of Contents
Trading strategy using Williams% R and Moving Average
Taking early entry in reversal trades, based on multiple time frames
Bottomline

1. It defines the overbought and oversold zone

2. It defines failure swings

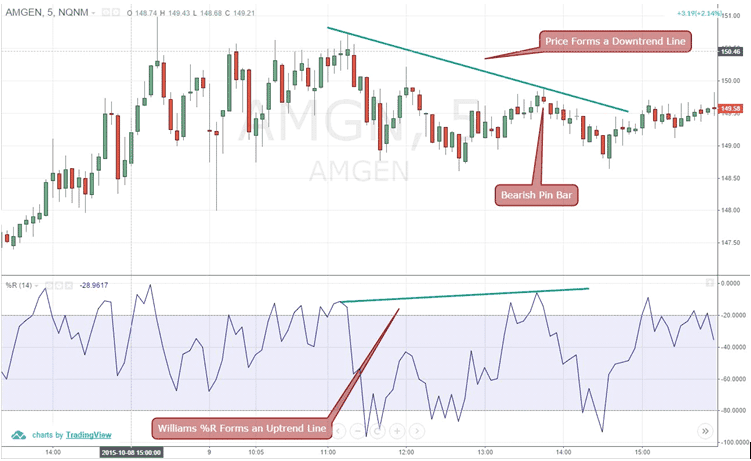
3. It identifies bullish and bearish divergence

We will discuss two special strategies using Williams % R.

Trading strategies using Williams% R and Moving Average

This is a simple but very effective trading strategies using which we can get a good buy or sell signal. Here we just combine Williams % R and 100-period moving average to generate trading signals. This trading strategies works very well in case of volatile stocks.

Case 1:

When the price closes below the 100 DMA and the Williams % R is below the 50 line, a short signal is generated. We will remain in the trade until the Williams % R gives closing above 50 line and the price closes above 100 DMA.

Also Read – What could be the leading indicator in technical analysis?

In the first scenario, as we can see in the chart, that when the price closes below the 100 DMA and the Williams % R was also below the 50 line, we could have taken a short trade. However, when the Williams % R crossed back above the 50 line, we could book our trade, thus making a fair amount of profit in the process.
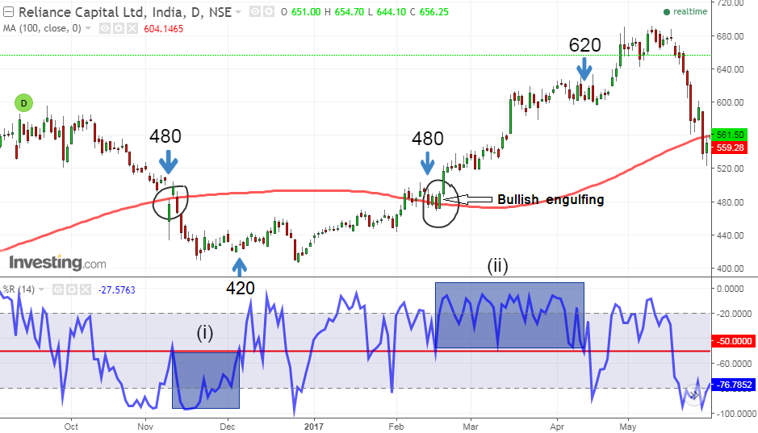
trading strategy using william r

Case 2:

When the price closes above the 100-period moving average,  from below, and the Williams % R is above the 50 line, a buy signal is generated. We will be there in the trade unless the Williams % R gives closing below 50 line or the price closes below the 100 DMA.

In the second scenario, we saw that as the price closed above the 100 DMA and as long the Williams % R is above the 50 line, we could remain in the trade. However, when the Williams % R closed below the 50 line, we could have exited the trade. This trade could give us very good profit.

Taking early entry in reversal trades, based on multiple time frames

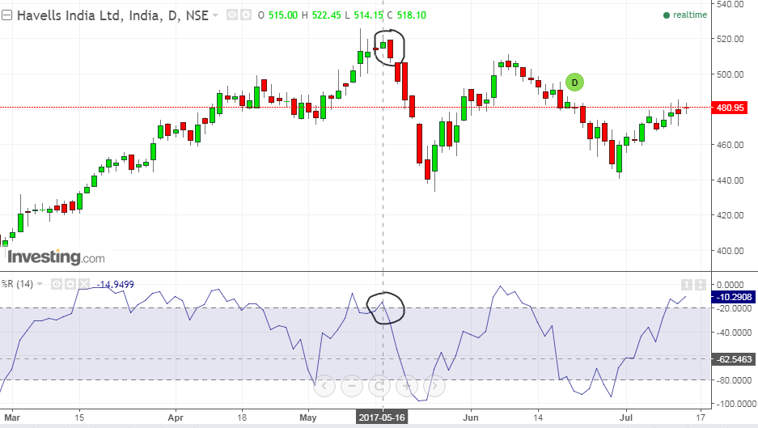
In the above chart, we have seen the indications in the daily time frame. In order to get an early signal, you may trade using multiple time frames. Say if you look into the daily chart to take your position, you may look into smaller time frame say hourly or 2-hourly chart to get a better entry. However, if you are a day trader, you may combine your hourly chart with that of the 5-minute chart. Let’s take an example to understand this in more detail-

For example, in the below chart you can see that there was an overbought condition (marked as a circle) in the daily chart of Havells India as on 16th May 2017. Next day (17th May) when the Williams % R came down from the upper reference line, it generated a sell signal. A trader who takes a trade based on daily chart would have entered in the trade either on 17th May (when Williams % R turned down) or 18th May (due to the formation of a bearish engulfing pattern on the daily chart).

havells daily chart william r

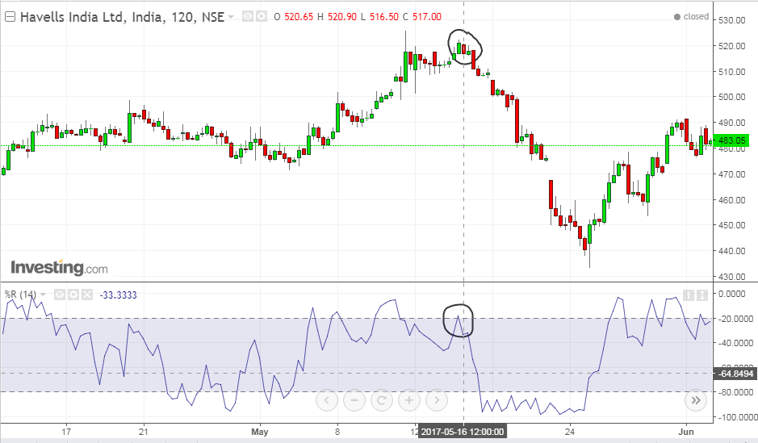
Now let’s have a look at the smaller time frame (2-hourly chart in our example) to have more clarity on our trade. According to this chart, a trader would have made his/her position as on 16th May 2017 at around 12 pm. This gives us a much early signal as compared to the daily chart where the sell signal was received either on 16th or 17th May.

havells two hourly chart

Trading Strategies

BOTTOMLINE

Like other technical indicators, Williams %R should also be used in conjunction with other technical analysis tools like chart patterns, volume, and breakouts, which can be used to get confirmed signals produced by Williams %R.

Check Stockedge to get all the combinations of technical and fundamental scans of Financial Markets.

Tags: advanceenglishindicatorstechnical analysistrading strategiesWilliam % R
ShareTweetSend
Get Kotak Offer Get Kotak Offer Get Kotak Offer
Previous Post

शेयर बाज़ार में ट्रेडिंग के १० महत्वपूर्ण रणनीतियाँ

Next Post

ROC Indicator – How to trade with Rate of change Indicator ?

Elearnmarkets

Elearnmarkets

Elearnmarkets (ELM) is a complete financial market portal where the market experts have taken the onus to spread financial education. ELM constantly experiments with new education methodologies and technologies to make financial education effective, affordable and accessible to all. You can connect with us on Twitter @elearnmarkets.

Related Posts

Understand Slippage in Trading
Technical Analysis

What is Slippage in Trading? Meaning & Examples

March 28, 2025
306
Breakout trading strategies
Technical Analysis

Top 5 Breakout Trading Strategies

March 12, 2025
1.1k
5 stocks for today
Technical Analysis

5 Stocks to Buy Today That Could Beat the NIFTY in 2025!

May 5, 2025
403
Image describing What is marginal trading facility
Technical Analysis

 What is a Margin Trading Facility? Advantages & Risks

April 4, 2025
663

Comments 3

  1. Arua says:
    8 years ago

    Thanks so much for the w%r with 100DMA strategy which your shared, my questions are (1) What are the settings for the DMA indicator like dma period, dmaperiod shift, isRay, sample point (2) Can any other moving be used, if yes what settings do you recommend?

    Regrads

    Reply
    • Ankit Jaiswal says:
      8 years ago

      DMA period settings depend upon trading scale. Short term 5,20 dma, Mid term 20 ,50, and 100 dma, long term 50,100 and 200 dma.

      DMA shift period 6 because assuming that in the one month is 30 days, it means that one week trading is 5 days so 30 divided by 5 is 6.

      There are many moving averages but we recommend HULL, ADAPTIVE, ZERO LAG EXPONENTIAL, and WILDER SMOOTHENING depending upon trading strategies.

      ELDER RAY indicator is a combination of bull power, bear power and a 13 period exponential moving average. To capture big move, it can be used by 20, 30 or 50 period.

      To know more about Technical Analysis you can go through our course :NSE Academy Certified Technical Analysis

      Reply
  2. froleprotrem says:
    5 years ago

    I?¦ve been exploring for a little for any high-quality articles or blog posts on this sort of space . Exploring in Yahoo I finally stumbled upon this website. Studying this information So i?¦m happy to show that I’ve a very good uncanny feeling I came upon exactly what I needed. I most without a doubt will make certain to do not disregard this website and provides it a look on a constant basis.

    Reply

Leave a Reply Cancel reply

Your email address will not be published. Required fields are marked *

Disclaimer

Elearnmarkets (Kredent InfoEdge Pvt. Ltd.) is a SEBI-registered Research Analyst (RA) entity (SEBI Registration No.: INH300007493). The information provided in this article is for educational and informational purposes only and should not be considered as an offer to buy or sell any securities or investment products.

The stocks, securities, and investment instruments mentioned herein are not recommendations under SEBI (Research Analysts) Regulations, 2014. Readers are advised to conduct their own due diligence and seek independent financial advice before making any investment decisions.

Investments in securities markets are subject to market risks. Please read all related documents carefully before investing. Investing in Equity Shares,
Derivatives, Mutual Funds, or other instruments carry inherent risks, including potential loss of capital. Elearnmarkets (Kredent InfoEdge Pvt. Ltd.) does not provide any guarantee or assurance of returns on any investments. Past performance is not indicative of future performance.

Elearnmarkets Logo

Follow Us

Facebook-f X-twitter Instagram Linkedin-in Youtube Telegram

Register on Elearnmarkets

Continue your financial learning by creating your own account on Elearnmarkets.com

Register Free Account

Download App

Playstore logo
Download on app store

Categories

  • Basic Finance
  • Derivatives
  • Financial Planning
  • Fundamental Analysis
  • Technical Analysis
  • Mutual Funds
  • Miscellaneous

Popular On Elearnmarkets

  • Market Superheroes:
  • Vivek Bajaj
  • Chetan Panchamia
  • Ashish Kyal
  • Premal Parekh
  • Abhijit Paul
  • Jegan
  • Sivakumar Jayachadran
  • Jyoti Budhia
  • Vivek Gadodia
  • Vishal Mehta
  • Piyush Chaudhry
  • Santosh Pasi
  • Gomathi Shankar
  • Market Superheroes:
  • Vivek Bajaj
  • Chetan Panchamia
  • Ashish Kyal
  • Premal Parekh
  • Abhijit Paul
  • Jegan
  • Sivakumar Jayachadran
  • Jyoti Budhia
  • Vivek Gadodia
  • Vishal Mehta
  • Piyush Chaudhry
  • Santosh Pasi
  • Gomathi Shankar
  • Courses:​
  • Options Trading
  • Dow Theory
  • Momentum Trading
  • Stock Investing
  • Harmonic Chart Patterns
  • Algo Trading
  • Elliot Wave Theory
  • Advanced Excel
  • Cryptocurrency
  • NSE Certification Course
  • Courses:​
  • Options Trading
  • Dow Theory
  • Momentum Trading
  • Stock Investing
  • Harmonic Chart Patterns
  • Algo Trading
  • Elliot Wave Theory
  • Advanced Excel
  • Cryptocurrency
  • NSE Certification Course
  • Webinars:
  • Bank Nifty Scalping
  • Intraday Trading Strategies
  • Options Trading Strategies
  • Options selling
  • Price Action
  • Relative Strength
  • Tax Planning
  • Options Buying
  • Growth Stocks
  • Portfolio Management
  • Risk Management
  • Renko Charts
  • Crude Oil
  • Traders Psychology
  • Moving Average
  • Multibagger Stocks
  • Free Learning Modules:
  • Intraday Trading
  • Options Scalping
  • Swing Trading
  • Financial Modelling
  • RSI Indicator
  • Bollinger Bands
  • Pricing of Futures
  • Personal Finance
  • Initial Public Offerings (IPO)
  • Value Investing
  • Technical Indicators
  • Candlesticks
  • Chart Patterns
  • Option Greeks
  • ELSS Funds
  • Banking and Insurance
  • Real Estate
  • Gold
  • Book Summaries:
  • Rich Dad Poor Dad
  • Psychology of Money
  • The Intelligent Investor
  • The Richest Man in Babylon
  • Think and Trade Like a Champion
  • Value Investing and Behavioural Finance
  • Trading in the Zone
  • Learn to Earn
  • Book Summaries:
  • Rich Dad Poor Dad
  • Psychology of Money
  • The Intelligent Investor
  • The Richest Man in Babylon
  • Think and Trade Like a Champion
  • Value Investing and Behavioural Finance
  • Trading in the Zone
  • Learn to Earn
  • Tools:
  • CAGR Calculator
  • SIP Calculator
  • eLearnOptions
  • Future Value Calculator
  • Present Value Calculator
  • Atal Pension Yojana
  • Cost of Delay Calculator
  • Become a Crorepati
  • Tools:
  • CAGR Calculator
  • SIP Calculator
  • eLearnOptions
  • Future Value Calculator
  • Present Value Calculator
  • Atal Pension Yojana
  • Cost of Delay Calculator
  • Become a Crorepati

© 2025 Elearnmarkets. All Rights Reserved

  • Visit Elearnmarkets
  • Courses
  • Webinars
  • Financial Guides
  • Get Free Counselling
  • Visit Elearnmarkets
  • Courses
  • Webinars
  • Financial Guides
  • Get Free Counselling

Download Our App

No Result
View All Result
  • Article Categories
    • Basic Finance
    • Derivatives
    • Financial Planning
    • Fundamental Analysis
    • Technical Analysis
    • ETFs & Mutual Funds
    • Marketshala
    • Miscellaneous
  • Language
    • Hindi
    • Bengali
    • English
  • Courses
  • Webinars
  • Stories
Get Free Course

© 2024 Elearnmarkets All Rights Reserved

A Handbook of Technical Analysis
To start your trading journey as a seasoned technical analyst
Download Guide For FREE
Guidebook On Chart Patterns
Take Your Trading To The Next Level With Strategies Shared In This Ebook
Download Guide For FREE
Trading Mentorship Program