Elearnmarkets - Financial Market Learning
  • Categories
    • Basic Finance
    • Derivatives
      • Futures
      • Options
    • Financial Planning
    • Fundamental Analysis
    • Technical Analysis
    • Marketshala
    • Miscellaneous
  • Language
    • English
    • Hindi
    • Bengali
No Result
View All Result
  • Courses
  • Webinars
  • Stories
Elearnmarkets - Learn Stock Market, trading, investing for Free
No Result
View All Result
Home Technical Analysis
How to Trade with Inverted Hammer: Candlestick Pattern 1

How to Trade with Inverted Hammer: Candlestick Pattern

Elearnmarkets by Elearnmarkets
June 29, 2023
in Technical Analysis
Reading Time: 5 mins read
0
42.6k
VIEWS
Share on FacebookShare on XShare on WhatsApp

Inverted Hammer candlestick is a pattern that appears on a chart when there is a buyer’s pressure for pushing the price of the stocks upwards.

This is a reversal candlestick pattern that appears at the bottom of a downtrend and signals a potential bullish reversal.

This candlestick pattern gets its name from an inverted hammer in real life.

Formation of Inverted Hammer:

This candlestick pattern has a long shadow at the top and there is no shadow at the bottom.

The length of the long shadow is usually the twice of the height of the real body of the candlestick as shown below:

Red Green Inverted Hammer Candlestick

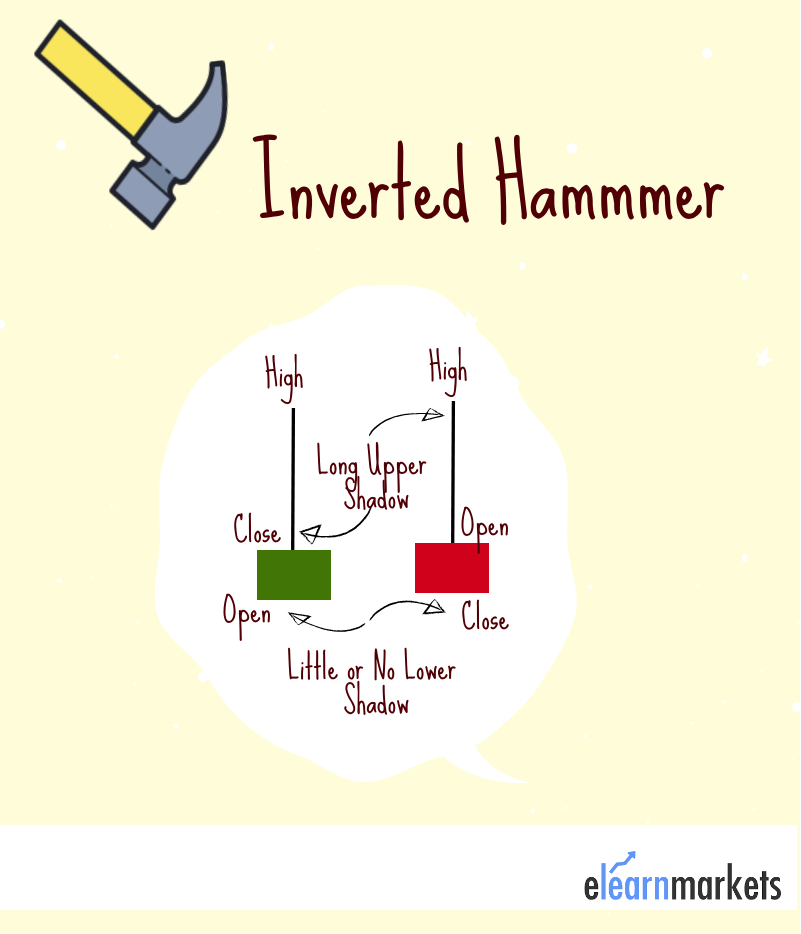
This candlestick is formed when bullish traders start again to gain confidence after sellers have pushed the prices downwards.

The upper shadow is formed when the bulls try to push the price up whereas the lower part of the shadow is formed by the bears, who try to resist the higher price.

However, the pressure by the bulls is strong enough to close at a higher price.

What does Inverted Hammer tell you?

The Inverted Hammer is a signal of bullish reversal after a downtrend.

It tells the traders that the bulls are now willing to buy the stock at the fallen prices. After the downtrend, there is pressure from the buyers in the market to raise the stock prices.

It tells the sellers in the market to exit as they may be a bullish reversal and tells the buyers to enter their buying position as the bullish trend is about to start.

But remember to confirm this signal with other technical indicators as it may sometimes fall signals.

You can also wait for the next trading day to confirm the beginning of the bullish trend.

If in the next trading session the opening price is more than the closing price of the inverted hammer candlestick then you can enter the buy position.

To know about other candlesticks, read our blog on All 35 Candlestick Chart Patterns in the Stock Market-Explained

Few Aspects to look for when trading with Inverted Hammer:

When we start analyzing the stocks using this inverted hammer candlestick pattern, there are certain aspects that we should look for.

Below are a few aspects which will help you in trading with an inverted hammer candlestick pattern:

1. Confirm the pattern:

There are certain confirmation criteria that traders should consider when taking the trade using an Inverted Hammer candlestick.

  • The trader should first verify that the length of the upper shadow is more than twice of the real body.
  • If the formation Inverted Hammers occurs with a gap down from the previous day candlestick, then the chances of reversal are stronger.
  • The volume in trading should be high on the day of the formation of the Inverted Hammer candlestick pattern. High volume signifies that buyers have entered the market and exerting pressure the increase the price of the stock.
  • It is better to enter the buying position the next day if the price opens higher.
  • Before entering into the trade, the trader must consider the above criteria to confirm the bullish reversal signal given by the Inverted Hammer.

2. The psychology behind the pattern:

The prior trend should be a downtrend which means that the prices should be making lower lows and there should be selling pressure exerted by the sellers to make the price fall.

When this candlestick forms, it shows that the bulls are back into the market and have started putting buying pressure to make the prices rise high and bears are unable to bring the price down.

If the price maintains its strength even in the next trading session, one can enter the buy position.

3. Don’t get confused with other candlestick patterns:

Traders often get confused between the inverted hammer and shooting star candlestick pattern. But one should note that the inverted hammer occurs after the downtrend whereas shooting start happens after an uptrend.

You can also use technical scans to filter out stocks for trading the next day by using StockEdge, now also available in the web version.

Key Takeaways:

  • Inverted Hammer reversal candlestick pattern which appears at the bottom of a downtrend and signals a potential bullish reversal.
  • This candlestick pattern has a long shadow at the top and there is no shadow at the bottom.
  • An inverted hammer candlestick pattern is formed when bullish traders start again to gain confidence after sellers have pushed the prices downwards.
  • A red inverted hammer candlestick shows that prices closed lower than the previous day’s closing price.
  • The volume should be high on the day of the formation of the Inverted Hammer candlestick pattern
  • Confirm this signal with other technical indicators as it may sometimes fall signals.

Did you find the Inverted Hammer candlestick pattern useful? Tell us by commenting below.

Happy Learning !

Tags: basiccandlestick analysiscandlestick patternenglishinverted hammertechnical basics
Share3TweetSend
Get Kotak Offer Get Kotak Offer Get Kotak Offer
Previous Post

ট্রেডড ভলিউম এবং ডেলিভারি ভলিউমের অন্তর্নিহিত পার্থক্য

Next Post

A Perfect Guide to Fundamental Analysis

Elearnmarkets

Elearnmarkets

Elearnmarkets (ELM) is a complete financial market portal where the market experts have taken the onus to spread financial education. ELM constantly experiments with new education methodologies and technologies to make financial education effective, affordable and accessible to all. You can connect with us on Twitter @elearnmarkets.

Related Posts

Piercing Pattern - How to trade with Piercing Candlestick? 2
Technical Analysis

Piercing Pattern – How to trade with Piercing Candlestick?

December 7, 2023
19.8k
Hammer Candlestick Pattern - Formation, Example and Limitations 3
Technical Analysis

Hammer Candlestick Pattern – Formation, Example and Limitations

December 6, 2023
30.8k
Supertrend Indicator : How to use for Intraday trading? 4
Technical Analysis

Supertrend Indicator : How to use for Intraday trading?

December 6, 2023
289.1k
Top 10 Chart Patterns you should know when Trading in the Stock Market 5
Technical Analysis

Top 10 Chart Patterns you should know when Trading in the Stock Market

December 5, 2023
167.5k

Leave a Reply Cancel reply

Your email address will not be published. Required fields are marked *

Elearnmarkets Logo

Follow Us

Facebook-f Twitter Instagram Linkedin-in Youtube Telegram

Register on Elearnmarkets

Continue your financial learning by creating your own account on Elearnmarkets.com

Register Free Account

Download App

Playstore logo
Download on app store

Categories

  • Basic Finance
  • Derivatives
  • Financial Planning
  • Fundamental Analysis
  • Technical Analysis
  • Marketshala
  • Miscellaneous

Popular On Elearnmarkets

  • Market Superheroes:
  • Vivek Bajaj
  • Chetan Panchamia
  • Ashish Kyal
  • Premal Parekh
  • Abhijit Paul
  • Jegan
  • Sivakumar Jayachadran
  • Vishal Malkan
  • Jyoti Budhia
  • Vivek Gadodia
  • Vishal Mehta
  • Piyush Chaudhry
  • Santosh Pasi
  • Gomathi Shankar
  • Market Superheroes:
  • Vivek Bajaj
  • Chetan Panchamia
  • Ashish Kyal
  • Premal Parekh
  • Abhijit Paul
  • Jegan
  • Sivakumar Jayachadran
  • Vishal Malkan
  • Jyoti Budhia
  • Vivek Gadodia
  • Vishal Mehta
  • Piyush Chaudhry
  • Santosh Pasi
  • Gomathi Shankar
  • Courses:​
  • Options Trading
  • Dow Theory
  • Momentum Trading
  • Stock Investing
  • Stock Market for Beginners
  • Harmonic Chart Patterns
  • Algo Trading
  • Elliot Wave Theory
  • Advanced Excel
  • Cryptocurrency
  • NSE Certification Course
  • Courses:​
  • Options Trading
  • Dow Theory
  • Momentum Trading
  • Stock Investing
  • Stock Market for Beginners
  • Harmonic Chart Patterns
  • Algo Trading
  • Elliot Wave Theory
  • Advanced Excel
  • Cryptocurrency
  • NSE Certification Course
  • Webinars:
  • Bank Nifty Scalping
  • Intraday Trading Strategies
  • Options Trading Strategies
  • Options selling
  • Price Action
  • Relative Strength
  • Tax Planning
  • Options Buying
  • Growth Stocks
  • Portfolio Management
  • Relative Strength Index
  • Risk Management
  • Renko Charts
  • Crude Oil
  • Traders Psychology
  • Moving Average
  • Multibagger Stocks
  • Free Learning Modules:
  • Intraday Trading
  • Options Scalping
  • Swing Trading
  • Financial Modelling
  • RSI Indicator
  • Bollinger Bands
  • Pricing of Futures
  • Personal Finance
  • Initial Public Offerings (IPO)
  • Value Investing
  • Technical Indicators
  • Candlesticks
  • Chart Patterns
  • Option Greeks
  • ELSS Funds
  • Banking and Insurance
  • Real Estate
  • Gold
  • Book Summaries:
  • Rich Dad Poor Dad
  • Psychology of Money
  • The Intelligent Investor
  • The Richest Man in Babylon
  • Think and Trade Like a Champion
  • Value Investing and Behavioural Finance
  • Trading in the Zone
  • Learn to Earn
  • Book Summaries:
  • Rich Dad Poor Dad
  • Psychology of Money
  • The Intelligent Investor
  • The Richest Man in Babylon
  • Think and Trade Like a Champion
  • Value Investing and Behavioural Finance
  • Trading in the Zone
  • Learn to Earn
  • Tools:
  • CAGR Calculator
  • SIP Calculator
  • eLearnOptions
  • Future Value Calculator
  • Present Value Calculator
  • Atal Pension Yojana
  • Cost of Delay Calculator
  • Become a Crorepati
  • Tools:
  • CAGR Calculator
  • SIP Calculator
  • eLearnOptions
  • Future Value Calculator
  • Present Value Calculator
  • Atal Pension Yojana
  • Cost of Delay Calculator
  • Become a Crorepati

© 2023 Elearnmarkets. All Rights Reserved

  • Visit Elearnmarkets
  • Courses
  • Webinars
  • Financial Guides
  • Get Free Counselling
  • Visit Elearnmarkets
  • Courses
  • Webinars
  • Financial Guides
  • Get Free Counselling

Get Elearnmarkets App

No Result
View All Result
  • Article Categories
    • Basic Finance
    • Derivatives
    • Financial Planning
    • Fundamental Analysis
    • Technical Analysis
    • Marketshala
    • Miscellaneous
  • Language
    • Hindi
    • Bengali
    • English
  • Courses
  • Webinars
  • Stories

© 2020 Elearnmarkets All Rights Reserved

A Handbook of Technical Analysis
To start your trading journey as a seasoned technical analyst
Download Now
Masterclass on Short-term Momentum Trading
Harness the Power of Market Momentum to Identify High Probability Trading Setups