Elearnmarkets - Financial Market Learning
  • Courses
  • Webinars
  • Stories
  • Language
    • English
    • Hindi
    • Bengali
No Result
View All Result
Get Free Course
  • Basic Finance
  • Derivatives
    • Futures
    • Options
  • Financial Planning
  • Fundamental Analysis
  • Technical Analysis
  • Mutual Funds
  • Marketshala
  • Miscellaneous
Elearnmarkets - Learn Stock Market, trading, investing for Free
  • Courses
  • Webinars
  • Stories
  • Language
    • English
    • Hindi
    • Bengali
No Result
View All Result
Get Free Course
Elearnmarkets - Learn Stock Market, trading, investing for Free
No Result
View All Result
Home Basic Finance Commodity, Currency & FOREX Market
Top 10 Forex Indicators That Every Trader Should Know 1

Top 10 Forex Indicators That Every Trader Should Know

Elearnmarkets by Elearnmarkets
May 28, 2024
in Commodity, Currency & FOREX Market
Reading Time: 9 mins read
10
122.7k
VIEWS
Share on FacebookShare on XShare on WhatsApp

Forex Indicators are considered to be an essential part when trading in the forex market.

Several forex traders use these forex indicators daily, which helps them understand when they can buy or sell in the forex market. These forex indicators are known as an important part of technical analysis, and every technical or fundamental analyst should be aware of these forex indicators

Today’s article will show the top 10 Forex indicators that every forex trader should know.

As indicators are an important part of Forex trading, and for a forex trader- every technical and fundamental analyst should know the structure and use of mostly used mt4 indicators.

Let’s look at the top 10 Forex indicators that every forex trader should know.

Table Of Contents
  1. 1. Moving Averages
  2. 2. Relative Strength Index
    • Learn about technical indicators with Technical Trading Made Easy Course by Market Experts
  3. 3. MACD
  4. 4. Bollinger Bands
  5. 5. Stochastic
  6. 6. Ichimoku Kinko Hyo
  7. 7. Fibonacci
  8. 8. Average True Range
  9. 9. Parabolic SAR
  10. 10. Pivot Point

1. Moving Averages

The concept of moving average is very important that every trader should know. The central bank and multinational companies drive the forex market. Therefore, it is important to understand what is happening at the macro level.

The moving average is one of the forex indicators that is the average price of the last number of candles that represent the overall sentiment of the price.

If the price is trading above the moving average is it is an indication that buyers are controlling the price.

On the other hand, if the price is trading below the moving average, it means sellers control the price. Therefore, in your trading strategy, you should focus on buy trades if the price is above the moving average. It is one of the best forex indicators that a trader should know
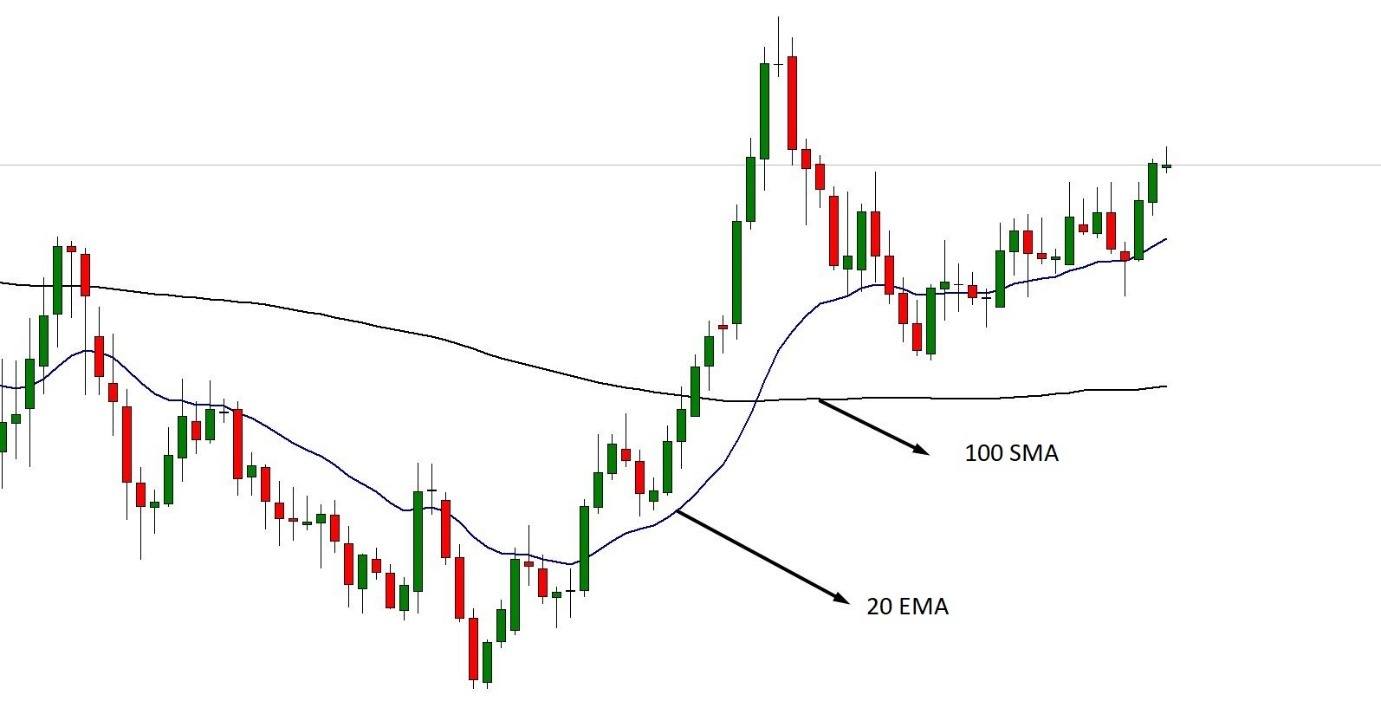
Simple Moving Average and Exponential Moving Average setup

Furthermore, the simple moving average indicates the average price of the last number of candles that helps traders to understand the market context.

On the other hand, the exponential moving average focuses on the most recent movement that helps traders enter a trade.

2. Relative Strength Index

The relative strength index is another type of forex indicators that ranges from 0 to 100 levels. This indicator indicates where the price is likely to reverse.

In an uptrend, when the price moves above the 70 levels, it indicates a bearish market reversal. Similarly, if the price moves below the 30 levels in a downtrend, it indicates a bullish market reversal.
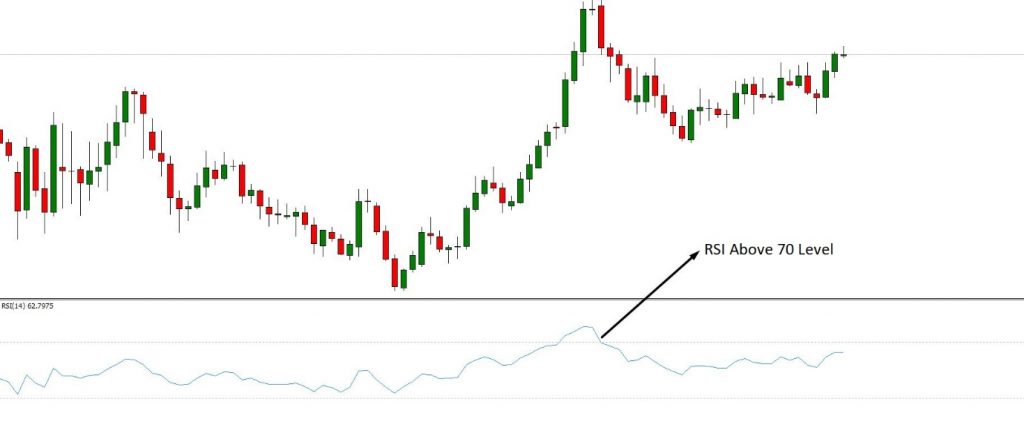
rsi forex indicator

On the other hand, RSI provides trading opportunities by creating a divergence with the price.

Learn about technical indicators with Technical Trading Made Easy Course by Market Experts

3. MACD

One of the most used forex indicators is MACD- Moverage Average Convergence and Divergence

MACD is a trading indicator that consists of a histogram and an exponential moving average. The main purpose of this indicator is to calculate divergence with the price. The regular divergence with MACD and price indicates a market reversal, while their hidden divergence indicates a market continuation.
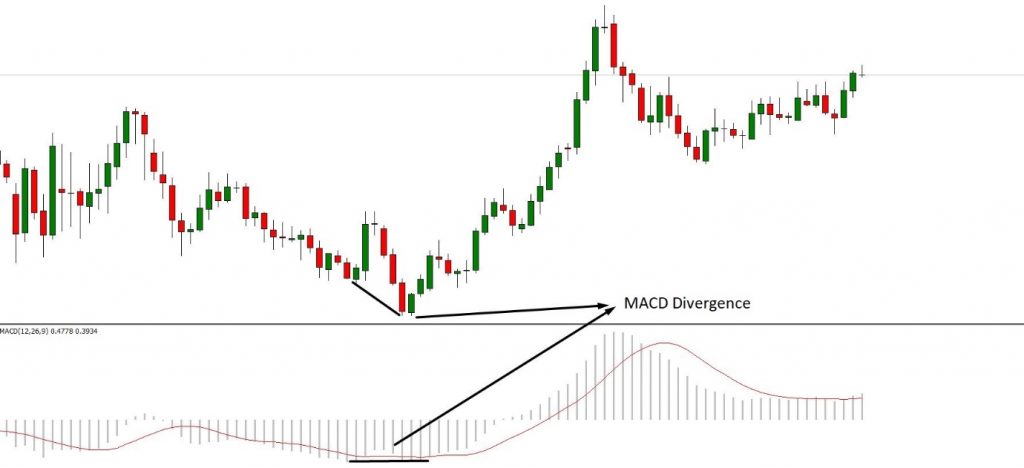
macd forex indicators

Traders often use it as a primary indicator to create a trading strategy. On the other hand, you can use this indicator to find a possible market reversal point or a continuation point. Therefore, you can enter the trade according to a trading strategy based on other mt4 indicators.

4. Bollinger Bands

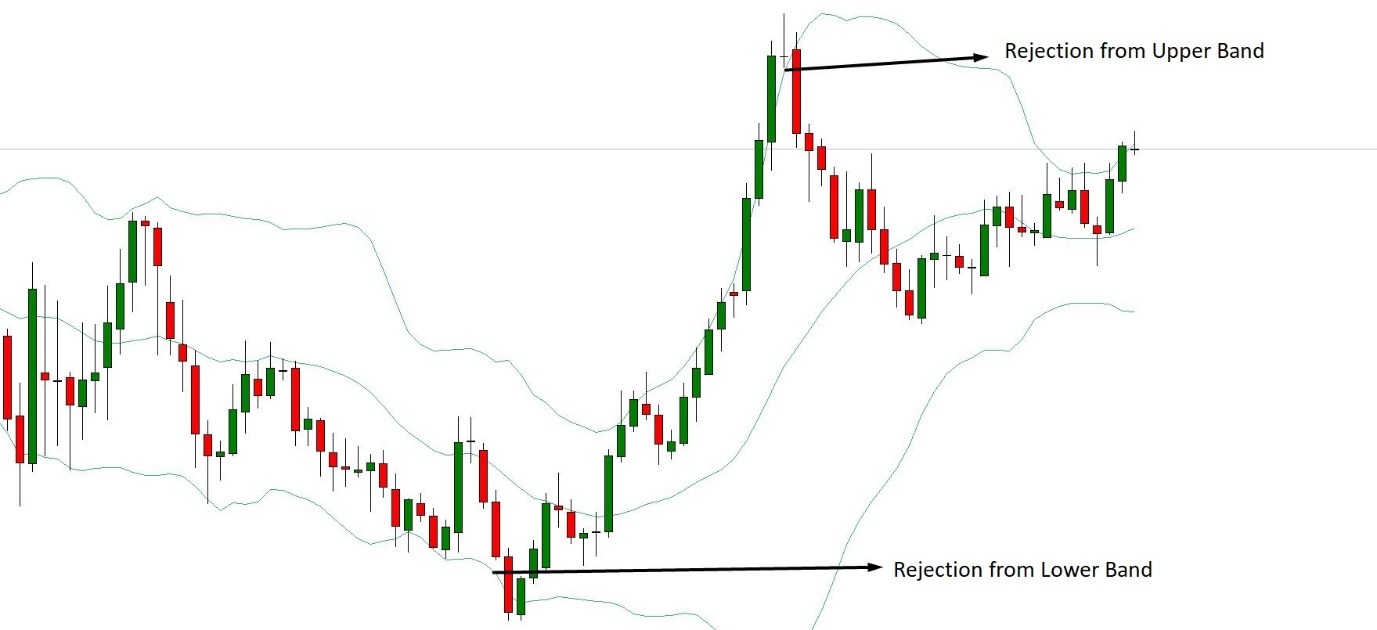
John Bollinger created the Bollinger Bands indicator which is one of the forex indicators. The main element of Bollinger bands is moving averages.

There are two standard deviations in upside and the downside and a classical moving average in the middle.

Overall, this trading indicator is very easy to use and provides a reliable trading entry.
bollinger bands

The upper and lower line in Bollinger bands indicator works as dynamic support and resistance levels.

Any rejection from these levels indicates a possible entry. Furthermore, any breakout from these levels also provides profitable trades.

However, a candle close below or above the middle line creates the possibility of testing the next level.

5. Stochastic

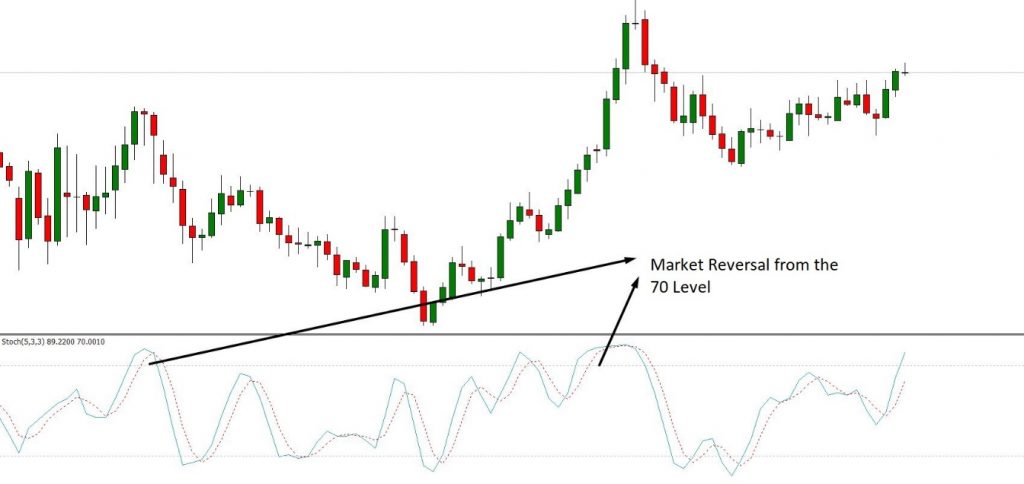
Stochastic is a popular momentum indicator that was developed in the early 1950s. The main aim of this indicator is to identify the overbought and oversold zone.

Traders often need to find a possible profit-taking area in their trading strategy.

Therefore, they use this forex indicator to find the location from where the price is expected to reverse. The Stochastic indicator moves from 0 levels to 100 levels.
sto forex indicators

If the price moves above the 70 levels, the price will likely reverse. On the other hand, if the price moves below the 30 levels, it creates the possibility of a bullish reversal.

6. Ichimoku Kinko Hyo

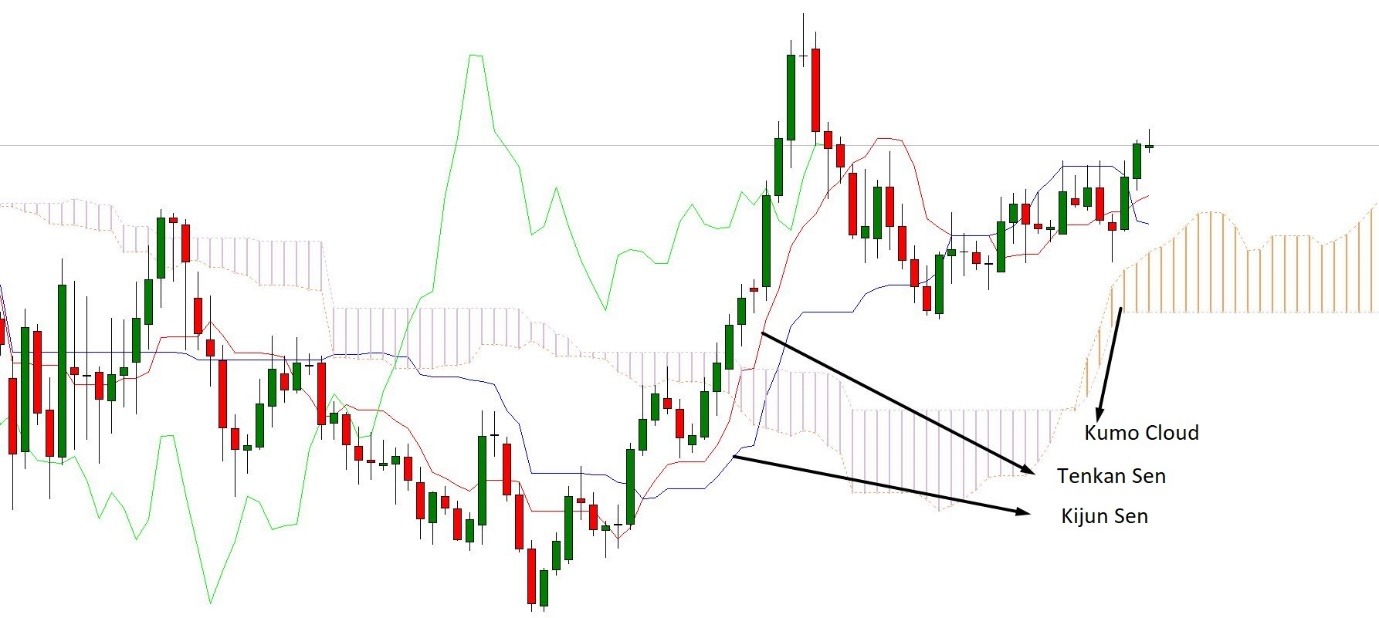
Ichimoku Kinko Hyo or the Ichimoku Cloud is one of the forex indicators with elements to create a complete trading strategy.

Several elements in this indicator help traders to identify every aspect of the market.

The Kumo Cloud is the first element of this indicator that helps to understand the market context. If the price is trading below the Kumo Cloud, the overall trend is bearish, and above the Kumo Cloud is bullish.
Kumo Cloud

On the other hand, Tenkan Sen and Kijun Sen are two important elements of this indicator that made with the concept of moving average. These two lines move with the price, and any rejection from these creates a trading entry.

7. Fibonacci

Fibonacci is a trading tool that shows the most accurate market direction as it is related to every creature in the universe.

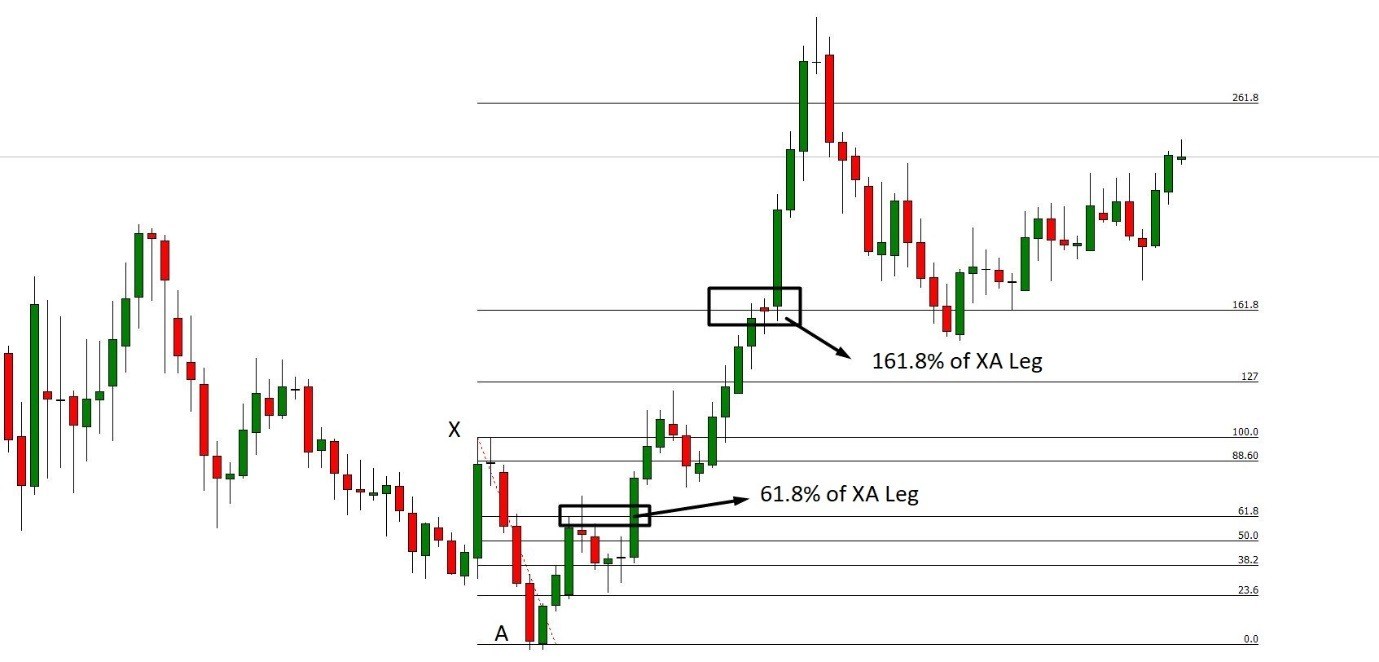
The most significant part of the Fibonacci tool is the golden ratio of 1.618. In the forex market, traders use this ratio to identify market reversal and the profit-taking area.

Suggested Read – Fibonacci Retracement – How to use it while trading stocks

If the price moves with a trend, corrects towards 61.8% Fibonacci retracement, and shows a market reversal, the price will likely move 161.8% Fibonacci extension level of the current leg.
Fibonacci Retracement- How to use it while trading

Furthermore, based on the market behaviour and momentum there are other Fibonacci levels like 23.6%, 38.2%, 50.0%, 88.6%, 127.0%, 261.8%, etc.

8. Average True Range

Average True Range indicates the volatility of a currency pair. In the forex market, measuring the volatility is very important as it is related to direct market movement.

In every financial market, the increase of volatility indicates the market reversal, and the decrease of volatility indicates the market continuation.
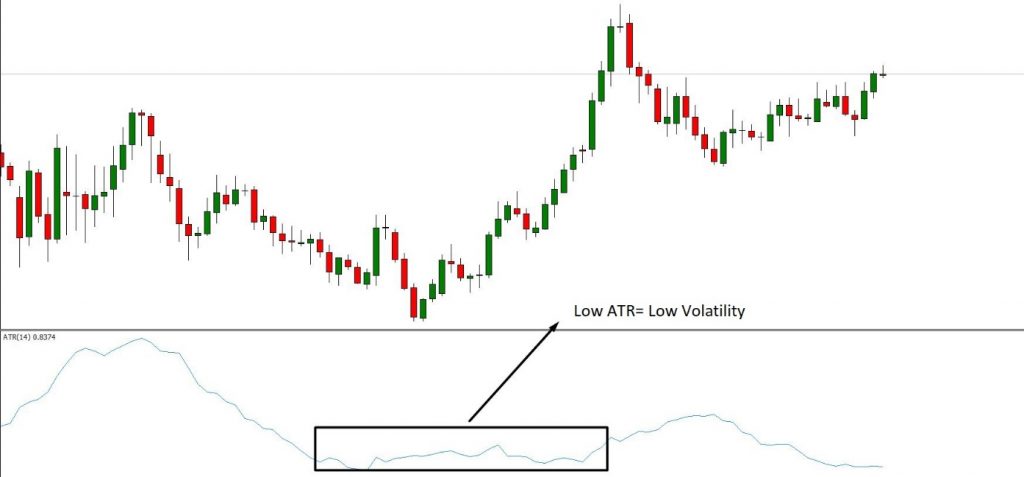
ATR indicator

The lower Average True Range indicates the lower volatility and the higher ATR indicates the higher volatility. Therefore, if the volatility is low, you can extend your take profit. On the other hand, in the lower volatility, you can find reversal trade setups.

9. Parabolic SAR

Parabolic SAR indicates the market trend of a currency pair. If the price is above the Parabolic SAR, the overall trend is bullish. On the other hand, if the price is below the SAR, the overall trend is bearish.
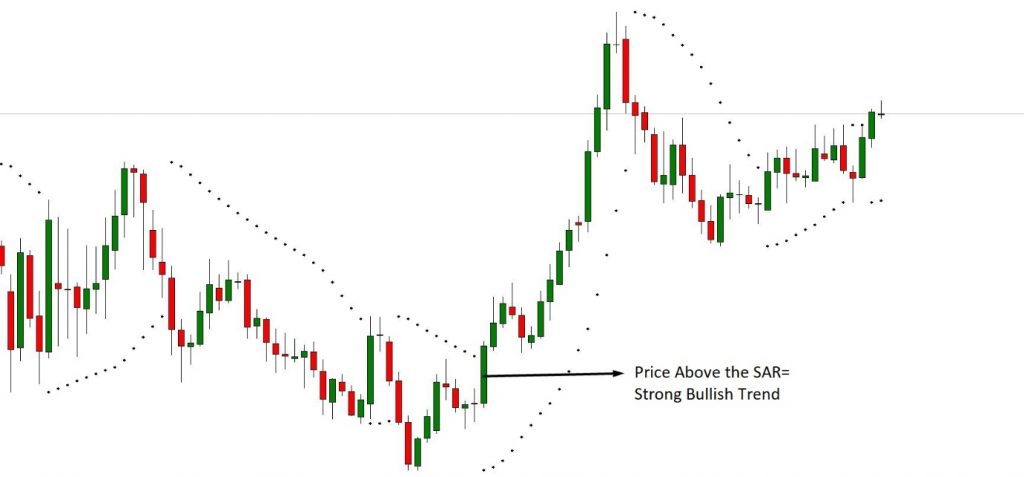
parabolic SAR

Traders use this indication to identify the trend. Furthermore, a market rejection from the Parabolic SAR indicator provides a potential entry point.

10. Pivot Point

Pivot point indicators the equilibrium level of supply and demand of a currency pair. If the price reaches the pivot point level, it indicates the supply and demand of the particular pair are the same.

If the price moves above the pivot point level, it indicates that the demand for a currency pair is high. However, if the price moves below the pivot point, the supply would be high.
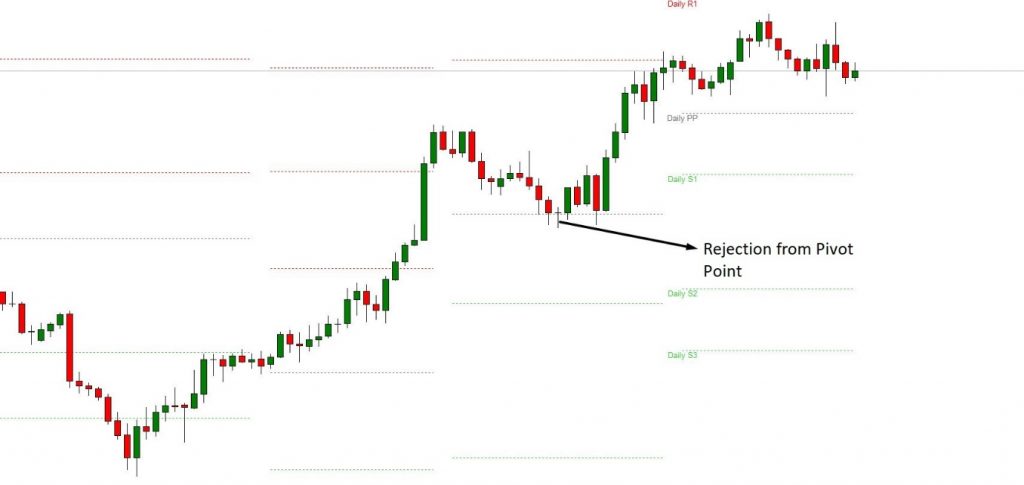
pivot points

In the financial market, price tends to move at the equilibrium point before setting any direction. Therefore, this trading indicator provides a possible trading entry from the rejection of the pivot point.

Forex indicators are important trading tools that most traders should know. However, the effectiveness of a technical trading indicator depends on how you are utilizing it. Traders often use multiple indicators with different parameters to increase the probability of a market movement.

Happy Learning!

Tags: advanceenglishforexindicatorstechnical analysis
ShareTweetSend
Get Kotak Offer Get Kotak Offer Get Kotak Offer
Previous Post

Forward Contract – Definition, Example, Basics, & Risks

Next Post

Average True Range का उपयोग करते हुए ट्रेडिंग के लिए एक अल्टीमेट गाइड

Elearnmarkets

Elearnmarkets

Elearnmarkets (ELM) is a complete financial market portal where the market experts have taken the onus to spread financial education. ELM constantly experiments with new education methodologies and technologies to make financial education effective, affordable and accessible to all. You can connect with us on Twitter @elearnmarkets.

Related Posts

Ways to Make Trading More Transparent
Cryptocurrency

Under the Crypto Hood: 5 Ways to Make Trading More Transparent

May 5, 2025
76
The Rise of Meme Coins Like Trump Coin and Why They May Be a Good Investment 2
Cryptocurrency

The Rise of Meme Coins Like Trump Coin and Why They May Be a Good Investment

February 26, 2025
164
Future of Bitcoin in India
Cryptocurrency

Bitcoin Price Prediction: Understanding the Future of Bitcoin in India

February 15, 2025
468
A Comprehensive Guide: How to Invest in Gold in 2023 3
Commodity, Currency & FOREX Market

A Comprehensive Guide: How to Invest in Gold in 2023

February 25, 2025
2.7k

Comments 10

  1. Al MT4 says:
    5 years ago

    Thanks for this post now I can see the top forex indicators i’ve been missing all these years. So far I’ve downloaded ichimoku but it seems a life time to understand it with all the text book guides, keep up.

    Reply
  2. Emmanuel Ikedichukwu ugwu says:
    4 years ago

    Very nice explanation of different indicators. I will embark on studying it every day

    Reply
    • Sakshi Agarwal says:
      4 years ago

      Hi,

      We really appreciated that you liked our blog.

      Keep Reading!

      Reply
  3. website setup says:
    4 years ago

    thanks for sharing, now i can understand

    Reply
    • Sakshi Agarwal says:
      4 years ago

      Hi,

      We really appreciated that you liked our blog.

      Keep Reading!

      Reply
  4. isiaka Gbadebo says:
    3 years ago

    Your approach to teaching these indicators is so simple, straight forward and easy to understand. Thanks a lot.
    Soji.

    Reply
    • Sakshi Agarwal says:
      3 years ago

      Hi,

      We really appreciated that you liked our blog.

      Keep Reading!

      Reply
  5. Igfof says:
    3 years ago

    Great

    Reply
    • Sakshi Agarwal says:
      3 years ago

      Hi,

      We really appreciated that you liked our blog! Thank you for your feedback!

      Keep Reading!

      Reply
  6. Miracle says:
    3 years ago

    Thank you for offering such valuable Information and surprisingly for Free. ⭐⭐⭐⭐⭐ You deserve extra 🌟

    Reply

Leave a Reply Cancel reply

Your email address will not be published. Required fields are marked *

Disclaimer

Elearnmarkets (Kredent InfoEdge Pvt. Ltd.) is a SEBI-registered Research Analyst (RA) entity (SEBI Registration No.: INH300007493). The information provided in this article is for educational and informational purposes only and should not be considered as an offer to buy or sell any securities or investment products.

The stocks, securities, and investment instruments mentioned herein are not recommendations under SEBI (Research Analysts) Regulations, 2014. Readers are advised to conduct their own due diligence and seek independent financial advice before making any investment decisions.

Investments in securities markets are subject to market risks. Please read all related documents carefully before investing. Investing in Equity Shares,
Derivatives, Mutual Funds, or other instruments carry inherent risks, including potential loss of capital. Elearnmarkets (Kredent InfoEdge Pvt. Ltd.) does not provide any guarantee or assurance of returns on any investments. Past performance is not indicative of future performance.

Elearnmarkets Logo

Follow Us

Facebook-f X-twitter Instagram Linkedin-in Youtube Telegram

Register on Elearnmarkets

Continue your financial learning by creating your own account on Elearnmarkets.com

Register Free Account

Download App

Playstore logo
Download on app store

Categories

  • Basic Finance
  • Derivatives
  • Financial Planning
  • Fundamental Analysis
  • Technical Analysis
  • Mutual Funds
  • Miscellaneous

Popular On Elearnmarkets

  • Market Superheroes:
  • Vivek Bajaj
  • Chetan Panchamia
  • Ashish Kyal
  • Premal Parekh
  • Abhijit Paul
  • Jegan
  • Sivakumar Jayachadran
  • Jyoti Budhia
  • Vivek Gadodia
  • Vishal Mehta
  • Piyush Chaudhry
  • Santosh Pasi
  • Gomathi Shankar
  • Market Superheroes:
  • Vivek Bajaj
  • Chetan Panchamia
  • Ashish Kyal
  • Premal Parekh
  • Abhijit Paul
  • Jegan
  • Sivakumar Jayachadran
  • Jyoti Budhia
  • Vivek Gadodia
  • Vishal Mehta
  • Piyush Chaudhry
  • Santosh Pasi
  • Gomathi Shankar
  • Courses:​
  • Options Trading
  • Dow Theory
  • Momentum Trading
  • Stock Investing
  • Harmonic Chart Patterns
  • Algo Trading
  • Elliot Wave Theory
  • Advanced Excel
  • Cryptocurrency
  • NSE Certification Course
  • Courses:​
  • Options Trading
  • Dow Theory
  • Momentum Trading
  • Stock Investing
  • Harmonic Chart Patterns
  • Algo Trading
  • Elliot Wave Theory
  • Advanced Excel
  • Cryptocurrency
  • NSE Certification Course
  • Webinars:
  • Bank Nifty Scalping
  • Intraday Trading Strategies
  • Options Trading Strategies
  • Options selling
  • Price Action
  • Relative Strength
  • Tax Planning
  • Options Buying
  • Growth Stocks
  • Portfolio Management
  • Risk Management
  • Renko Charts
  • Crude Oil
  • Traders Psychology
  • Moving Average
  • Multibagger Stocks
  • Free Learning Modules:
  • Intraday Trading
  • Options Scalping
  • Swing Trading
  • Financial Modelling
  • RSI Indicator
  • Bollinger Bands
  • Pricing of Futures
  • Personal Finance
  • Initial Public Offerings (IPO)
  • Value Investing
  • Technical Indicators
  • Candlesticks
  • Chart Patterns
  • Option Greeks
  • ELSS Funds
  • Banking and Insurance
  • Real Estate
  • Gold
  • Book Summaries:
  • Rich Dad Poor Dad
  • Psychology of Money
  • The Intelligent Investor
  • The Richest Man in Babylon
  • Think and Trade Like a Champion
  • Value Investing and Behavioural Finance
  • Trading in the Zone
  • Learn to Earn
  • Book Summaries:
  • Rich Dad Poor Dad
  • Psychology of Money
  • The Intelligent Investor
  • The Richest Man in Babylon
  • Think and Trade Like a Champion
  • Value Investing and Behavioural Finance
  • Trading in the Zone
  • Learn to Earn
  • Tools:
  • CAGR Calculator
  • SIP Calculator
  • eLearnOptions
  • Future Value Calculator
  • Present Value Calculator
  • Atal Pension Yojana
  • Cost of Delay Calculator
  • Become a Crorepati
  • Tools:
  • CAGR Calculator
  • SIP Calculator
  • eLearnOptions
  • Future Value Calculator
  • Present Value Calculator
  • Atal Pension Yojana
  • Cost of Delay Calculator
  • Become a Crorepati

© 2025 Elearnmarkets. All Rights Reserved

  • Visit Elearnmarkets
  • Courses
  • Webinars
  • Financial Guides
  • Get Free Counselling
  • Visit Elearnmarkets
  • Courses
  • Webinars
  • Financial Guides
  • Get Free Counselling

Download Our App

No Result
View All Result
  • Article Categories
    • Basic Finance
    • Derivatives
    • Financial Planning
    • Fundamental Analysis
    • Technical Analysis
    • ETFs & Mutual Funds
    • Marketshala
    • Miscellaneous
  • Language
    • Hindi
    • Bengali
    • English
  • Courses
  • Webinars
  • Stories
Get Free Course

© 2024 Elearnmarkets All Rights Reserved

Guidebook on Savings and Investment
A comprehensive guide book to start your investment journey
Download Guide For FREE
Trading Mentorship Program