Elearnmarkets - Financial Market Learning
  • Courses
  • Webinars
  • Stories
  • Language
    • English
    • Hindi
    • Bengali
No Result
View All Result
Get Free Course
  • Basic Finance
  • Derivatives
    • Futures
    • Options
  • Financial Planning
  • Fundamental Analysis
  • Technical Analysis
  • Mutual Funds
  • Marketshala
  • Miscellaneous
Elearnmarkets - Learn Stock Market, trading, investing for Free
  • Courses
  • Webinars
  • Stories
  • Language
    • English
    • Hindi
    • Bengali
No Result
View All Result
Get Free Course
Elearnmarkets - Learn Stock Market, trading, investing for Free
No Result
View All Result
Home Technical Analysis
How to use Fibonacci Extension

Fibonacci Extension – Levels and Effective Use For Trading

Elearnmarkets by Elearnmarkets
November 25, 2024
in Technical Analysis, Charts, Patterns & Indicators
Reading Time: 9 mins read
0
21.4k
VIEWS
Share on FacebookShare on XShare on WhatsApp

Hindi: आप इस लेख को हिंदी में भी पढ़ सकते है|

Determining support and resistance is quite a common problem faced by most traders. Some of the common methods to determine support and resistance include trend lines, moving averages, super trend, Fibonacci retracement, etc. Today, you will learn how to determine probable support and resistance levels using the Fibonacci Extension.

Table of Contents

  • What is Fibonacci Series
  • What is Fibonacci Extension?
  • Fibonacci Extension Examples:
  • The Difference Between Fibonacci Extensions and Fibonacci Retracements
  • Challenges in Utilizing Fibonacci Extensions
  • Bottomline

What is Fibonacci Series

Fibonacci series incorporates a series of analysis tools on the basis of Fibonacci ratios and sequence showing geometrical law of human behavior and nature which is also applied to financial markets.

The Fibonacci study can be applied to identify probable support and resistance levels by studying Fibonacci numbers in various timeframes.

Fibonacci series is a series of numbers beginning from 0 and arranged in such a manner that any particular number of the series is simply the summation of the previous two numbers which is shown below-

0, 1, 1, 2, 3, 5, 8, 13, 21, 34, 55, 89, 144, 233, 377 and so on.

Lets understand the above logic with an example-

377 = 233 + 144
233 = 144 + 89
144 = 89 + 55
89 = 55 +34 55 = 34 + 21
34 = 21 + 13

And it goes on

An interesting property of this Fibonacci series is that if you simply divide any number in the series by the previous number, the ratio always comes to 1.618; which is considered as the Golden Ratio also referred to as ‘Phi’.

Let’s have a closer look at this-

377/233 = 1.618
233/144 = 1.618
144/89 = 1.618
89/55 = 1.618
55/34 = 1.618
34/21 = 1.618

And so on.

Let’s look at some other properties of this ratio and you will find a unique consistency when a particular number in the Fibonacci series is divided by a number two place prior to the given number. For instance:

377/144 = 2.618
233/89 = 2.618
144/55 = 2.618
89/34 = 2.618
55/21 = 2.618

And it goes on

Similar consistency can be seen when any number in the Fibonacci series is divided by a number three prior to the given number. For example:

377/89 = 4.236
233/55 = 4.236
144/34 = 4.236
89/21 = 4.236
55/13 = 4.236

What is Fibonacci Extension?

Fibonacci Extension is drawn by joining three points, unlike Fibonacci Retracement which has just two points by joining the lowest and the highest points of a pre-defined trend and vice versa.

Let’s understand how we can draw Fibonacci Extension in case of an uptrend. You need to join the lowest and the highest point and then after a retracement or a correction, the price continues in the direction of the original trend, the low of the retracement or a pullback would be our third point.

For example, suppose a stock moved from Rs 100 to Rs 200 and say after a retracement till 160, the stock moves in the direction of the original trend. So the first point to draw Fibonacci extension would be 100, the second point will be 200 and the third point will be 160. This will give you probable resistance where the stock may face resistance in the near future.

The most common Fibonacci extension levels are 161.8%, 261.8% and 423.6%. Though the ratio may be a little distorted at the beginning of the sequence as the number gets bigger, the above-proved ratio appears. Though these are quite far-off numbers, so the other important resistance levels using Fibonacci extension come at 50%, 61.8%, 78.6%, and 100%, the derivation of these numbers is discussed in last week’s article on the Fibonacci retracement.

When the stock is trading at a lifetime high area where there is no prior resistance, you may draw probable resistance levels using the Fibonacci extension.

Fibonacci Extension Examples:

Let’s look at some of the practical examples to gain more clarity about the concept of Fibonacci extension.

Fibonacci Extension example - Tata Chemicals Ltd.

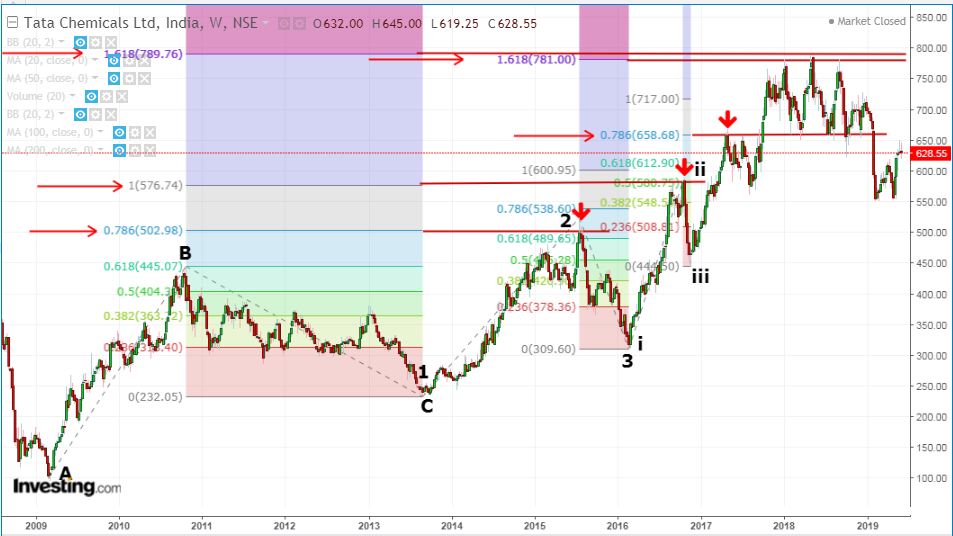
The above chart is an example of Tata Chemicals in the weekly chart and a total of three Fibonacci extensions have been drawn in the above chart to show the number of resistance identified using the above logic. Let’s look at the Fibonacci extensions one by one.

In the case of Fibonacci extension ABC, the stock faced resistance from 78.6% extension (503) on 20th July 2015 and witnessed a sharp selloff after it failed to close below 500 level and made a low of 309.6.

The next 100% extension of ABC acted as strong resistance at around 580 levels on 17th July 2016 and cracked about 23% from the highs.

Now in the case of Fibonacci extension (i ii iii), the rally which started in the month of November 2016; the stock faced resistance from 78.6% extension (660) and corrected about 100 points from the highs.

The recent correction which started from the beginning of the year 2018 and continued more than a year’s time, faced resistance right at the convergence of 161.8% extension of both ABC and 123 Fibonacci extensions and cracked about 30% from the highs.

A slight touch of Fibonacci retracement will be a revision of the article discussed a few weeks ago. The correction which started in 2018 got reversed right 50% Fibonacci retracement after making a double bottom almost at 550.

Here are some other examples of Fibonacci extension in recent days.

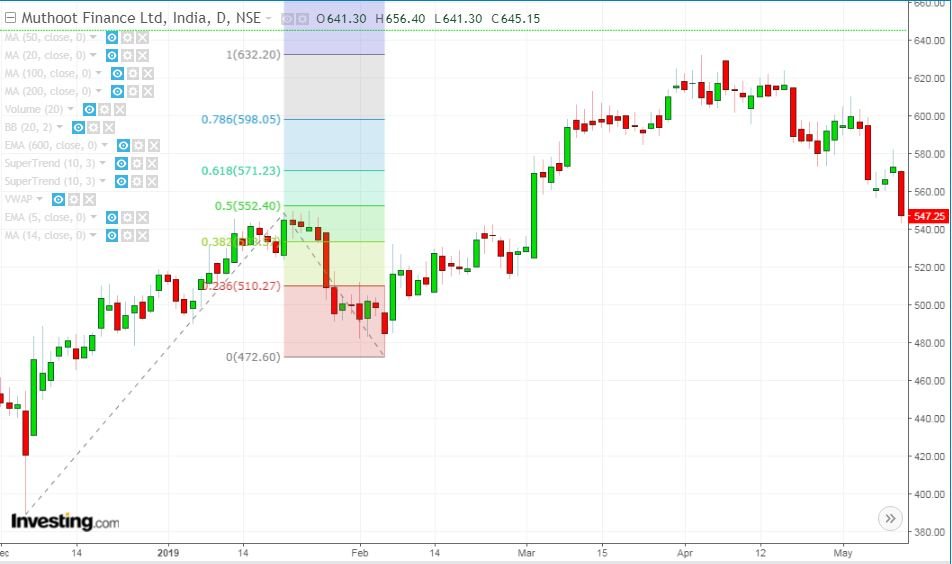
The below is an example of Muthoot Finance and as you can see in the chart, the stock faced slight resistance from 61.8% and 78.6% retracement and finally faced strong resistance from 100% extension at 632 level in the first week of April 2019 and cracked almost 14% from the highs.

Fibonacci Extension example - Muthoot Finance Ltd.

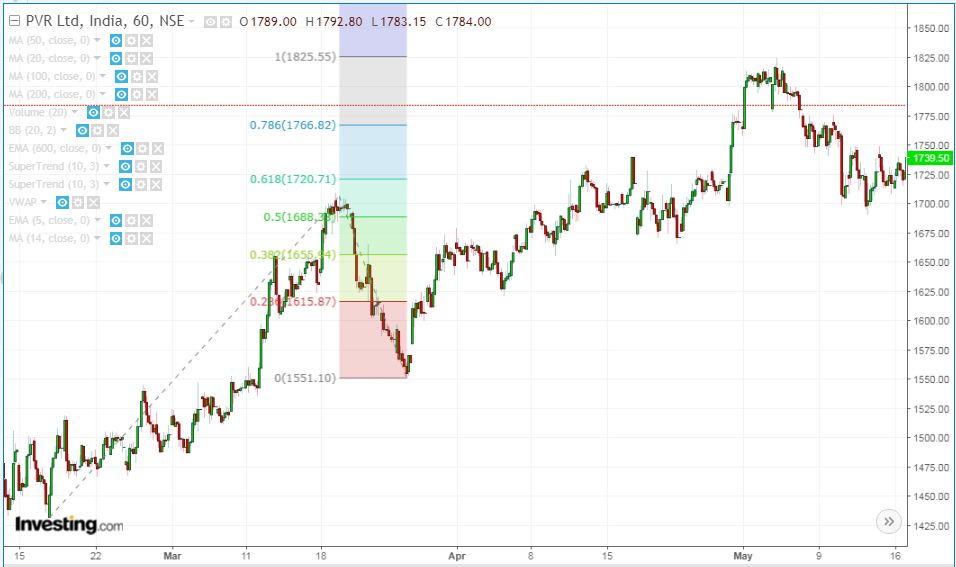
The below is an example of PVR ltd and as you can see in the hourly chart that the stock faced resistance from100% Fibonacci extension in the first week of May 2019 and cracked more than 7% from the high.

Fibonacci Extension example - PVR Ltd.

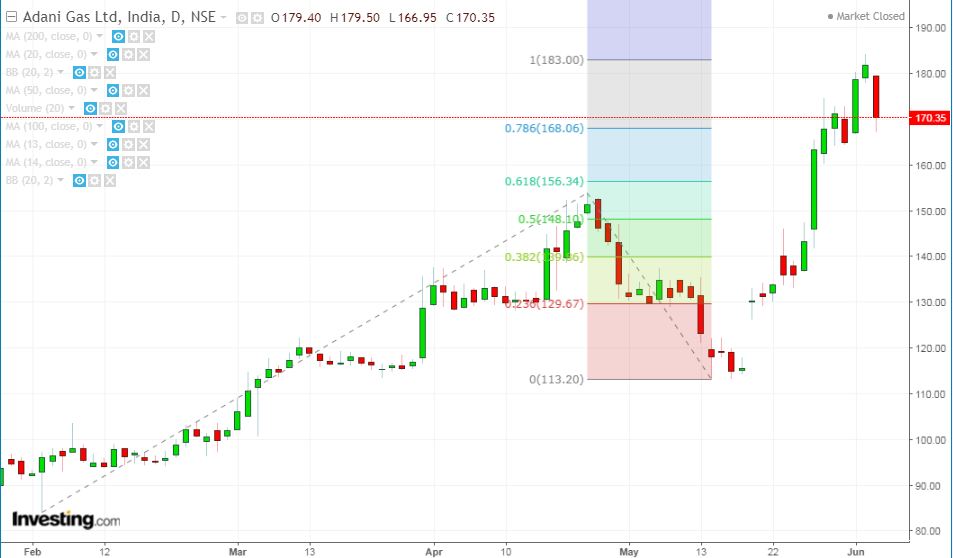
The next example is of Adani Gas which recently faced resistance from 100% extension and just started to witness correction. The further move will be unfolded in the coming period.

example - Adani Gas Ltd.

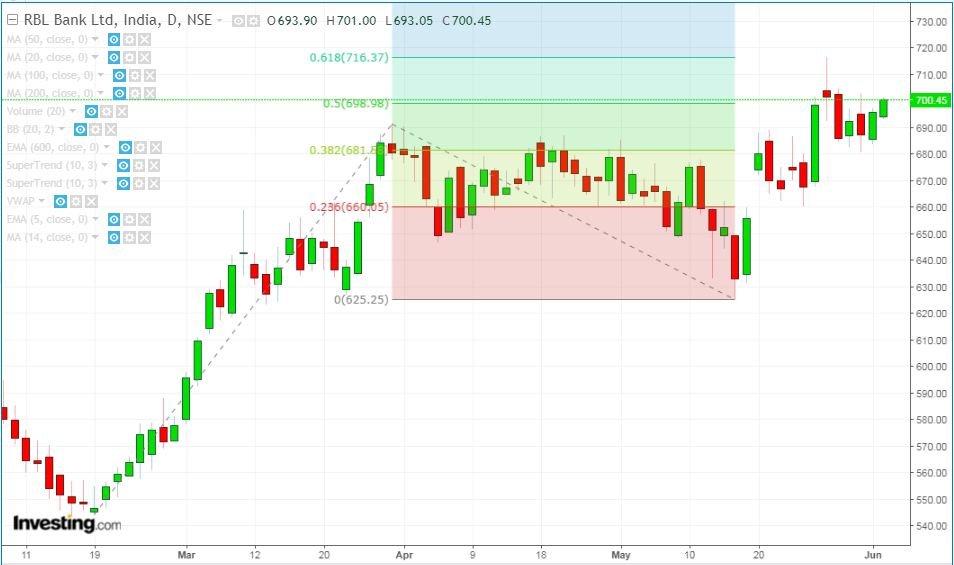
The next one is a daily chart of RBL bank and as you can see in the below chart that the stock faced resistance from 61.8% Fibonacci extension and cracked more than 7.5% in such a short span.

example - RBL Bank Ltd.

The Difference Between Fibonacci Extensions and Fibonacci Retracements

Although they are both employed in technical analysis, Fibonacci retracements and extensions have different uses. Fibonacci retracements are useful for identifying possible levels of reversal inside a price trend. They are commonly employed to determine support or resistance when a price pullback takes place within an established trend. Retracement levels of 38.2%, 50%, and 61.8% are typical ones.

Fibonacci extensions, on the other hand, forecast possible price goals or continuation points beyond the present price trend. They are frequently used to determine when to take a profit or to anticipate future support and resistance. Important extension values include 161.8%, 138.2%, and 123.6%. Retracements essentially concentrate on corrections, whereas extensions concentrate on trend continuations.

Unlock Your Financial Potential: Enroll in Our Technical Analysis Course Today!

Challenges in Utilizing Fibonacci Extensions

Technical analysts frequently employ Fibonacci extensions to forecast possible financial market support and resistance levels. Their use is not without difficulties, though. The following are some of the main difficulties traders go into while using Fibonacci extensions:

Subjectivity in the Application:

Swing Selection: It can be arbitrary to determine the right swing high and swing low when drawing Fibonacci extensions. Different points may be selected by different traders, resulting in varied levels of extension.

Various Timeframes: Fibonacci extensions’ efficacy can change depending on the timeframe. On an intraday chart, a level that seems noteworthy on a daily chart may not be relevant.

Bottomline

Though Fibonacci is one of the useful methods to analyze your chart it doesn’t provide an exact entry point rather an estimated area of entry. Moreover, there is no guarantee that the price will reverse from any specified Fibonacci extension level and hence you should combine it with other technical parameters as a confirmation.

Tags: advanceenglishfibonaccifibonacci and stock market analysisfibonacci levelsfibonacci ratio in nature
Share3TweetSend
Get Kotak Offer Get Kotak Offer Get Kotak Offer
Previous Post

25 Stock Market Terms a beginner should know

Next Post

Fibonacci Retracement – How to use it while trading stocks

Elearnmarkets

Elearnmarkets

Elearnmarkets (ELM) is a complete financial market portal where the market experts have taken the onus to spread financial education. ELM constantly experiments with new education methodologies and technologies to make financial education effective, affordable and accessible to all. You can connect with us on Twitter @elearnmarkets.

Related Posts

Understand Slippage in Trading
Technical Analysis

What is Slippage in Trading? Meaning & Examples

March 28, 2025
284
Breakout trading strategies
Technical Analysis

Top 5 Breakout Trading Strategies

March 12, 2025
1k
5 stocks for today
Technical Analysis

5 Stocks to Buy Today That Could Beat the NIFTY in 2025!

May 5, 2025
390
Image describing What is marginal trading facility
Technical Analysis

 What is a Margin Trading Facility? Advantages & Risks

April 4, 2025
657

Leave a Reply Cancel reply

Your email address will not be published. Required fields are marked *

Disclaimer

Elearnmarkets (Kredent InfoEdge Pvt. Ltd.) is a SEBI-registered Research Analyst (RA) entity (SEBI Registration No.: INH300007493). The information provided in this article is for educational and informational purposes only and should not be considered as an offer to buy or sell any securities or investment products.

The stocks, securities, and investment instruments mentioned herein are not recommendations under SEBI (Research Analysts) Regulations, 2014. Readers are advised to conduct their own due diligence and seek independent financial advice before making any investment decisions.

Investments in securities markets are subject to market risks. Please read all related documents carefully before investing. Investing in Equity Shares,
Derivatives, Mutual Funds, or other instruments carry inherent risks, including potential loss of capital. Elearnmarkets (Kredent InfoEdge Pvt. Ltd.) does not provide any guarantee or assurance of returns on any investments. Past performance is not indicative of future performance.

Elearnmarkets Logo

Follow Us

Facebook-f X-twitter Instagram Linkedin-in Youtube Telegram

Register on Elearnmarkets

Continue your financial learning by creating your own account on Elearnmarkets.com

Register Free Account

Download App

Playstore logo
Download on app store

Categories

  • Basic Finance
  • Derivatives
  • Financial Planning
  • Fundamental Analysis
  • Technical Analysis
  • Mutual Funds
  • Miscellaneous

Popular On Elearnmarkets

  • Market Superheroes:
  • Vivek Bajaj
  • Chetan Panchamia
  • Ashish Kyal
  • Premal Parekh
  • Abhijit Paul
  • Jegan
  • Sivakumar Jayachadran
  • Jyoti Budhia
  • Vivek Gadodia
  • Vishal Mehta
  • Piyush Chaudhry
  • Santosh Pasi
  • Gomathi Shankar
  • Market Superheroes:
  • Vivek Bajaj
  • Chetan Panchamia
  • Ashish Kyal
  • Premal Parekh
  • Abhijit Paul
  • Jegan
  • Sivakumar Jayachadran
  • Jyoti Budhia
  • Vivek Gadodia
  • Vishal Mehta
  • Piyush Chaudhry
  • Santosh Pasi
  • Gomathi Shankar
  • Courses:​
  • Options Trading
  • Dow Theory
  • Momentum Trading
  • Stock Investing
  • Harmonic Chart Patterns
  • Algo Trading
  • Elliot Wave Theory
  • Advanced Excel
  • Cryptocurrency
  • NSE Certification Course
  • Courses:​
  • Options Trading
  • Dow Theory
  • Momentum Trading
  • Stock Investing
  • Harmonic Chart Patterns
  • Algo Trading
  • Elliot Wave Theory
  • Advanced Excel
  • Cryptocurrency
  • NSE Certification Course
  • Webinars:
  • Bank Nifty Scalping
  • Intraday Trading Strategies
  • Options Trading Strategies
  • Options selling
  • Price Action
  • Relative Strength
  • Tax Planning
  • Options Buying
  • Growth Stocks
  • Portfolio Management
  • Risk Management
  • Renko Charts
  • Crude Oil
  • Traders Psychology
  • Moving Average
  • Multibagger Stocks
  • Free Learning Modules:
  • Intraday Trading
  • Options Scalping
  • Swing Trading
  • Financial Modelling
  • RSI Indicator
  • Bollinger Bands
  • Pricing of Futures
  • Personal Finance
  • Initial Public Offerings (IPO)
  • Value Investing
  • Technical Indicators
  • Candlesticks
  • Chart Patterns
  • Option Greeks
  • ELSS Funds
  • Banking and Insurance
  • Real Estate
  • Gold
  • Book Summaries:
  • Rich Dad Poor Dad
  • Psychology of Money
  • The Intelligent Investor
  • The Richest Man in Babylon
  • Think and Trade Like a Champion
  • Value Investing and Behavioural Finance
  • Trading in the Zone
  • Learn to Earn
  • Book Summaries:
  • Rich Dad Poor Dad
  • Psychology of Money
  • The Intelligent Investor
  • The Richest Man in Babylon
  • Think and Trade Like a Champion
  • Value Investing and Behavioural Finance
  • Trading in the Zone
  • Learn to Earn
  • Tools:
  • CAGR Calculator
  • SIP Calculator
  • eLearnOptions
  • Future Value Calculator
  • Present Value Calculator
  • Atal Pension Yojana
  • Cost of Delay Calculator
  • Become a Crorepati
  • Tools:
  • CAGR Calculator
  • SIP Calculator
  • eLearnOptions
  • Future Value Calculator
  • Present Value Calculator
  • Atal Pension Yojana
  • Cost of Delay Calculator
  • Become a Crorepati

© 2025 Elearnmarkets. All Rights Reserved

  • Visit Elearnmarkets
  • Courses
  • Webinars
  • Financial Guides
  • Get Free Counselling
  • Visit Elearnmarkets
  • Courses
  • Webinars
  • Financial Guides
  • Get Free Counselling

Download Our App

No Result
View All Result
  • Article Categories
    • Basic Finance
    • Derivatives
    • Financial Planning
    • Fundamental Analysis
    • Technical Analysis
    • ETFs & Mutual Funds
    • Marketshala
    • Miscellaneous
  • Language
    • Hindi
    • Bengali
    • English
  • Courses
  • Webinars
  • Stories
Get Free Course

© 2024 Elearnmarkets All Rights Reserved

A Handbook of Technical Analysis
To start your trading journey as a seasoned technical analyst
Download Guide For FREE
Guidebook On Chart Patterns
Take Your Trading To The Next Level With Strategies Shared In This Ebook
Download Guide For FREE
Trading Day 2025