Elearnmarkets - Financial Market Learning
  • Categories
    • Basic Finance
    • Derivatives
      • Futures
      • Options
    • Financial Planning
    • Fundamental Analysis
    • Technical Analysis
    • Marketshala
    • Miscellaneous
  • Language
    • English
    • Hindi
    • Bengali
No Result
View All Result
  • Courses
  • Webinars
  • Stories
Elearnmarkets - Learn Stock Market, trading, investing for Free
No Result
View All Result
Home Technical Analysis
Technical Indicator that reflect Volatility in the Market 1

Technical Indicator that reflect Volatility in the Market

Elearnmarkets by Elearnmarkets
July 18, 2023
in Technical Analysis, Charts, Patterns & Indicators
Reading Time: 7 mins read
1
6.4k
VIEWS
Share on FacebookShare on XShare on WhatsApp

The stock market not only consolidates or trends but also deals with different types of technical indicator volatility in the market.

This is why it is important to use such Indicators which reflect the volatility

Understanding and using technical indicator volatility can help you trade more effectively and also help you to keep your expectations in check.

In the worst scenario, volatile periods in the market can create wild swings that can make it difficult to trade.

It is usually seen that the market is extremely volatile after certain news or world events that are extreme in nature.

The most current example of such an event is the Indian elections. The month of an election has just started and we can see India Vix up by 10%- 15% every day.

Usually when the market is trending the volatility is subtle and when the market is consolidating it is more muted.

RelatedPosts

5 Important Volatility Indicators that Traders should know 2

5 Important Volatility Indicators that Traders should know

September 19, 2023
57.7k
Top 5 Momentum Indicators that Analyses Trend Strength 3

Top 5 Momentum Indicators that Analyses Trend Strength

September 7, 2023
93k
5 important roles of Relative Strength Index (RSI) 4

5 important roles of Relative Strength Index (RSI)

September 11, 2023
41.2k

You can see that in most of the charting platforms, there are tools called volatility indicators that help you to objectively measure the level of the volatility and it’s also important to fully understand the tool you are going to use.

Table of Contents
Volatility Index
Average True Range
Bollinger Bands
Key Takeaways

The most commonly used tools which determine volatility are:

  • Volatility Index (India Vix)
  • Average True Range (ATR)
  • Bollinger Bands

Let us discuss them in detail:

1. Volatility Index

Volatile Index is an index that is used to measure the near-term technical indicator volatility expectations of the markets.

Chicago Board Options Exchange (CBOE) introduced volatility as an asset class in the form of an Index in the year 1993.

There is a difference between volatility and market index.

The market index measures the direction of the market and it is calculated by the price movements of underlying stocks.

On the other hand volatility index measures the volatility of the market and is calculated using the order book of the underlying index’s options.

The volatility index of India is popularly known as Indian Vix which was launched by the National Stock Exchange (NSE) in 2008.

India Vix indicates the Indian market’s volatility from the perception of the investors.

A higher value of India Vix indicates higher volatility expectations which means a significant change in Nifty and a similarly lower value of India Vix indicates lower volatility expectations which means a minimal change in Nifty.

India Vix has an inverse relationship with Nifty. When India Vix falls, Nifty rises, and when India Vix rises then Nifty falls.

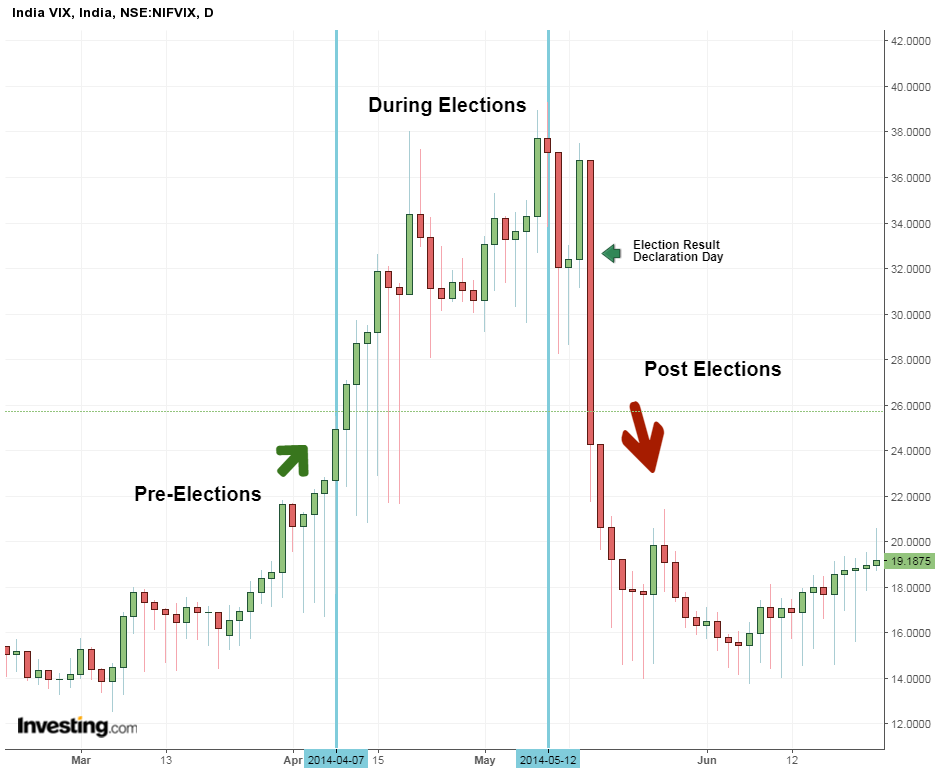
We usually see that during elections India Vix soars up because of so much volatility in the Nifty.
volatility indicator

From the chart above we can see how Volatility acted during the time of the election of 2014. From the beginning month of April volatility started to rise.

During the Elections, the volatility was high making long spikes. On the elections result in declarations day the result was quite obvious that BJP was coming to power and volatility dropped.

We can how the volatility dropped after this big event, elections got over.

2.Average True Range

Average True Range measures the true range of the particular period, typically 14 days.

The true range differs from the real range in the term that it includes the closing price of the prior bar in its calculation.

This indicator is purely a volatile measure and it does not indicate a trend.

One should use ATR as an indication of a change in the nature of the market.

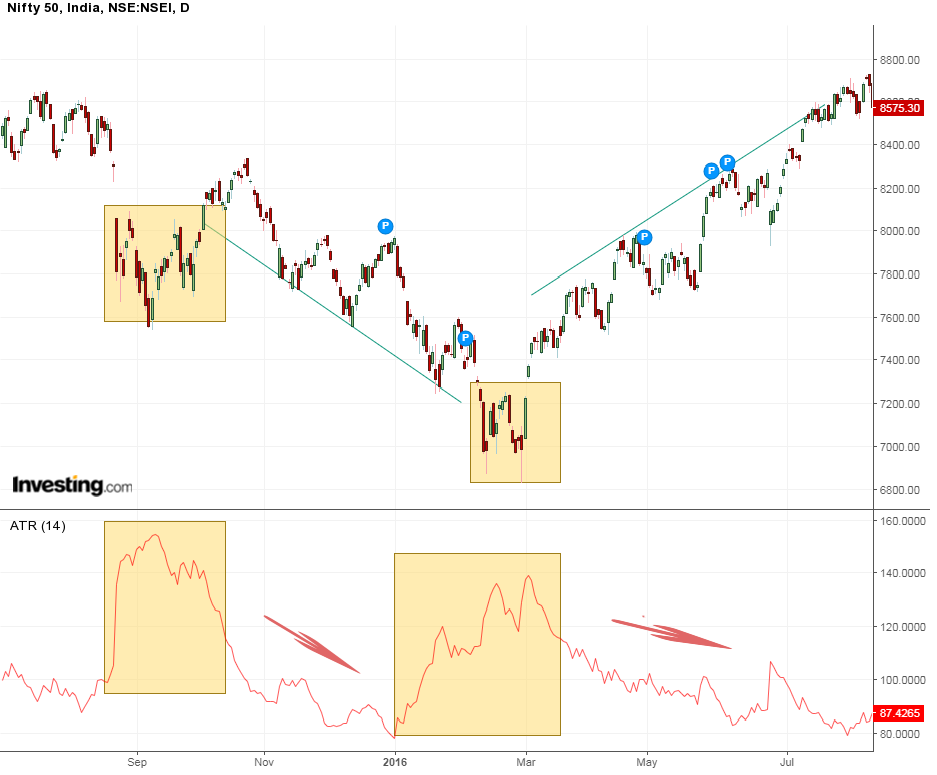
ATR rises when the market moves from a tight consolidation to a strong trend and ATR falls as the market transition shifts from the choppy market into a smooth and strong trend.

The chart below shows a couple of examples where ATR fells as prices begin to trend and rise during the choppy consolidation.
volatility indicator 2

3. Bollinger Bands

Bollinger bands are calculated that is based on the distance of price from a moving average for a specified period of time typically 20 days.

The bands are two standard deviations which are above and below the moving average.

Bollinger bands indicate both direction and volatility.

When price volatility is high then the bands widen, when it’s low then the bands tighten.
Volatility 3

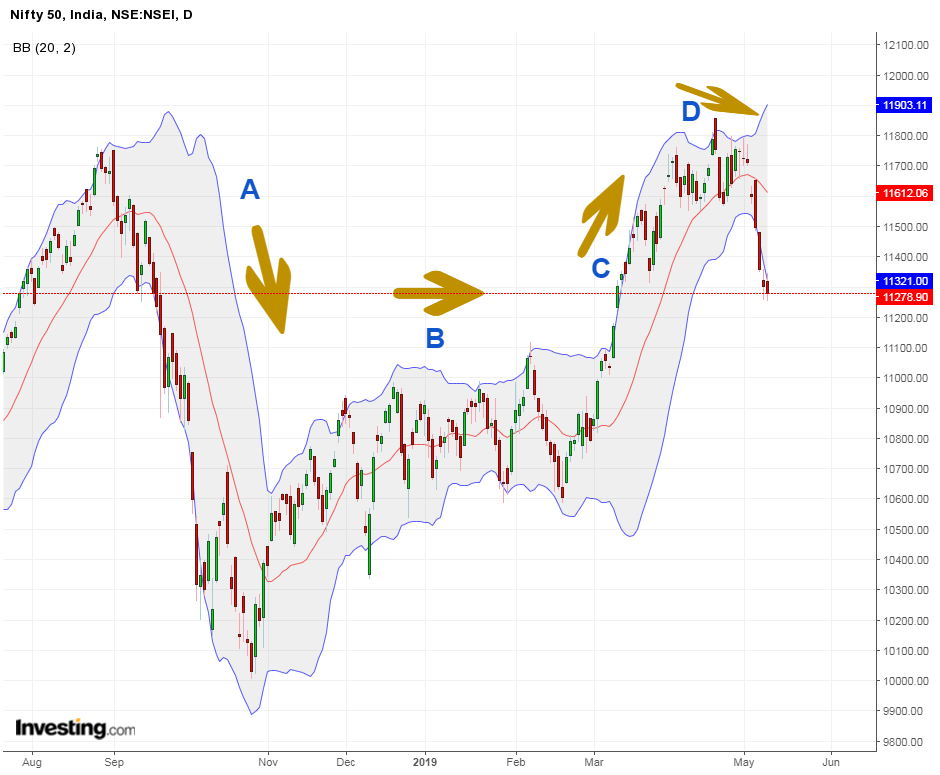
When prices move in a trend, then the bands widen and slope up or down as shown in the area marked “A”.

As long as the price continues to touch the upper or lower band the trend will remain strong. But once the price drop away from the bands then the market is entering a consolidation or reversing.

The transition from a trending market A, to a choppy consolidation market, can be seen clearly from the above chart and we can see how the bands have widened in the transition.

At C, the market again becomes trending and the prices have kept hugging the upper band which means that the uptrend is strong.

At D the markets again become volatile because of elections and we may see some consolidation or reverse at this stage.

The above chart using the Bollinger Bands is telling that one should:

  1. Wait for price to poke outside the bands that indicate a large deviation from normal price and thus high volatility
  2. The price should pull back to the area around the 20 period moving average (there is no magic here)
  3. Also, look for a price pattern to indicate a reversal in price (remember indicators only indicates and confirms the price actions and therefore should be used with price actions)
    Bollinger Bands are excellent volatility as well as trend indicator but like all other indicators, they are not perfect.

They lag price action; therefore they will not catch the beginning or end of a trend.

Key Takeaways:

  • No indicator is perfect therefore one should monitor price action to determine whether the market is trending or consolidating.
  • It is important to monitor volatility in the market as the market is not always trending.
  • The more volatility in the market, the bigger the moves and opportunities are expected.
  • The higher level of volatility which comes with a bear market should be a concern as they will impact the investors’ portfolio.

In order to get the latest updates on Financial Markets visit https://stockedge.com/

Tags: average true rangebollinger bands indicatorenglishIndiavixIndicators and oscillatorsintermediatevolatility
ShareTweetSend
Get Kotak Offer Get Kotak Offer Get Kotak Offer
Previous Post

Nifty Sells Off Partially In Run-Up To 1Q19 GDP Data After A Positive Week

Next Post

Fixed Maturity Plans (FMPs) funds – A Master Guide to invest

Elearnmarkets

Elearnmarkets

Elearnmarkets (ELM) is a complete financial market portal where the market experts have taken the onus to spread financial education. ELM constantly experiments with new education methodologies and technologies to make financial education effective, affordable and accessible to all. You can connect with us on Twitter @elearnmarkets.

Related Posts

5 Important Volatility Indicators that Traders should know 5
Technical Analysis

5 Important Volatility Indicators that Traders should know

September 19, 2023
57.7k
Top 5 Momentum Indicators that Analyses Trend Strength 6
Technical Analysis

Top 5 Momentum Indicators that Analyses Trend Strength

September 7, 2023
93k
5 important roles of Relative Strength Index (RSI) 7
Technical Analysis

5 important roles of Relative Strength Index (RSI)

September 11, 2023
41.2k
NR4 and NR7 Trading Strategy Setup 8
Technical Analysis

NR4 and NR7 Trading Strategy Setup

September 14, 2023
82.3k

Comments 1

  1. froleprotrem says:
    4 years ago

    Normally I don’t read article on blogs, but I would like to say that this write-up very pressured me to take a look at and do so! Your writing style has been amazed me. Thank you, very great article.

    Reply

Leave a Reply Cancel reply

Your email address will not be published. Required fields are marked *

Elearnmarkets Logo

Follow Us

Facebook-f Twitter Instagram Linkedin-in Youtube Telegram

Register on Elearnmarkets

Continue your financial learning by creating your own account on Elearnmarkets.com

Register Free Account

Download App

Playstore logo
Download on app store

Categories

  • Basic Finance
  • Derivatives
  • Financial Planning
  • Fundamental Analysis
  • Technical Analysis
  • Marketshala
  • Miscellaneous

Popular On Elearnmarkets

  • Market Superheroes:
  • Vivek Bajaj
  • Chetan Panchamia
  • Ashish Kyal
  • Premal Parekh
  • Abhijit Paul
  • Jegan
  • Sivakumar Jayachadran
  • Vishal Malkan
  • Jyoti Budhia
  • Vivek Gadodia
  • Vishal Mehta
  • Piyush Chaudhry
  • Santosh Pasi
  • Gomathi Shankar
  • Market Superheroes:
  • Vivek Bajaj
  • Chetan Panchamia
  • Ashish Kyal
  • Premal Parekh
  • Abhijit Paul
  • Jegan
  • Sivakumar Jayachadran
  • Vishal Malkan
  • Jyoti Budhia
  • Vivek Gadodia
  • Vishal Mehta
  • Piyush Chaudhry
  • Santosh Pasi
  • Gomathi Shankar
  • Courses:​
  • Options Trading
  • Dow Theory
  • Momentum Trading
  • Stock Investing
  • Stock Market for Beginners
  • Harmonic Chart Patterns
  • Algo Trading
  • Elliot Wave Theory
  • Advanced Excel
  • Cryptocurrency
  • NSE Certification Course
  • Courses:​
  • Options Trading
  • Dow Theory
  • Momentum Trading
  • Stock Investing
  • Stock Market for Beginners
  • Harmonic Chart Patterns
  • Algo Trading
  • Elliot Wave Theory
  • Advanced Excel
  • Cryptocurrency
  • NSE Certification Course
  • Webinars:
  • Bank Nifty Scalping
  • Intraday Trading Strategies
  • Options Trading Strategies
  • Options selling
  • Price Action
  • Relative Strength
  • Tax Planning
  • Options Buying
  • Growth Stocks
  • Portfolio Management
  • Relative Strength Index
  • Risk Management
  • Renko Charts
  • Crude Oil
  • Traders Psychology
  • Moving Average
  • Multibagger Stocks
  • Free Learning Modules:
  • Intraday Trading
  • Options Scalping
  • Swing Trading
  • Financial Modelling
  • RSI Indicator
  • Bollinger Bands
  • Pricing of Futures
  • Personal Finance
  • Initial Public Offerings (IPO)
  • Value Investing
  • Technical Indicators
  • Candlesticks
  • Chart Patterns
  • Option Greeks
  • ELSS Funds
  • Banking and Insurance
  • Real Estate
  • Gold
  • Book Summaries:
  • Rich Dad Poor Dad
  • Psychology of Money
  • The Intelligent Investor
  • The Richest Man in Babylon
  • Think and Trade Like a Champion
  • Value Investing and Behavioural Finance
  • Trading in the Zone
  • Learn to Earn
  • Book Summaries:
  • Rich Dad Poor Dad
  • Psychology of Money
  • The Intelligent Investor
  • The Richest Man in Babylon
  • Think and Trade Like a Champion
  • Value Investing and Behavioural Finance
  • Trading in the Zone
  • Learn to Earn
  • Tools:
  • CAGR Calculator
  • SIP Calculator
  • eLearnOptions
  • Future Value Calculator
  • Present Value Calculator
  • Atal Pension Yojana
  • Cost of Delay Calculator
  • Become a Crorepati
  • Tools:
  • CAGR Calculator
  • SIP Calculator
  • eLearnOptions
  • Future Value Calculator
  • Present Value Calculator
  • Atal Pension Yojana
  • Cost of Delay Calculator
  • Become a Crorepati

© 2023 Elearnmarkets. All Rights Reserved

  • Visit Elearnmarkets
  • Courses
  • Webinars
  • Financial Guides
  • Get Free Counselling
  • Visit Elearnmarkets
  • Courses
  • Webinars
  • Financial Guides
  • Get Free Counselling

Get Elearnmarkets App

No Result
View All Result
  • Article Categories
    • Basic Finance
    • Derivatives
    • Financial Planning
    • Fundamental Analysis
    • Technical Analysis
    • Marketshala
    • Miscellaneous
  • Language
    • Hindi
    • Bengali
    • English
  • Courses
  • Webinars
  • Stories

© 2020 Elearnmarkets All Rights Reserved

View Details
View Course Details
Guidebook On Chart Patterns
Take Your Trading To The Next Level With Strategies Shared In This Ebook
Download Now