Technical Analysis

Discover the power of technical analysis in the world of trading. This comprehensive guide will teach you the ins and outs of analyzing market trends and making informed investment decisions.

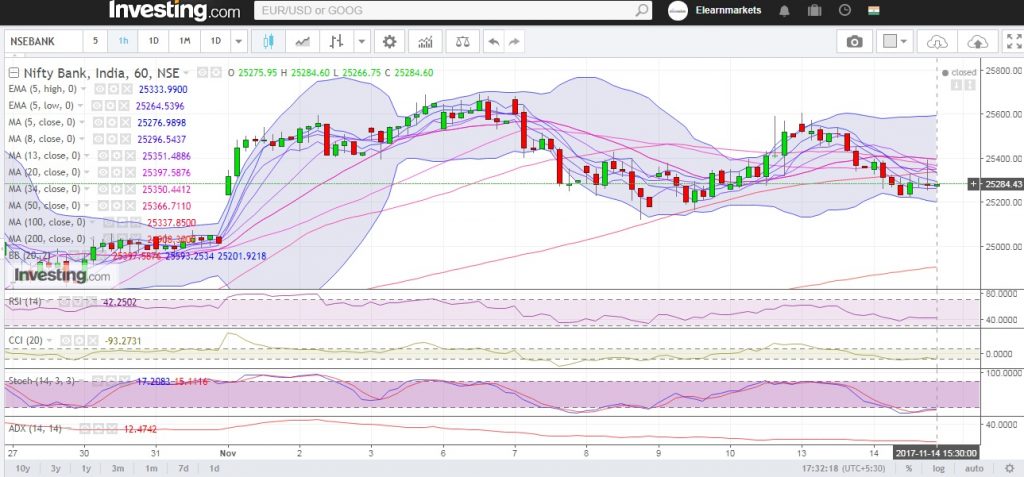
Bank Nifty Hourly Chart

Bank Nifty might slip into a narrow trading corridor

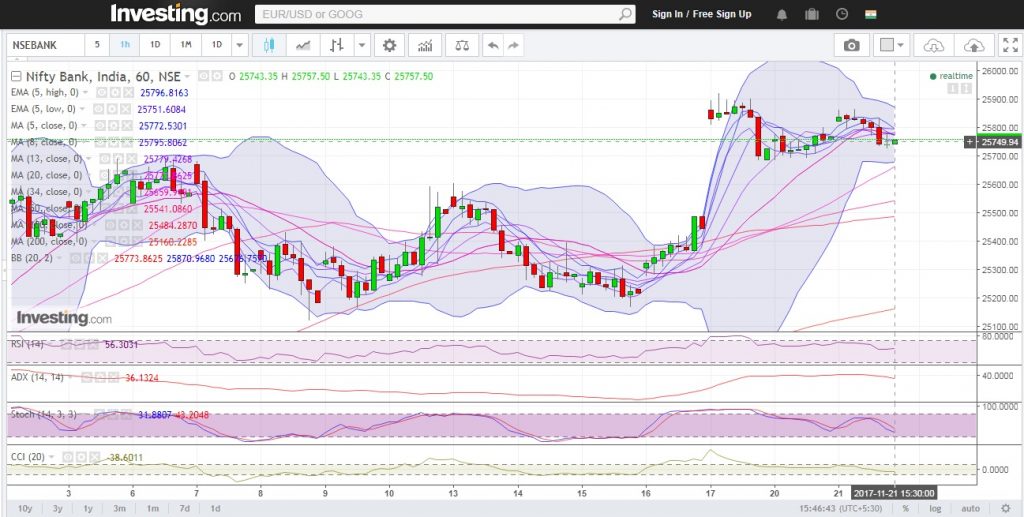
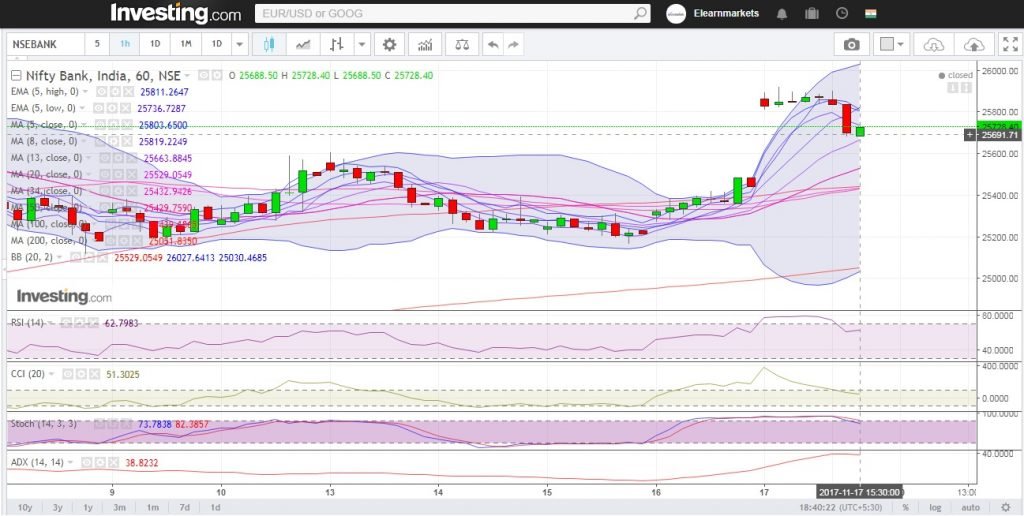
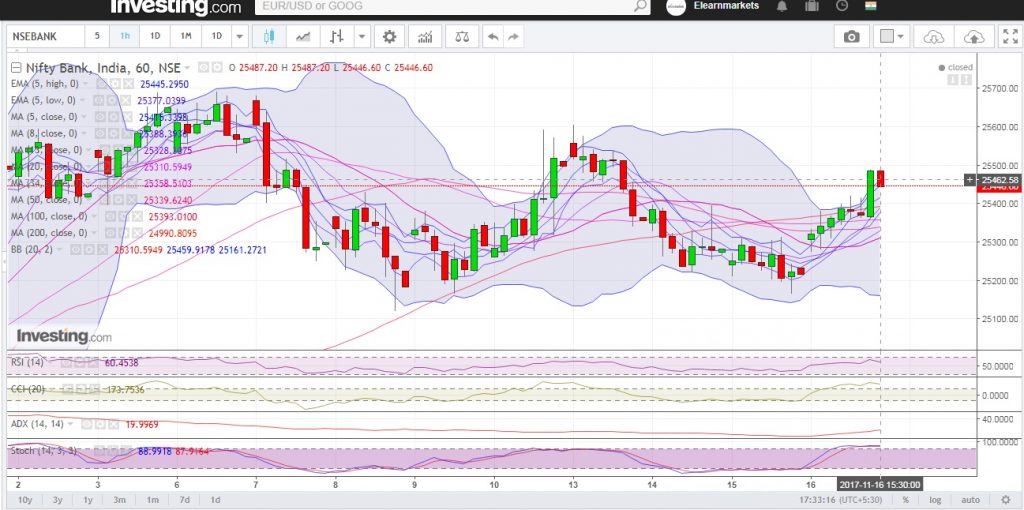
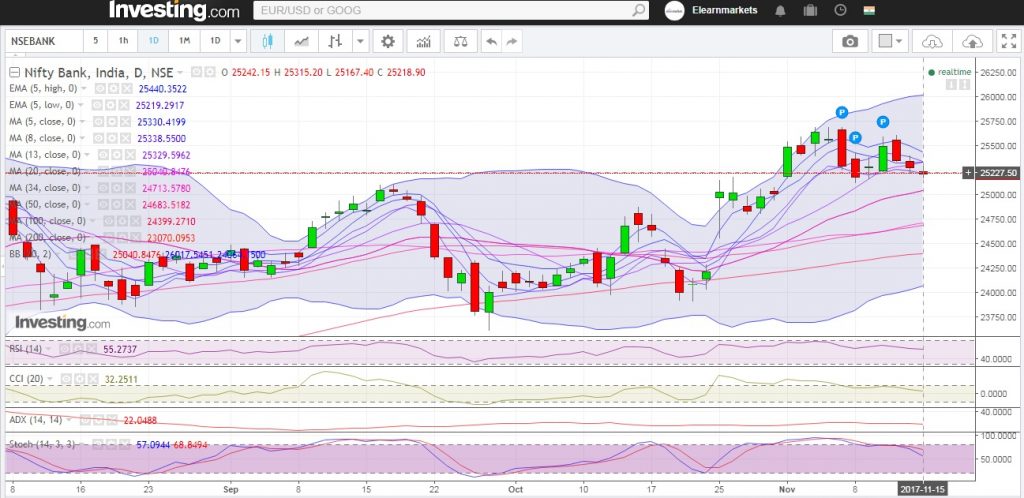
Bank Nifty opened above its 5 Day High EMA (25559 approx) today . The Index traded in a range of 265 points  and closed below its opening price. Hourly Technicals: In the Hourly Chart, Bank Nifty has closed at  its 34 HEMA of (25356 approx).The Index is likely to face immediate resistance above its 5 hourly low EMA (25396 approx). Hourly RSI stands close to the lower end of the normal range while the CCI is indicating that sentiments are negative. ADX is indicating that Bank Nifty might not undergo volatility yet. Figure: Bank-Nifty Hourly Chart Daily Technicals: The daily chart indicates that Bank Nifty has closed  below  its 5 day high EMA (25550 approx). The Index will face immediate resistance around its 8 DMA(25410 approx). On the downside however, if Bank Nifty breaks and closes below its 5 DMA (25326 approx), it could find support at its 5 day low EMA (25257 approx). The daily RSI indicator has closed midway between the normal range.The CCI indicator however is indicating that sentiments are still positive.The ADX indicates that momentum might remain slack. Figure: Bank-Nifty Daily Chart Figure: Bank-Nifty Tech Table

Page 20 of 27 1 19 20 21 27