Price Action Trading? Yes, price action forms the basis of technical analysis and helps you in timing entries and exits better without relying on news or opinions.
Many short-term traders mainly rely on price action and the formations and trends that help them make trading decisions.
Price action can be analyzed using charts that plot prices over time. Traders use the different charts to improve their ability to analyze trends, breakouts and reversals.
But the main problem here is that since there’s so much information out there like candlestick patterns, chart patterns, trendlines, etc. it makes it challenging to take trading decisions.
Novice traders often have this questions-Where do I start? What should I look for?
So in today’s blog, we will discuss 7 things you should consider before placing an order when doing advanced price action trading-
1. Market Structure
The first thing that a price action trader should see is the market structure, i.e. which stage the market is in.
The market structure consists of 4 stages:
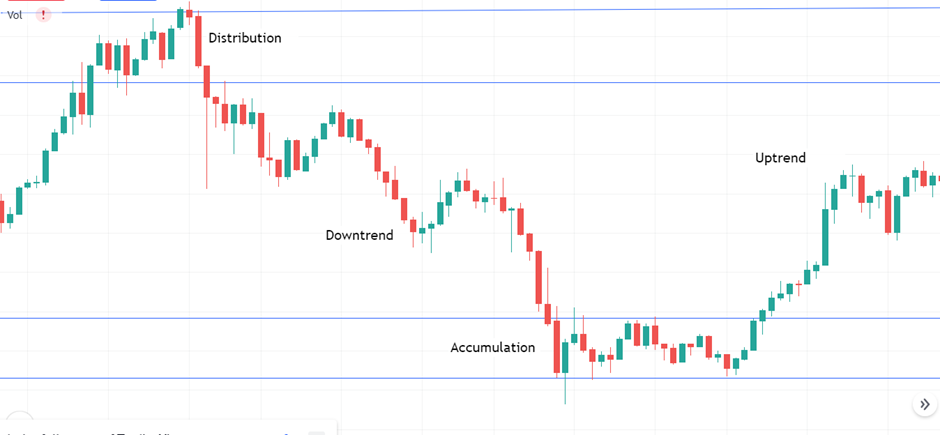
Stage 1- Accumulation
The accumulation stage occurs when the market has bottomed, and the early buyers begin to buy, figuring that the worst is over.
This stage looks like a range market but in a downtrend. When the price moves lower, bullish traders start buying as they consider the prices “too low” which exerts buying pressure in the market.
Aso, bearish traders in there in the market who keep on selling, in the hope that the downtrend will continue.
When we combine both buying and selling pressure, the market reaches an equilibrium stage and consolidates. If the prices break upside, then we can say that the market has bottomed and the trend has reversed to uptrend as shown below:
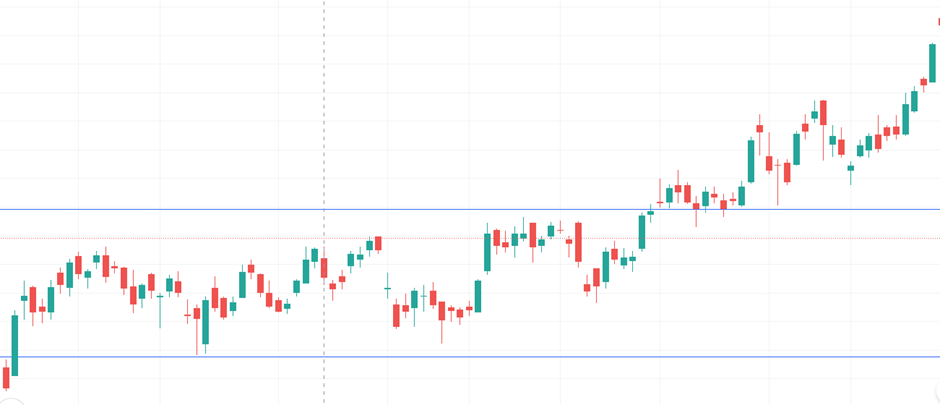
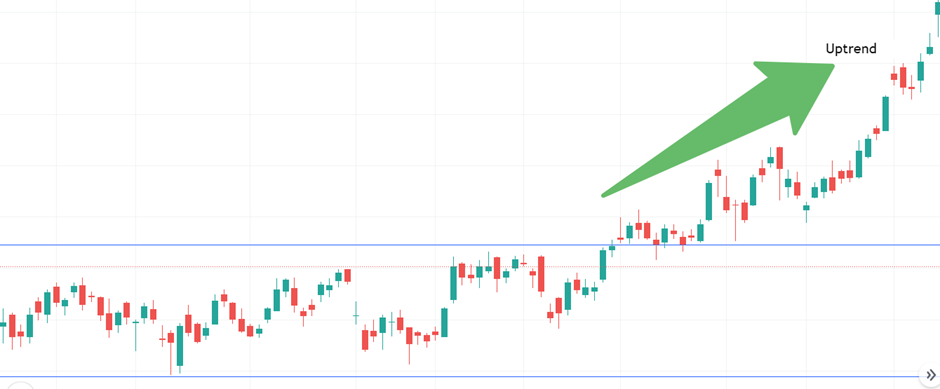
Stage 2- Advancing
The advancing stage occurs when the market has been stable for a while and starts moving higher.
At this stage, most traders start recognizing the uptrend and are looking for buying opportunities.
Stage 3- Distribution
The distribution stage looks like a range market but in an uptrend.
When the price moves higher, bearish traders enter and start taking short positions as the prices are considered to be “too high” which puts selling pressure on the market. But, at the same time, there are still bullish traders who are still buying, hoping that the trend will continue.
When we combine both buying and selling pressure, then the market consolidates. If the price breaks below the lowest level, we enter the last stage i.e. downtrend.
Stage 4- Downtrend
When the prices start making lower lows, we can say that the downtrend has begun, which is the last stage.
So before placing any trading order, one needs to understand in which stage the market is in, as explained above. This will help the price action traders to understand whether to buy, sell, or stay out of the markets.

2. Support and Resistance
After seeing which stage the stock/market is in, the price action needs to decide whether to buy or sell.
If the market is in an advancing phase, one can initiate long positions; however, if the market is in a downtrend phase, one can initiate short positions.
After making this decision, one needs to analyze the support and resistance levels, i.e. the potential buying or selling pressure zones.
Support is a zone of potential buying pressure where buyers could step in and push the price higher, whereas resistance is a zone where sellers could step in and push the price lower.
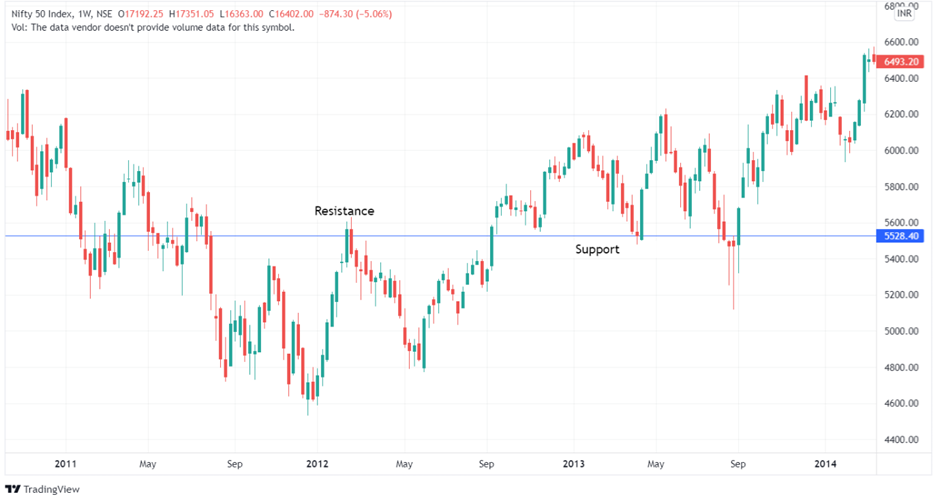
The support and resistance zone tells us where to buy and sell. If the prices reverse back from the resistance level, one can short the stock.
And if the prices reverse back from the support level, one can buy the stock.
And now the question is, When do you enter a trade?
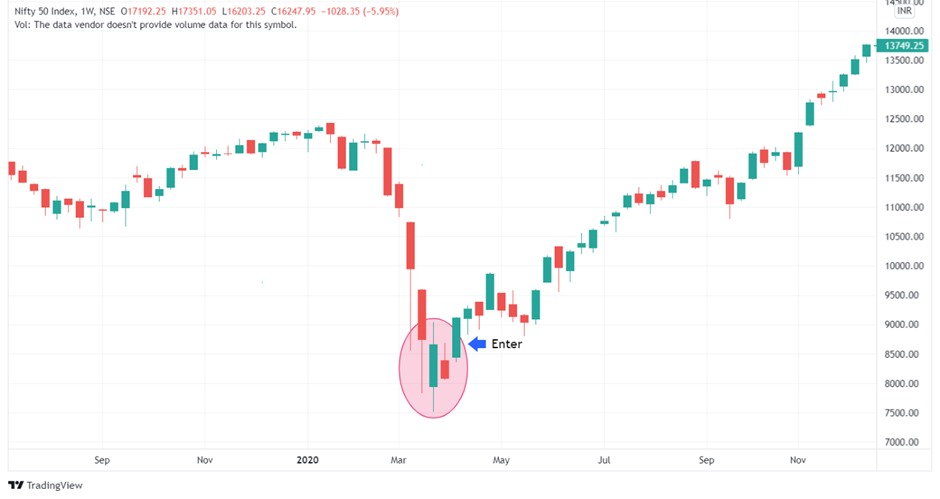
3. Entry Level
When the prices breakout from any price pattern, candlesticks, support or resistance levels, the price action trader can take a long/short position at that point.
But wait!! Don’t enter the position as soon as the breakout happens. Instead, one should wait for the closing price or the next trading session, and if it sustains the breakout, the trader can take a buy or short position.
For example, if you see a Bullish Harami candlestick pattern after the downtrend, you should enter a long position if the prices open higher the next day.
4. Stop Loss
Wait! Are you entering your long or short position without determining the stop-loss level? If yes! Then you are making a terrible mistake due to which you can suffer a lot of losses!
Even the best trading setup could result in a loser. This is why it is important to know when to get out of your trade before things get worst.
And this can be solved by using stop-loss, which will help you protect your position so that you don’t incur losses if the trade goes against your expectations.
Now the question comes where I should put stop-loss. Well, there are many ways to determine that.
For example, if you spot a Bullish Harami candlestick pattern, then you can place a stop loss at the support or low of the previous day’s candlestick.
5. Higher-Timeframe
But did you look at the higher timeframe trend before placing the trading order to buy or sell?
Yes, it’s important to us to look at the higher-timeframe trend i.e., if you trade by using daily charts, you should also look at the weekly charts to determine whether the trend is in uptrend or downtrend.
6. Volume
Also, looking at the volume is important before placing your order. If there is no rise in the volume when the breakout happens, then the price action trader should be doubtful in taking that position.
A trend reversal should always be supported by an increase in volume. There are many volume indicators with the help of which you can analyze volume in the stock.
7. Exit Level
You should also determine the exit level before even entering the position. Yes! It is also important to determine the exit level before we place the buy/sell order.
The exit level can be determined by a certain percentage, support/resistance level, or the price target in the case of chart patterns.
After determining all the above things, you are now ready to place your trading order, whether long or short!
To learn more about price action strategies, you can any of the following courses and webinars as discussed below:
Webinars on Price Action Trading
1. Price Action and Pullback Trading
The beauty of a well-thought-out pullback trading system is that you enter the market or place your first trade only after confirming how the market is going.
Doing this will help you eliminate entering the market with a false signal. Pullback trading is a fantastic starting point for new traders.
This Webinar will cover price action and pullback concepts along with complete price action and Pullback Trading system.
2. Precision Price Action Trading
Precision Price Action is an art of trading in the stock markets without using any of the indicators.
Price is always the leading and driving force in the market. Learn the art of studying and learning price behavior without using any indicators.
3. Understanding Price Action Trading in Technical Analysis
In simple terms, Price Action Trading is underrated in technical analysis and often ignored by traders.
This webinar aims to prove the importance of price action trading and Dow theory with practical chart examples which will release the complicated approach towards trading rather than looking into complex trading systems.
4. Smart Reversal Price Action Strategy
Price Action is the art of trading the financial markets without a single indicator. Instead, the price itself is the key to making most of your decisions.
Price is the ultimate truth that is in sync with reality. With the help of this webinar on price action, one can understand the power of Reversal’s strategy to trade strong retracements.
This concept is crystal clear with specific rules and strong entry, stop loss and target levels. There is absolutely no discretion in this journey.
Want to learn multi-asset trading and be an all-season trader? Join India’s 1st Multi-Asset Trading Mentorship Program.
Ready to master advanced technical analysis? Enroll now in our Technical Analysis Advanced Course for expert insights on price action trading!
Bottomline
Price action interpretation is highly subjective. As a result, when two traders analyze the same price movement, it’s common for them to come to different conclusions. A negative downtrend may be visible to one trader, but the price movement may indicate a probable near-term turnaround to another. Thus, one should remember the above 7 things before entering any position!
Frequently Asked Questions
Who is a famous price action trader?
In actuality, though, Richard Wyckoff is credited as one of the pioneers of price action trading and was the first to closely examine volume in relation to price movement. Richard Wyckoff was a well-known stock market personality in his day. He started the Magazine of Wall Street in 1907 and served as its editor.
What is price action with example?
To put it simply, price action is the movement of the price as it is shown on different kinds of charts. Bearish candlestick patterns include Hanging Man, Shooting Star, and Evening Star, whereas bullish candlestick patterns include Hammer, Inverse Hammer, and Piercing Line.
Visit StockEdge for more market insights.


Very usefull material for learning. Intencity of this material will incerase if material available in hindi.
Hi,
We really appreciated that you liked our blog! Thank you for your feedback!
Keep Reading!
Good Information. keep grow
Hi,
We really appreciated that you liked our blog! Thank you for your feedback!
Keep Reading!
Very useful material provided by Elearnmarkets , I appreciate your blog ,
It will aslo helps the individual are new in share market ….!
Hi,
We really appreciated that you liked our blog! Thank you for your feedback!
Keep Reading!
Very useful information to learning. Best for marketing.❤️
Hi,
We really appreciated that you liked our blog! Thank you for your feedback!
Keep Reading!
Thank you for writing this useful information
Hi,
We really appreciated that you liked our blog! Thank you for your feedback!
Keep Reading!
Great initiative for gaining knowledge more as compare to mainly from youtuber. Thanks a lot.
Hi,
We really appreciated that you liked our blog!
Thank you for Reading!
Keep Reading!