
Triple Top and Triple Bottom patterns are the types of reversal chart patterns. Triple Top is a bearish reversal chart pattern that leads to the trend change to the downside.
Whereas Triple Bottom is a bullish chart reversal pattern that leads to the trend change to the upside. They are extensions of the Double Top and Double Bottom chart patterns.
In today’s blog let us understand how to trade with a triple top and bottom pattern:
What is the Triple Top Pattern?
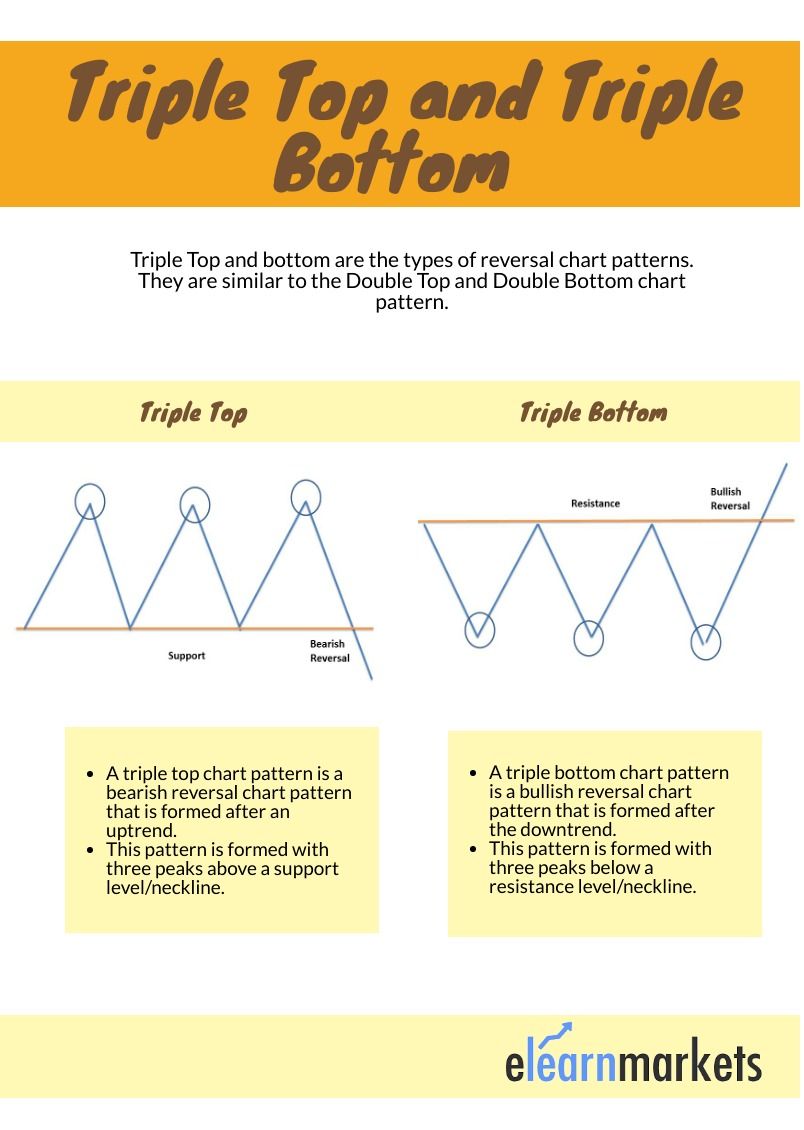
A triple-top chart pattern is a bearish reversal chart pattern that is formed after an uptrend. This pattern is formed with three peaks above a support level/neckline.
The first peak is formed after a strong uptrend and then retrace back to the neckline. The formation of this pattern is completed when the prices move back to the neckline after forming the third peak.
When the prices break through the neckline or the support level after forming three peaks then the bearish trend reversal is confirmed.
What is Triple Bottom Pattern?
A triple bottom chart pattern is a bullish reversal chart pattern that is formed after the downtrend.
This pattern is formed with three peaks below a resistance level/neckline. The first peak is formed after a strong downtrend and then retrace back to the neckline.
The formation of this pattern is completed when the prices move back to the neckline after forming the third peak. When the prices break through the neckline or the resistance level after forming three peaks then the bullish trend reversal is confirmed.
Formation of the Triple Top and Triple Bottom Pattern
Here is how Triple Top and Triple Bottom chart pattern is formed –
Trading with Triple Top
There are some rules when trading with Triple Top chart patterns.
- Firstly one should identify the market phase whether it is in an uptrend or downtrend. As the triple top is formed at the end of an uptrend, the prior trend should be an uptrend.
- Traders should spot if three rounding tops are forming.
- Traders should only enter the short position when the price breaks out from the support level or the neckline.
Stop Loss
In the case of a Triple Top chart pattern, the stop loss should be placed at the third top of the pattern.
Price Target
The price target should be equal to the distance between the neckline and the tops.
Trading with Triple Bottom
There are certain rules when trading with Triple Bottom chart patterns.
- Firstly one should see the market phase if it is up or down. As the triple bottom is formed at the end of the downtrend, the prior trend should be the downtrend.
- Traders should spot if three rounding bottoms are forming and also note the size of the bottoms.
- Traders should only enter the long position when the price breaks out from the resistance level or the neckline.
Example
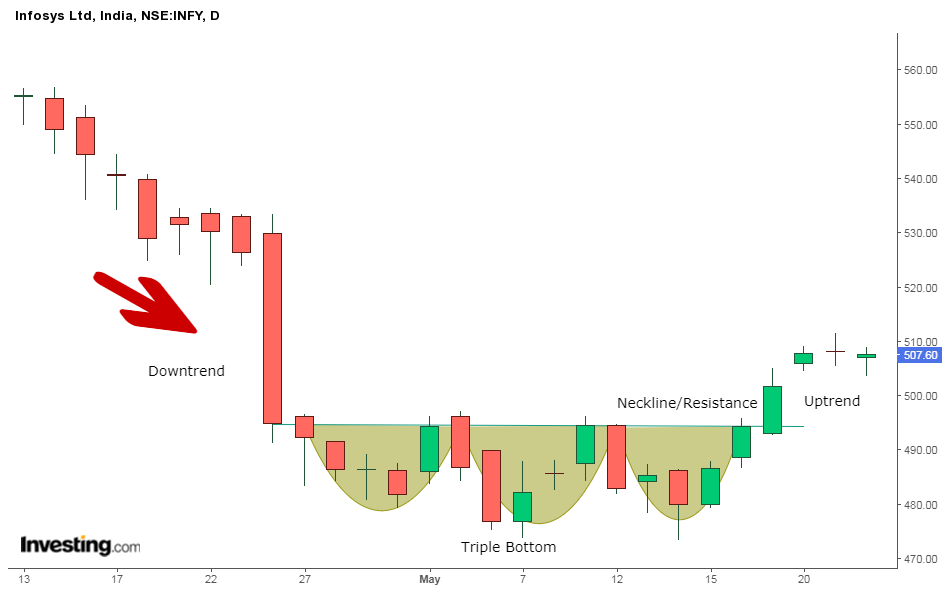
From the below example of the daily chart of Infosys Ltd. we can see how a bullish reversal takes place after the formation of the triple bottom pattern at the end of the downtrend:

Stop Loss
In the case of the Triple Bottom pattern, the stop loss should be placed at the third bottom of the pattern.
Price Target
The price target should be equal to the distance between the neckline and the bottoms.
How to filter Stocks using Triple Top and Bottom Screener?
There are so many stocks in which this chart pattern is formed and it is difficult for traders to look at the charts of more than 500 stocks for finding this pattern.
So, with the help of StockEdge, one can filter out stocks in which the triple top and bottom pattern are formed:
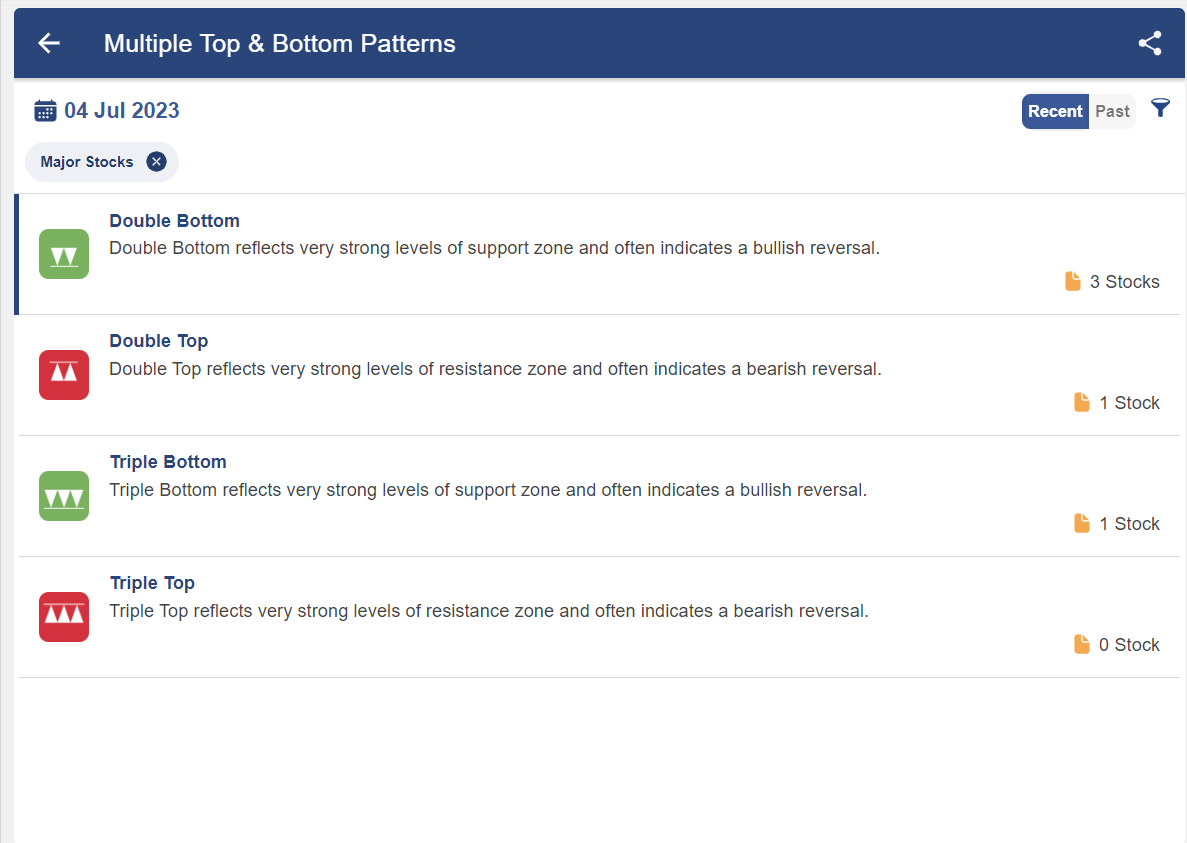
After clicking on the double top or double bottom, you will get a list of stocks in which this pattern is formed:

After clicking on any of the above stocks, you will get a technical chart showing the pattern as below:

Once you have identified this chart pattern in the stocks, you can trade accordingly as discussed above.
Bottomline
Triple Top and triple bottom patterns are the types of the reversal chart pattern. A triple top chart pattern is a bearish reversal chart pattern that is formed after an uptrend. A triple bottom pattern is a bullish reversal chart pattern that is formed after the downtrend. There are certain rules when trading with these patterns.
Frequently Asked Questions (FAQs)
What is triple top vs triple bottom pattern?
A triple bottom is made up of three troughs with rallies in the centre, whereas a triple top is made up of three peaks going into the same area with pullbacks in between. Triple tops and bottoms are an uncommon occurrence in regular market trading, but they give technical traders a strong indication for trend reversals.
Is a triple bottom bullish?
In technical analysis, a triple bottom is a bullish chart pattern that consists of three identical lows followed by a breakthrough above the resistance level.
What is a triple top?
Technical analysts utilise chart patterns like the triple top to forecast a change in the direction of an asset’s price movement. A triple top, which consists of three peaks, indicates that the asset might no longer be rallying and that lower prices might be coming.
What comes after triple top pattern?
Expect a bearish reversal once a triple top has formed with its three high points. When the price breaks below the low point of the triple top, the bearish reversal chart pattern is verified.


