Key Takeaways
- What a Shooting Star Indicates: A single-candle bearish reversal that appears after an uptrend, showing buyers pushed prices up but sellers forced them back down by the close.
- How the Pattern Looks: Small real body near the low, a long upper shadow at least twice the body, and little or no lower shadow—a clear sign of rejected highs.
- Market Psychology Behind It: It shows failed buying attempts and rising selling interest, suggesting upward momentum may be weakening.
- How Traders Use It: Wait for confirmation from the next candle (ideally a gap down and follow-through), place stop-loss above the shooting star’s high, and size positions cautiously.
- Best Conditions for Reliability: Most effective near resistance levels, in liquid stocks, and when confirmed by volume or other indicators like RSI or trendlines.
- Key Takeaways
- Anatomy of the Shooting Star Pattern
- The Psychology Behind the Formation
- Interpreting Market Signals
- Practical Trading Applications
- Distinguishing From Similar Patterns
- Critical Limitations and Risk Factors
- How to Use Shooting Star Candlestick Scans in StockEdge?
- Limitations of Shooting Star
- Bottomline
- Frequently Asked Questions (FAQs)
When traders observe a shooting star formation on their charts, it’s often a warning signal that an uptrend may be running out of steam. This distinctive candlestick pattern earned its name from its visual resemblance to a meteor streaking across the sky before fading away, much like how prices surge upward only to collapse back down within the same trading session.
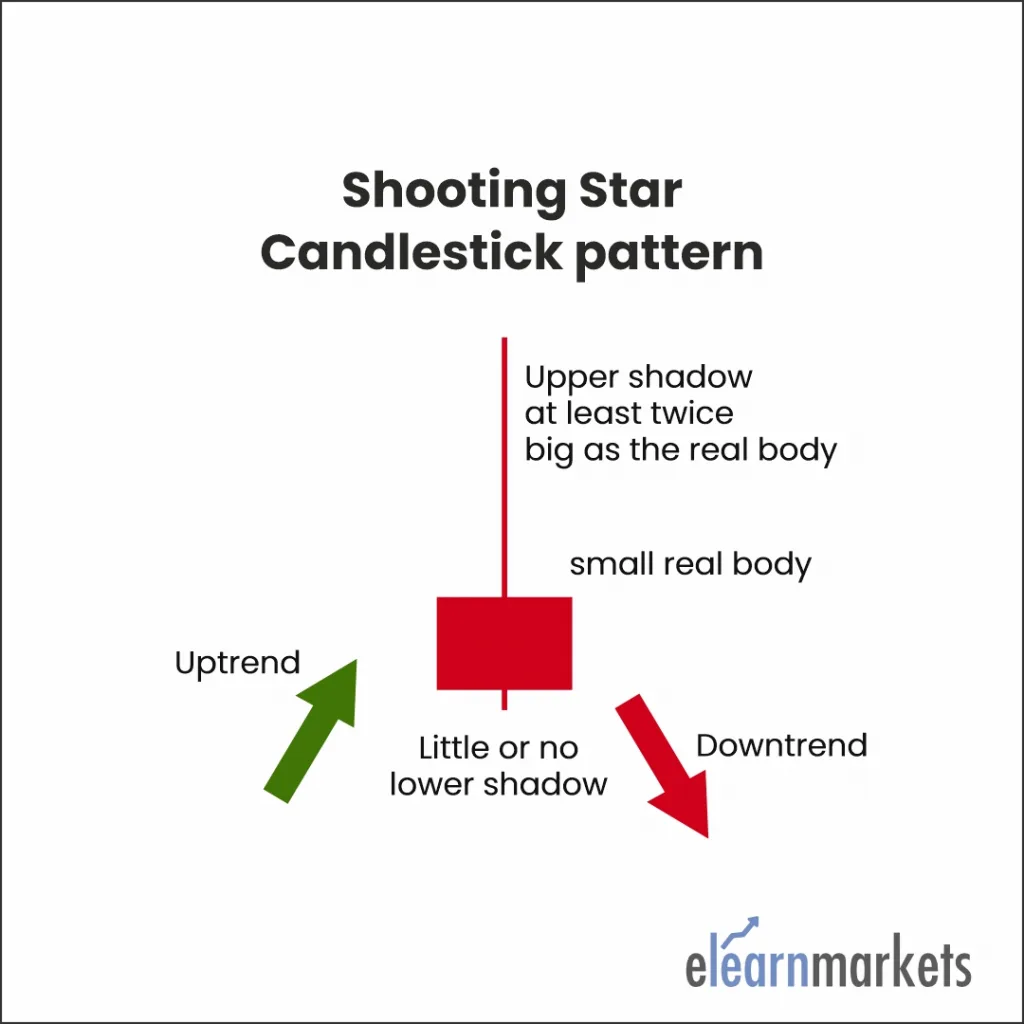
Anatomy of the Shooting Star Pattern
The shooting star presents a specific visual signature that experienced traders can quickly identify. The pattern features a small real body positioned near the lower end of the trading range, accompanied by an extended upper shadow that should be at least twice the length of the body itself. Ideally, there should be minimal or no lower shadow present.
This formation emerges after prices have been climbing, appearing at or near the peak of an upward trend. The pattern’s structure tells a compelling story about the battle between buyers and sellers during that particular trading session, revealing a critical shift in market sentiment that often precedes a downturn.
The Psychology Behind the Formation
Understanding what happens during the trading session helps explain why this pattern carries bearish implications. The session begins with opening prices relatively stable, maintaining the momentum from previous bullish days. As trading progresses, enthusiastic buyers push prices significantly higher, continuing the established upward trajectory that has characterized recent market behavior.
However, this bullish enthusiasm proves short-lived. As the session advances, sellers emerge with enough force to overwhelm the buyers, driving prices back down toward the opening level. By the closing bell, the price settles near where it started, despite the intraday rally to much higher levels.
This price action demonstrates that buyers attempted to extend the rally but couldn’t maintain control. The rejection at higher prices suggests that resistance has been encountered, and the market may lack the strength to push further upward. The long upper shadow becomes a visual representation of failed buying pressure and emerging selling interest.
Interpreting Market Signals
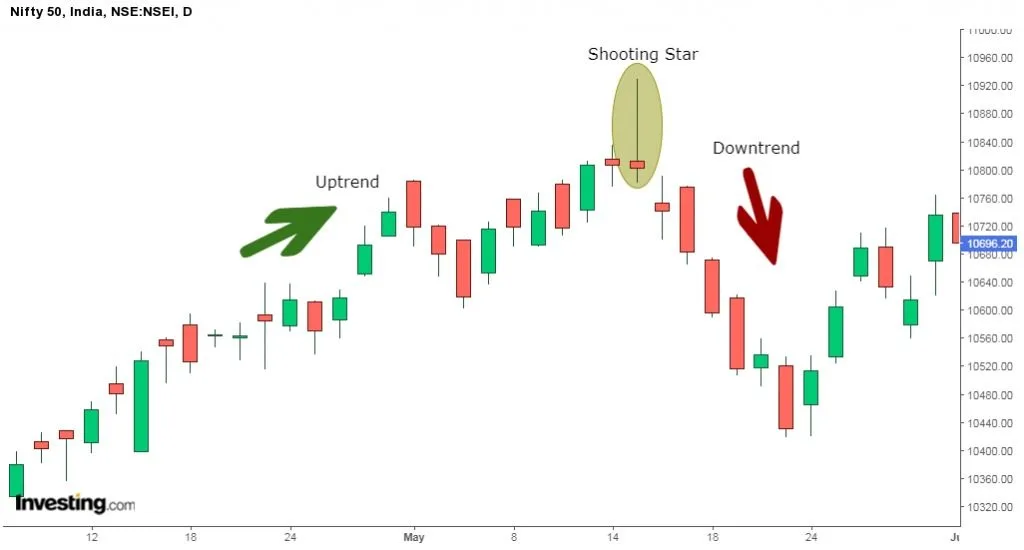
The shooting star becomes particularly meaningful when it appears after a sustained upward movement, especially following two or three consecutive rising candles that have established higher highs. This context is crucial; a shooting star appearing in isolation or during a downtrend doesn’t carry the same bearish significance.
The pattern indicates that although buyers initially maintained their dominance at the session’s start, mirroring the strength seen in recent trading days, they ultimately lost control. The price action reveals that selling pressure increased throughout the session, with sellers successfully defending higher price levels and pushing valuations back down.
The extended upper shadow serves as evidence of buyer weakness. It shows that while bulls attempted to drive prices higher, they couldn’t sustain those elevated levels. This failed breakout attempt often precedes a more substantial reversal, especially when confirmed by subsequent price action.
Practical Trading Applications
Traders who spot shooting star formations should follow specific guidelines to maximize effectiveness and minimize risk.
Entry timing requires patience and confirmation; never act on the shooting star candle alone. Wait for the following session to validate the bearish signal, ideally with a gap down at the open, followed by continued downward movement on increased volume.
Stop-loss placement is non-negotiable when trading this pattern. Position your protective stop just above the high of the shooting star’s upper shadow.
This level represents where your bearish thesis would be invalidated, as prices breaking above would suggest buyers have regained control rather than surrendering it.
Profit targets should be proportional to the pattern’s size. A conservative approach involves targeting a move equal to the distance from the shooting star’s high to its close.
More aggressive traders might hold positions longer, using trailing stops to capture extended downward moves while protecting accumulated gains.
Position sizing deserves careful consideration. Since candlestick patterns provide probability-based signals rather than certainties, risk only a small percentage of your capital on any single setup. Even textbook shooting stars can fail, particularly when fundamental catalysts or broader market forces override technical signals.
Distinguishing From Similar Patterns
The shooting star shares visual similarities with the inverted hammer pattern, which often causes confusion among newer traders. Both feature small real bodies with long upper shadows and minimal lower shadows. The critical difference lies in context and interpretation.
An inverted hammer appears after a downtrend and carries bullish implications, suggesting that sellers are losing control and buyers may be gaining strength. The shooting star, conversely, emerges after an uptrend and warns of potential reversal to the downside. Context determines meaning; the same physical structure conveys opposite messages depending on what preceded it.
The evening star pattern also warrants comparison. Both represent bearish reversals following uptrends, but the evening star comprises three candles rather than one. The shooting star condenses the reversal signal into a single session, while the evening star spreads the narrative across multiple trading days, potentially providing more reliability but less immediate timing precision.
Critical Limitations and Risk Factors
Candlestick patterns like the shooting star should never constitute your entire decision-making framework. They function best as components within a comprehensive analytical approach that incorporates multiple confirming factors.
Confirmation through subsequent price action is essential. The candle immediately following the shooting star should ideally gap lower and continue declining on substantial volume, validating the bearish signal. Without this confirmation, the pattern’s reliability diminishes significantly.
Additional technical tools strengthen shooting star signals. Look for confluence with resistance levels identified through trendlines, moving averages, or prior price action. Volume analysis adds another dimension; shooting stars accompanied by unusually high volume carry more conviction than those appearing on light trading.
Isolated patterns appearing in the middle of charts, far from significant support or resistance zones, typically prove less reliable than those forming at critical technical junctures. The most powerful shooting stars emerge near established resistance areas where sellers have historically defended higher prices.
Market conditions matter tremendously. During strong trending markets driven by fundamental catalysts or institutional flows, technical patterns frequently fail as momentum overrides normal trading behavior. Conversely, in range-bound markets where technical levels command greater respect, shooting stars tend to perform more reliably.
Remember that no pattern guarantees outcomes. Even perfectly formed shooting stars can fail, particularly when unexpected news, earnings surprises, or macroeconomic events shift market sentiment. This reality underscores the importance of disciplined risk management regardless of how compelling any setup appears.

How to Use Shooting Star Candlestick Scans in StockEdge?
Steps to use Shooting Star Candlestick scans in StockEdge:
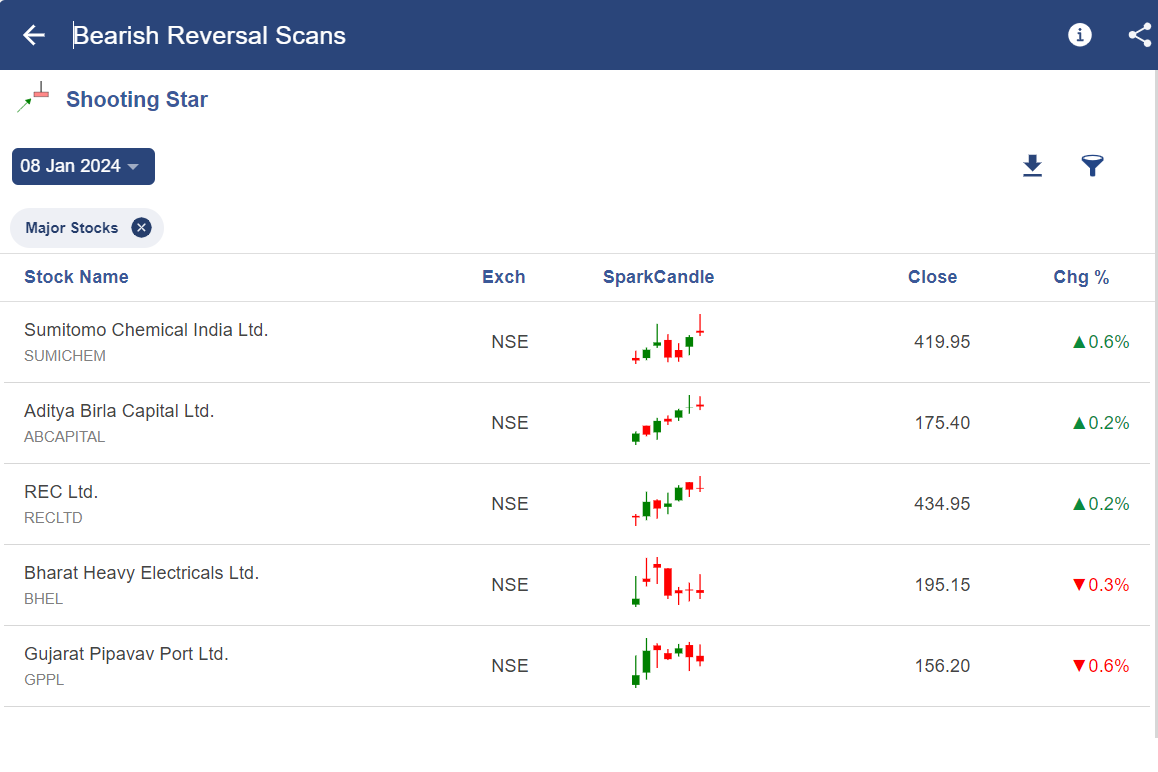
- Under the “Candlestick Scans” we can see Bearish Reversal scans as shown below:
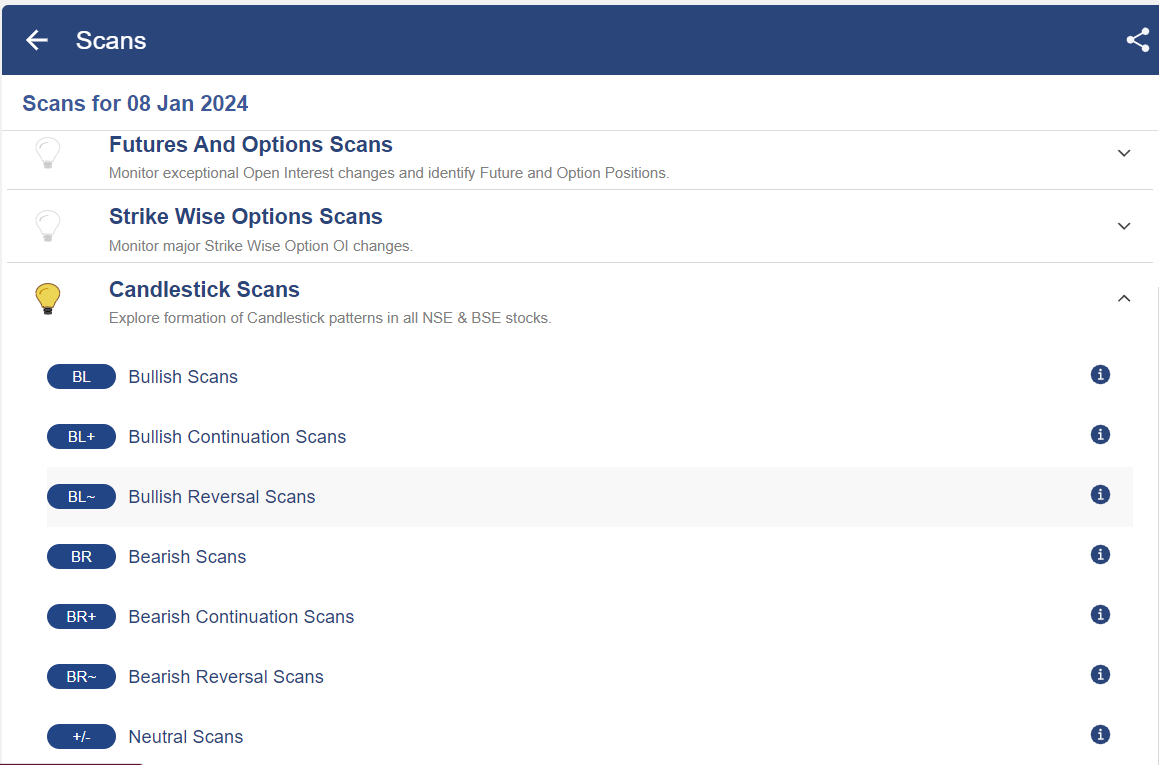
- When we click on the “Bearish Reversal scans” we can see the “Shooting Star” scan, click on that:

- After selecting on it, you will get a list of stocks in which “Shooting Star” pattern is formed as shown below:
Limitations of Shooting Star
One should not only rely on a candle pattern like in a shooting star for making trading decisions.
This is why confirmation is required, one can confirm by the next day candle or other technical analysis indicators.
One should also use stop losses when using candlesticks to control the losses.
A candlestick pattern is more significant when it occurs near an important level, signalled by other forms of technical analysis.
Read More- All 35 Candlestick Chart Patterns in the Stock Market
Bottomline
A shooting star is a type of candlestick pattern that forms when the price of the security opens, rises significantly but then closes near the open price. A shooting star is a bearish candlestick pattern having a long upper shadow and no lower shadow at all. There is a difference between a shooting star and an inverted hammer. One should not only rely on a candle pattern like in a shooting star for making trading decisions.
Frequently Asked Questions (FAQs)
1. How reliable is the shooting star as a reversal indicator?
The shooting star’s reliability improves significantly with proper confirmation and context. When appearing after a sustained uptrend, near resistance levels, with high volume, and followed by bearish confirmation candles, the pattern becomes more trustworthy. However, isolated shooting stars without confirmation or context should be treated cautiously. Studies suggest confirmation requirements and risk management are essential, as no single candlestick pattern guarantees reversal.
2. What’s the key difference between a shooting star and an inverted hammer?
While both patterns look visually similar with small bodies and long upper shadows, their context and meaning differ completely. A shooting star appears after an uptrend and signals bearish reversal, indicating failed buying attempts. An inverted hammer forms after a downtrend and suggests potential bullish reversal, showing that sellers are losing control. The pattern’s location within the trend determines its interpretation.
3. Where should I place my stop-loss when trading a shooting star?
Position your stop-loss just above the high of the shooting star’s upper shadow, typically adding a small buffer for price noise. This level represents where your bearish thesis would be invalidated if prices break above the shooting star’s high; it suggests buyers have regained control, and the reversal signal has failed. Always use stops to protect against unexpected market moves.
4. Can shooting stars appear on any timeframe?
Yes, shooting star patterns form on all timeframes from intraday charts to monthly candles. The principles remain consistent across timeframes, though longer-period shooting stars generally carry more significance due to the greater volume of trading activity they represent. Day traders use them on 5-minute or hourly charts, while swing traders and investors monitor daily and weekly formations.
5. What other technical indicators should I combine with shooting star patterns?
Effective confirmation tools include RSI or stochastic oscillators showing overbought conditions, MACD bearish crossovers, volume spikes on the shooting star candle, proximity to horizontal resistance or trendline resistance, and bearish divergence between price and momentum indicators. The more confirming factors present, the higher probability the reversal signal will prove accurate.
6. Can a shooting star appear at the bottom of a downtrend?
If a shooting star-shaped candle appears after a downtrend, it’s technically not a shooting star but rather a different pattern entirely. Shooting stars by definition signal bearish reversals after uptrends. A similar-looking candle at a downtrend bottom might be an inverted hammer (bullish) or simply lack clear directional significance. Context determines pattern identification and meaning.


