Elearnmarkets - Financial Market Learning
  • Courses
  • Webinars
  • Stories
  • Language
    • English
    • Hindi
    • Bengali
No Result
View All Result
Get Free Course
  • Basic Finance
  • Derivatives
    • Futures
    • Options
  • Financial Planning
  • Fundamental Analysis
  • Technical Analysis
  • Mutual Funds
  • Marketshala
  • Miscellaneous
Elearnmarkets - Learn Stock Market, trading, investing for Free
  • Courses
  • Webinars
  • Stories
  • Language
    • English
    • Hindi
    • Bengali
No Result
View All Result
Get Free Course
Elearnmarkets - Learn Stock Market, trading, investing for Free
No Result
View All Result
Home Technical Analysis
Profit Opportunities with the KST Indicator in Stocks: A Comprehensive Guide 1

Profit Opportunities with the KST Indicator in Stocks: A Comprehensive Guide

Vivek Bajaj by Vivek Bajaj
November 14, 2024
in Technical Analysis
Reading Time: 8 mins read
0
1.5k
VIEWS
Share on FacebookShare on XShare on WhatsApp

Martin Pring created the Know Sure Thing (KST indicator), a momentum oscillator that analyses the market’s pace of change over four distinct timeframes in order to forecast price movements.

The KST is a flexible tool that traders may use to help them spot market trends, time momentum shifts for when to enter and exit, and spot divergences that could be signs of impending reversals.

Because of its capacity to function over several timeframes, it offers a thorough picture of momentum, making it an invaluable tool for traders.

Nevertheless, the KST has drawbacks, including the ability to provide misleading signals, and its intricacy could be difficult for inexperienced traders to understand.

To improve trading decision-making, the KST should also be utilised in conjunction with other tools and analysis techniques, much like any technical indicators.

In today’s blog, let us discuss what this indicator is all about and how to trade with KST indicator:

Table Of Contents
  1. What is the KST Indicator? 
  2. Calculation
  3. Interpretation of KST Indicator
  4. Trading with KST Indicator 
    • 1. Momentum Trading
    • 2. Trend Identification 
    • 3. Divergence 
  5. Benefits
  6. Risks
  7. Bottomline
  8. Frequently Asked Questions 
    • What is the KST indicator?
    • How do you use the KST indicator?
    • What is the difference between MACD and KST?
    • What is the KST indicator in intraday?

What is the KST Indicator? 

Martin Pring created the Know Sure Thing (KST), a momentum oscillator, to help traders better understand rate-of-change data.

Four distinct Rate of Change (ROC) indicators, each applied to a distinct era, make up the KST. The KST value is then created by combining these ROCs after they have been smoothed using a Simple Moving Average (SMA).

kst indicator

Calculation

The KST must be calculated in multiple phases. ROC values are first computed over four distinct time periods. After that, a SMA is used to smooth these ROCs.

A weighting factor is applied to the smoothed ROCs obtained, emphasising the longer durations. The KST value is the total of these weighted ROCs. 

Lastly, the signal line is computed using the KST value’s 9-period SMA.

Interpretation of KST Indicator

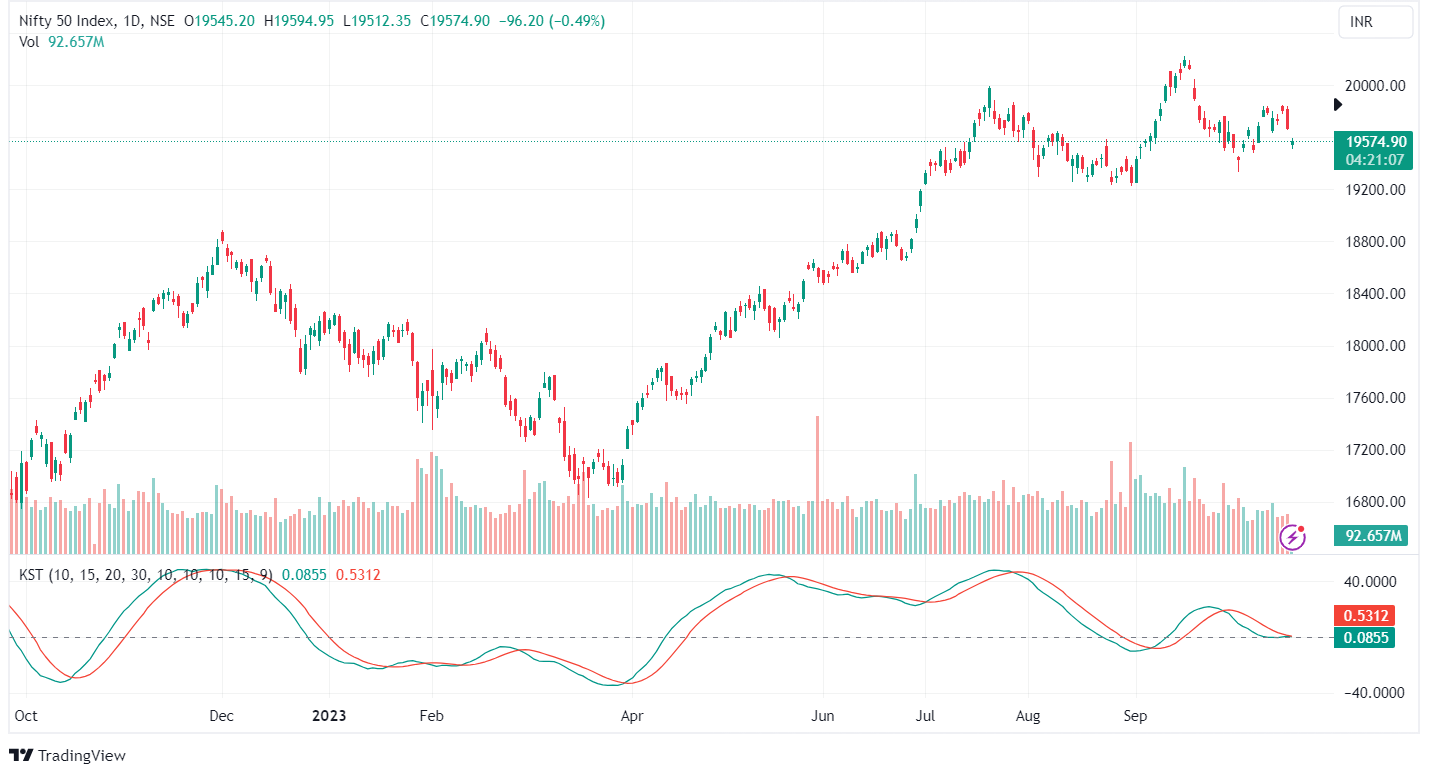
Similar to many other momentum oscillators, including the widely recognised relative strength index (RSI), the KST indicator can be utilised in similar ways. 

In addition to convergence and divergence with the price, overbought or oversold conditions, and crossovers of the centre line, traders may also watch for trading indications when the KST crosses over the signal line.

To increase their chances of success, many traders combine the KST indicator with additional techniques from technical analysis. To aid in their decision-making, traders can, for instance, examine other non-momentum indicators, chart patterns, or candlestick patterns.

Bullish momentum is indicated by a positive KST number, whilst bearish momentum is suggested by a negative value. When the KST crosses the zero line, traders frequently search for “crossings” since these can indicate possible buy or sell opportunities.

Profit Opportunities with the KST Indicator in Stocks: A Comprehensive Guide 2
Get success in your trading with our ROC Stock Indicator Course

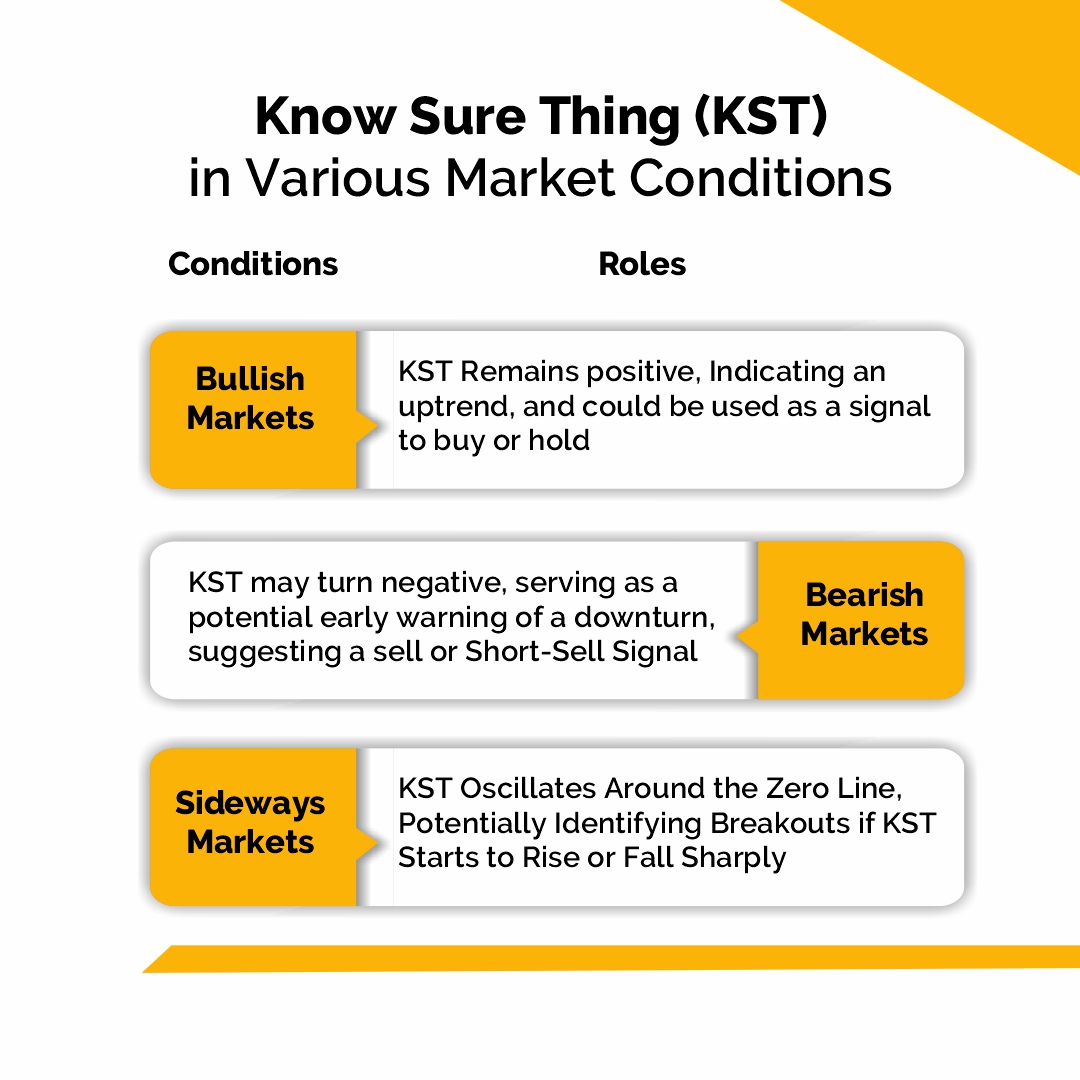
The KST is likely to stay positive in optimistic markets and frequently rises before the price does. This can serve as a hint for traders to buy or hold onto their position.

The KST may enter negative territory in bearish markets, which could serve as an early warning indicator of a market decline. This can be a clue for traders to short-sell or sell the asset altogether.

The KST may oscillate around the zero line in sideways markets. It can be used by traders to identify potential breakouts if the KST begins to rise or fall sharply.

Trading with KST Indicator 

The KST Indicator can be used in the following ways when trading:

1. Momentum Trading

The KST can be used by momentum traders to determine possible entry and exit positions. Upon rising over the zero line, the KST may indicate a chance to buy. It can indicate that it’s time to sell when it drops below the zero line.

2. Trend Identification 

An asset’s underlying trend can be discovered using the KST. An upward trend is shown when the KST is positive and rising. On the other hand, a declining KST in negative territory may point to a downward tendency.

3. Divergence 

Price and KST divergences have the ability to predict future reversals. The KST making a lower high while the price reaches a higher high could indicate an impending decline, a bearish divergence.

On the other hand, a bullish divergence—where the price hits a lower low while the KST hits a higher low—might suggest an approaching upswing.

Benefits

The KST has a number of advantages, such as early signal production and adaptability. Compared to many other indicators, it offers a more thorough perspective of market momentum because it incorporates many timeframes.

Additionally, it can offer early entry and exit signals by seeing changes in momentum prior to price changes.

Risks

The KST has some drawbacks despite its benefits. It is not perfect and might give false signals, just like any other technical indicator. Furthermore, it can be difficult for inexperienced traders to use it efficiently due to its complexity.

Bottomline

Martin Pring created the Know Sure Thing (KST), a momentum oscillator that can detect changes in market momentum over a variety of time periods.

KST is used in trading under a variety of market circumstances, helping with trend recognition, momentum trading, and divergence detection. It gives traders important information that affects their decisions to purchase, sell, or hold.

KST has benefits and drawbacks, just like any other technical indicator. Because it provides a more comprehensive perspective of market momentum than many momentum indicators, its multi-timeframe methodology gives it an advantage.

Learn profitable investing through our webinar on Profitable Investing Through the Indicator System!

Frequently Asked Questions 

What is the KST indicator?

A momentum oscillator called the Know Sure Thing (KST) is used to analyse rate-of-change pricing data. In addition to looking for overbought or oversold conditions, traders also generate trading signals when the KST crosses over the signal line.

How do you use the KST indicator?

It is not advisable to utilise the KST indicator in a range market as it is mainly intended for trading trends. Signals are generated when the nine-month simple moving average of KST passes its signal line.

What is the difference between MACD and KST?

The KST is obtained from four ROC indicators, whereas the MACD is based on the relationship between two exponential moving averages. Therefore, compared to the MACD, the KST might be more responsive to changes in momentum.

What is the KST indicator in intraday?

The zero line is where the KST varies. An indicator that is bullish is the KST above the line. It demonstrates that prices are in a strong upswing and that the weighted smoothed ROC trends are positive. A bearish trend is indicated by a KST rating less than zero.

Tags: kst indicatorstock markettechnical analysis
ShareTweetSend
Get Kotak Offer Get Kotak Offer Get Kotak Offer
Previous Post

Best 5 Trading Strategies with the Bollinger Bands

Next Post

Price Action Trading- 7 Things to Consider Before Placing a Trade

Vivek Bajaj

Vivek Bajaj

Mr. Vivek Bajaj has over 18 years of trading experience in equities, options, currencies, and commodity markets. He is the co-founder of Stockedge and Elearnmarkets and is passionate about data, analytics, and technology. He serves on various exchange committees and has played a significant role in the evolution of India's derivative market. He has been a speaker at various colleges and higher institutions, including IIT and IIMs.

Related Posts

Understand Slippage in Trading
Technical Analysis

What is Slippage in Trading? Meaning & Examples

March 28, 2025
323
Breakout trading strategies
Technical Analysis

Top 5 Breakout Trading Strategies

March 12, 2025
1.2k
5 stocks for today
Technical Analysis

5 Stocks to Buy Today That Could Beat the NIFTY in 2025!

May 5, 2025
419
Image describing What is marginal trading facility
Technical Analysis

 What is a Margin Trading Facility? Advantages & Risks

April 4, 2025
679

Leave a Reply Cancel reply

Your email address will not be published. Required fields are marked *

Disclaimer

Elearnmarkets (Kredent InfoEdge Pvt. Ltd.) is a SEBI-registered Research Analyst (RA) entity (SEBI Registration No.: INH300007493). The information provided in this article is for educational and informational purposes only and should not be considered as an offer to buy or sell any securities or investment products.

The stocks, securities, and investment instruments mentioned herein are not recommendations under SEBI (Research Analysts) Regulations, 2014. Readers are advised to conduct their own due diligence and seek independent financial advice before making any investment decisions.

Investments in securities markets are subject to market risks. Please read all related documents carefully before investing. Investing in Equity Shares,
Derivatives, Mutual Funds, or other instruments carry inherent risks, including potential loss of capital. Elearnmarkets (Kredent InfoEdge Pvt. Ltd.) does not provide any guarantee or assurance of returns on any investments. Past performance is not indicative of future performance.

Elearnmarkets Logo

Follow Us

Facebook-f X-twitter Instagram Linkedin-in Youtube Telegram

Register on Elearnmarkets

Continue your financial learning by creating your own account on Elearnmarkets.com

Register Free Account

Download App

Playstore logo
Download on app store

Categories

  • Basic Finance
  • Derivatives
  • Financial Planning
  • Fundamental Analysis
  • Technical Analysis
  • Mutual Funds
  • Miscellaneous

Popular On Elearnmarkets

  • Market Superheroes:
  • Vivek Bajaj
  • Chetan Panchamia
  • Ashish Kyal
  • Premal Parekh
  • Abhijit Paul
  • Jegan
  • Sivakumar Jayachadran
  • Jyoti Budhia
  • Vivek Gadodia
  • Vishal Mehta
  • Piyush Chaudhry
  • Santosh Pasi
  • Gomathi Shankar
  • Market Superheroes:
  • Vivek Bajaj
  • Chetan Panchamia
  • Ashish Kyal
  • Premal Parekh
  • Abhijit Paul
  • Jegan
  • Sivakumar Jayachadran
  • Jyoti Budhia
  • Vivek Gadodia
  • Vishal Mehta
  • Piyush Chaudhry
  • Santosh Pasi
  • Gomathi Shankar
  • Courses:​
  • Options Trading
  • Dow Theory
  • Momentum Trading
  • Stock Investing
  • Harmonic Chart Patterns
  • Algo Trading
  • Elliot Wave Theory
  • Advanced Excel
  • Cryptocurrency
  • NSE Certification Course
  • Courses:​
  • Options Trading
  • Dow Theory
  • Momentum Trading
  • Stock Investing
  • Harmonic Chart Patterns
  • Algo Trading
  • Elliot Wave Theory
  • Advanced Excel
  • Cryptocurrency
  • NSE Certification Course
  • Webinars:
  • Bank Nifty Scalping
  • Intraday Trading Strategies
  • Options Trading Strategies
  • Options selling
  • Price Action
  • Relative Strength
  • Tax Planning
  • Options Buying
  • Growth Stocks
  • Portfolio Management
  • Risk Management
  • Renko Charts
  • Crude Oil
  • Traders Psychology
  • Moving Average
  • Multibagger Stocks
  • Free Learning Modules:
  • Intraday Trading
  • Options Scalping
  • Swing Trading
  • Financial Modelling
  • RSI Indicator
  • Bollinger Bands
  • Pricing of Futures
  • Personal Finance
  • Initial Public Offerings (IPO)
  • Value Investing
  • Technical Indicators
  • Candlesticks
  • Chart Patterns
  • Option Greeks
  • ELSS Funds
  • Banking and Insurance
  • Real Estate
  • Gold
  • Book Summaries:
  • Rich Dad Poor Dad
  • Psychology of Money
  • The Intelligent Investor
  • The Richest Man in Babylon
  • Think and Trade Like a Champion
  • Value Investing and Behavioural Finance
  • Trading in the Zone
  • Learn to Earn
  • Book Summaries:
  • Rich Dad Poor Dad
  • Psychology of Money
  • The Intelligent Investor
  • The Richest Man in Babylon
  • Think and Trade Like a Champion
  • Value Investing and Behavioural Finance
  • Trading in the Zone
  • Learn to Earn
  • Tools:
  • CAGR Calculator
  • SIP Calculator
  • eLearnOptions
  • Future Value Calculator
  • Present Value Calculator
  • Atal Pension Yojana
  • Cost of Delay Calculator
  • Become a Crorepati
  • Tools:
  • CAGR Calculator
  • SIP Calculator
  • eLearnOptions
  • Future Value Calculator
  • Present Value Calculator
  • Atal Pension Yojana
  • Cost of Delay Calculator
  • Become a Crorepati

© 2025 Elearnmarkets. All Rights Reserved

  • Visit Elearnmarkets
  • Courses
  • Webinars
  • Financial Guides
  • Get Free Counselling
  • Visit Elearnmarkets
  • Courses
  • Webinars
  • Financial Guides
  • Get Free Counselling

Download Our App

No Result
View All Result
  • Article Categories
    • Basic Finance
    • Derivatives
    • Financial Planning
    • Fundamental Analysis
    • Technical Analysis
    • ETFs & Mutual Funds
    • Marketshala
    • Miscellaneous
  • Language
    • Hindi
    • Bengali
    • English
  • Courses
  • Webinars
  • Stories
Get Free Course

© 2024 Elearnmarkets All Rights Reserved

A Handbook of Technical Analysis
To start your trading journey as a seasoned technical analyst
Download Guide For FREE
Trading Mentorship Program