Elearnmarkets - Financial Market Learning
  • Courses
  • Webinars
  • Stories
  • Language
    • English
    • Hindi
    • Bengali
No Result
View All Result
Get Free Course
  • Basic Finance
  • Derivatives
    • Futures
    • Options
  • Financial Planning
  • Fundamental Analysis
  • Technical Analysis
  • Mutual Funds
  • Marketshala
  • Miscellaneous
Elearnmarkets - Learn Stock Market, trading, investing for Free
  • Courses
  • Webinars
  • Stories
  • Language
    • English
    • Hindi
    • Bengali
No Result
View All Result
Get Free Course
Elearnmarkets - Learn Stock Market, trading, investing for Free
No Result
View All Result
Home Technical Analysis
The Ultimate guide to Trading Divergences 1

The Ultimate guide to Trading Divergences

Vivek Bajaj by Vivek Bajaj
February 29, 2024
in Technical Analysis
Reading Time: 7 mins read
0
3.5k
VIEWS
Share on FacebookShare on XShare on WhatsApp

Since trends are made up of numerous price swings, momentum is crucial in determining the strength of a trend. As a result, it’s crucial to recognise when a trend is slowing down and making trading divergences.

Although a decline in momentum does not always indicate a trend reversal, it does indicate that something is shifting, and the trend may consolidate or reverse.

The magnitude and direction of the price are referred to as price momentum. Trading professionals can better understand price momentum by comparing price swings.

Divergence trading can sometimes be intimidating for beginners. Not only do you need to understand the main categories, but they do not always indicate the expected result.

Making a trading decision based solely on divergences is never a wise one. Although strong, these patterns should only be used as a confirmation tool. What, however, are divergences?

Here, we’ll examine how to assess price momentum and demonstrate what trading this pattern in momentum can reveal about a trend’s direction.

Table Of Contents
  1. What are Trading Divergences?
  2. Types
    • 1. Bullish
    • 2. Bearish
  3. Hidden
    • 3. Bullish Hidden
    • 4. Bearish Hidden
  4. How to Trade with Divergences?
  5. Trading Example with RSI Stochastics
  6. Bottomline
  7. Frequently Asked Questions (FAQs)
    • What is trade divergence?
    • What is an example of divergence in trading?

What are Trading Divergences?

Simply put, divergences occur when a price moves in one direction while another indicator—typically an oscillating indicator—moves in a different direction.

In essence, you have a divergence if you observe the price rising and setting new higher highs while the oscillator is setting new lower lows. Here are some illustrations of the four most common types:

Types

Below are different types of trading divergences:
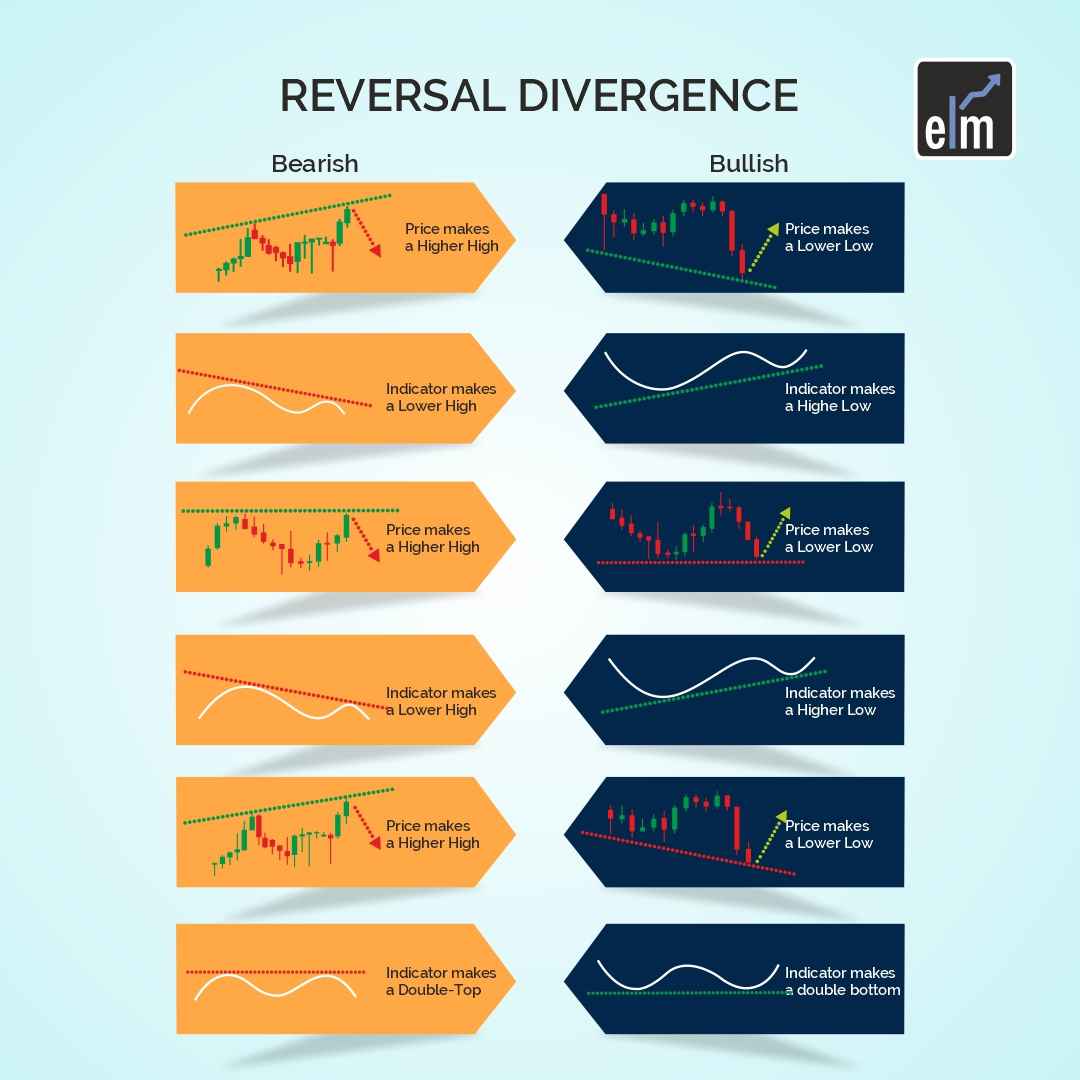
The Ultimate guide to Trading Divergences 2

1. Bullish

A bullish divergence is the first thing we will notice. For this example, the oscillator will be the Relative Strength Index.

The Ultimate guide to Trading Divergences 3

You’ll notice that there are recurring, similar patterns that are associated with divergences when you trade with them. Near the end of a downtrend is where you’ll typically find this in a typical bullish one.

According to this theory, there is a good chance that the price will reverse. Observe how the RSI has made higher lows while prices have made lower lows. Price behaved in the opposite way, testing a swing high and then the previous swing low before continuing to rise, which resulted in another, more pronounced regular bullish divergence.

2. Bearish

Let’s now look at a typical bearish divergence.

In essence, a trade with divergences that are bearish will indicate movement to the downside. Similar to how we see it from a regular bullish pattern near the end of a downtrend, we see it from a regular bearish pattern at the end of an uptrend.

The Ultimate guide to Trading Divergences 4

The price has made a higher high (on this chart, it made a significant leap), but on the RSI oscillator, we have lower highs, which is the divergence that we observe. According to the theory, there is a good chance that the price will reverse to the downside.

As can be seen, trade with this pattern on the bearish bias led to a decline in prices and the beginning of a downward trend.

Hidden

The following are examples of hidden divergences.

These patterns merely indicate a divergence within a trend. These are signs that the trend will continue, whereas regular divergences indicate a reversal of trending price action in a trade.

3. Bullish Hidden

Take note of how we are in an uptrend in this instance of a hidden bullish pattern. In addition, we keep making higher lows while the RSI oscillator keeps making lower lows.

There is a high likelihood that the price will stay in the uptrend in a trade with hidden bullish divergence signals. Keep an eye out for the higher low that was formed at the arrow’s point because price action with candlestick patterns can confirm the continuation of the trend.

The bottom of this pattern looks like a tweezer. And as we can see, the price did rise further.

4. Bearish Hidden

Usually, the RSI oscillator has made higher highs while prices have continued to decline and have formed lower highs. This phenomenon is referred to as a hidden bearish divergence.

According to the theory, there is a good chance that the downward trend will continue. Once more, a hidden bearish pattern indicates that the downward trend is still in place.

We created this head and shoulders pattern solely to demonstrate how Price responded to the emergence of this well-known pattern and how the lower high failed to push past the right shoulder. That served as yet another confirmatory indicator of trend persistence.

How to Trade with Divergences?

We used the RSI oscillator in the aforementioned four examples. It is most likely the most typical oscillator type used to find these patterns. However, there are many oscillators, and each has advantages over the others: Stochastics, RSI, Chaikin Money Flow, Awesome Oscillator, Ultimate Oscillator, etc.

There are simply a lot of oscillators available for use. The RSI and Stochastics oscillators are the most widely used oscillators.

Dive into short-term momentum strategies with our course inspired by ‘The Ultimate Guide to Trading Divergences.’ Unlock trading success now!

Trading Example with RSI Stochastics

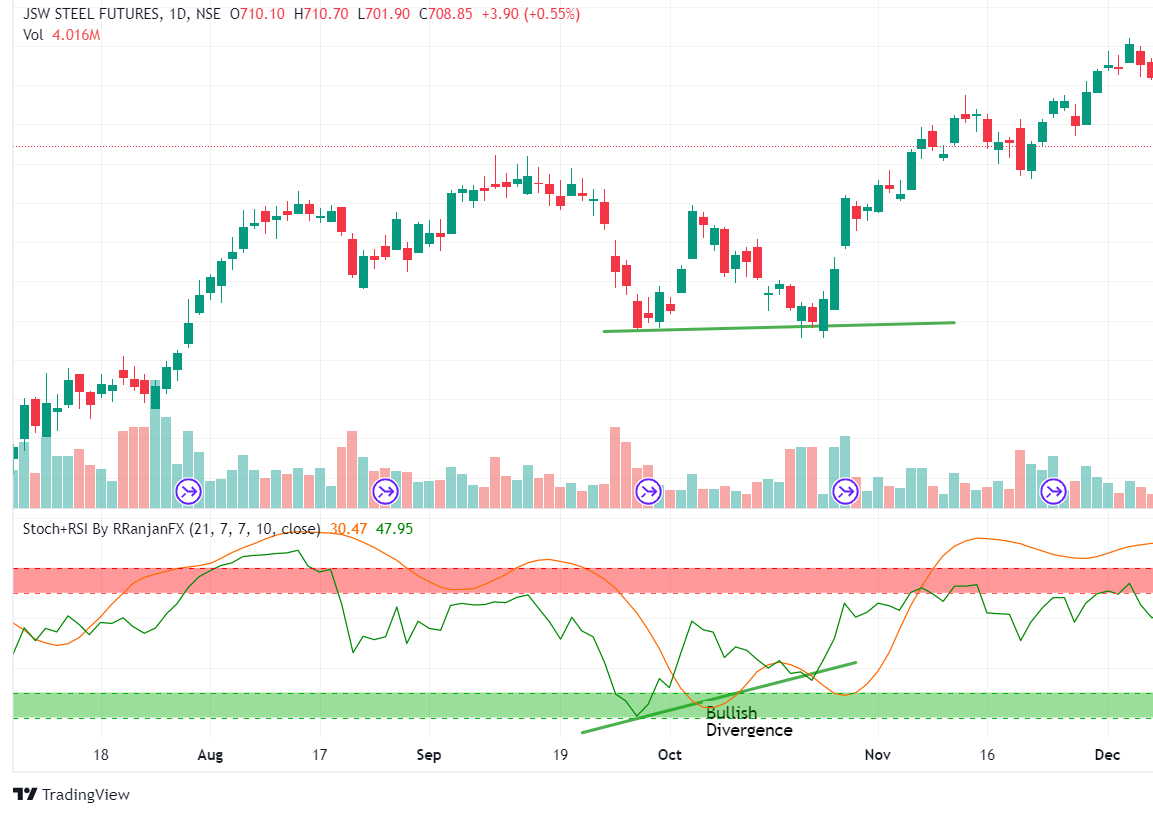
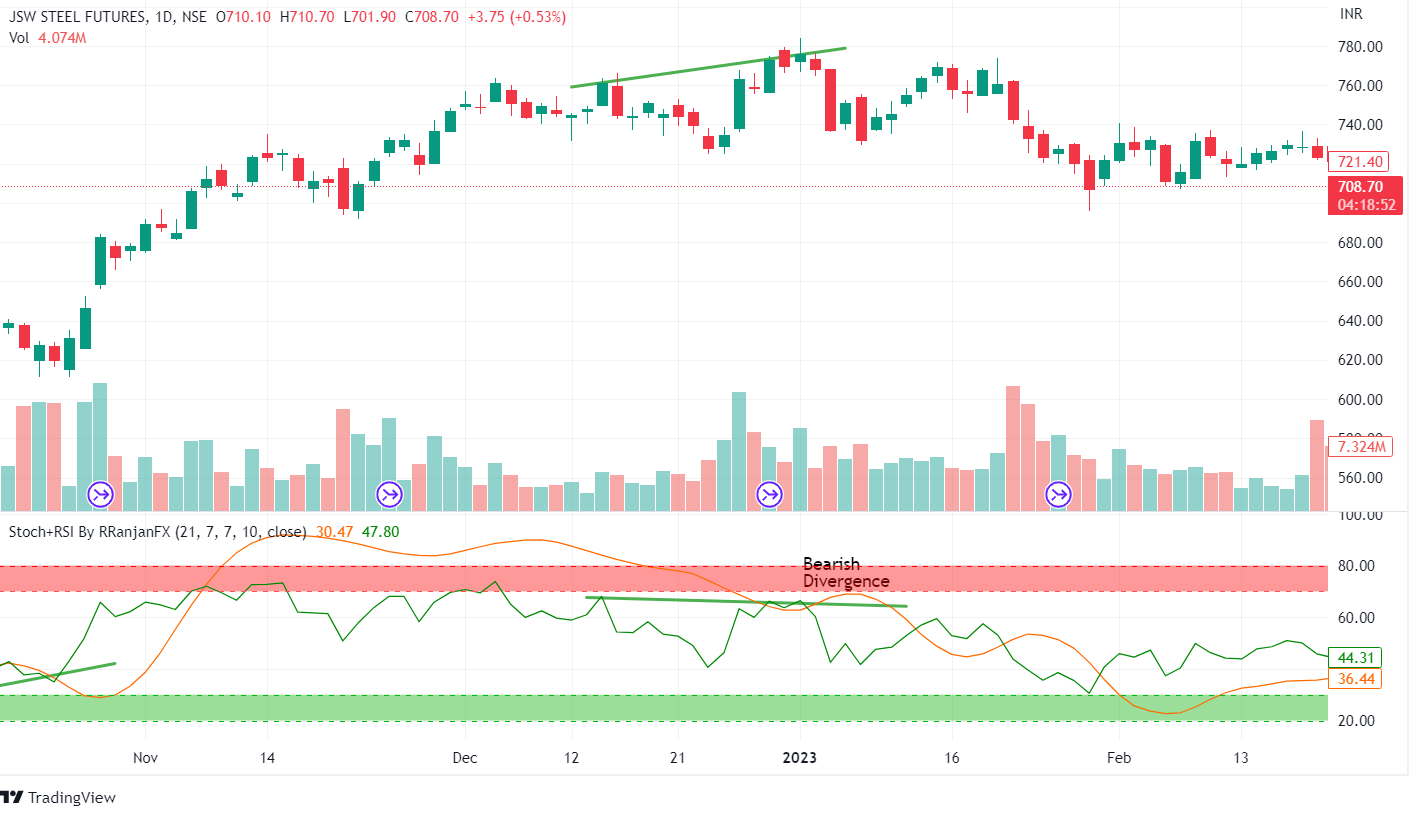
The Stochastic RSI is basically an indicator of an indicator. Where Stochastics measure the momentum of price and RSI measures the strength of the price movement, Stochastic RSI measures the momentum of the RSI.

trading divergences

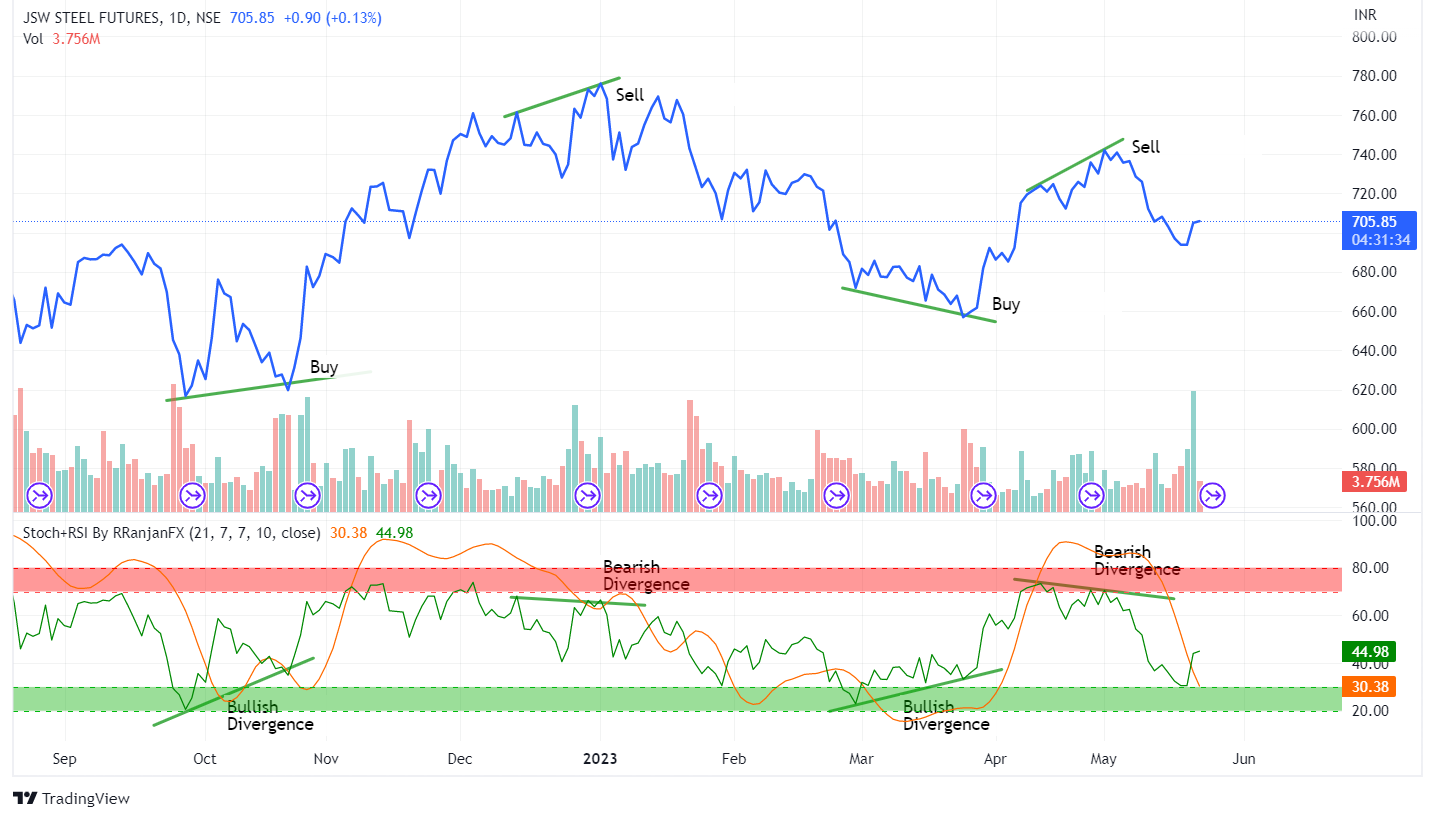
This is what is known as a typical bearish divergence. With the stochastic RSI, you would have seen that much more clearly than you would have with the RSI or stochastics.

As we can see from the above daily chart of JSW Steel, one can easily trade by analyzing bullish and bearish patterns.

Bottomline

Investors should confirm a trend reversal using a variety of indicators and analysis methods before acting solely on divergence, as is the case with all forms of technical analysis. These must be utilised in conjunction with another method of risk control or analysis because they won’t always be present during price reversals.

Frequently Asked Questions (FAQs)

What is trade divergence?

Divergence occurs when an asset’s price moves against other data or in the opposite direction of a technical indicator, like an oscillator. This signals a possible weakening of the existing price trend and, in certain situations, the possibility of a price change in that direction.

What is an example of divergence in trading?

The simplest definition of divergence is when the price of the currency pair you are tracking deviates from the charts’ technical indicators. For instance, the indicator is reaching a lower high while the price on the chart you are viewing has just reached a new higher high.

Tags: basicDivergenceenglishtechnical analysis
ShareTweetSend
Get Kotak Offer Get Kotak Offer Get Kotak Offer
Previous Post

Bonus Shares: Everything You Need to Know

Next Post

Trading with Money Flow Index (MFI)

Vivek Bajaj

Vivek Bajaj

Mr. Vivek Bajaj has over 18 years of trading experience in equities, options, currencies, and commodity markets. He is the co-founder of Stockedge and Elearnmarkets and is passionate about data, analytics, and technology. He serves on various exchange committees and has played a significant role in the evolution of India's derivative market. He has been a speaker at various colleges and higher institutions, including IIT and IIMs.

Related Posts

Understand Slippage in Trading
Technical Analysis

What is Slippage in Trading? Meaning & Examples

March 28, 2025
318
Breakout trading strategies
Technical Analysis

Top 5 Breakout Trading Strategies

March 12, 2025
1.1k
5 stocks for today
Technical Analysis

5 Stocks to Buy Today That Could Beat the NIFTY in 2025!

May 5, 2025
413
Image describing What is marginal trading facility
Technical Analysis

 What is a Margin Trading Facility? Advantages & Risks

April 4, 2025
676

Leave a Reply Cancel reply

Your email address will not be published. Required fields are marked *

Disclaimer

Elearnmarkets (Kredent InfoEdge Pvt. Ltd.) is a SEBI-registered Research Analyst (RA) entity (SEBI Registration No.: INH300007493). The information provided in this article is for educational and informational purposes only and should not be considered as an offer to buy or sell any securities or investment products.

The stocks, securities, and investment instruments mentioned herein are not recommendations under SEBI (Research Analysts) Regulations, 2014. Readers are advised to conduct their own due diligence and seek independent financial advice before making any investment decisions.

Investments in securities markets are subject to market risks. Please read all related documents carefully before investing. Investing in Equity Shares,
Derivatives, Mutual Funds, or other instruments carry inherent risks, including potential loss of capital. Elearnmarkets (Kredent InfoEdge Pvt. Ltd.) does not provide any guarantee or assurance of returns on any investments. Past performance is not indicative of future performance.

Elearnmarkets Logo

Follow Us

Facebook-f X-twitter Instagram Linkedin-in Youtube Telegram

Register on Elearnmarkets

Continue your financial learning by creating your own account on Elearnmarkets.com

Register Free Account

Download App

Playstore logo
Download on app store

Categories

  • Basic Finance
  • Derivatives
  • Financial Planning
  • Fundamental Analysis
  • Technical Analysis
  • Mutual Funds
  • Miscellaneous

Popular On Elearnmarkets

  • Market Superheroes:
  • Vivek Bajaj
  • Chetan Panchamia
  • Ashish Kyal
  • Premal Parekh
  • Abhijit Paul
  • Jegan
  • Sivakumar Jayachadran
  • Jyoti Budhia
  • Vivek Gadodia
  • Vishal Mehta
  • Piyush Chaudhry
  • Santosh Pasi
  • Gomathi Shankar
  • Market Superheroes:
  • Vivek Bajaj
  • Chetan Panchamia
  • Ashish Kyal
  • Premal Parekh
  • Abhijit Paul
  • Jegan
  • Sivakumar Jayachadran
  • Jyoti Budhia
  • Vivek Gadodia
  • Vishal Mehta
  • Piyush Chaudhry
  • Santosh Pasi
  • Gomathi Shankar
  • Courses:​
  • Options Trading
  • Dow Theory
  • Momentum Trading
  • Stock Investing
  • Harmonic Chart Patterns
  • Algo Trading
  • Elliot Wave Theory
  • Advanced Excel
  • Cryptocurrency
  • NSE Certification Course
  • Courses:​
  • Options Trading
  • Dow Theory
  • Momentum Trading
  • Stock Investing
  • Harmonic Chart Patterns
  • Algo Trading
  • Elliot Wave Theory
  • Advanced Excel
  • Cryptocurrency
  • NSE Certification Course
  • Webinars:
  • Bank Nifty Scalping
  • Intraday Trading Strategies
  • Options Trading Strategies
  • Options selling
  • Price Action
  • Relative Strength
  • Tax Planning
  • Options Buying
  • Growth Stocks
  • Portfolio Management
  • Risk Management
  • Renko Charts
  • Crude Oil
  • Traders Psychology
  • Moving Average
  • Multibagger Stocks
  • Free Learning Modules:
  • Intraday Trading
  • Options Scalping
  • Swing Trading
  • Financial Modelling
  • RSI Indicator
  • Bollinger Bands
  • Pricing of Futures
  • Personal Finance
  • Initial Public Offerings (IPO)
  • Value Investing
  • Technical Indicators
  • Candlesticks
  • Chart Patterns
  • Option Greeks
  • ELSS Funds
  • Banking and Insurance
  • Real Estate
  • Gold
  • Book Summaries:
  • Rich Dad Poor Dad
  • Psychology of Money
  • The Intelligent Investor
  • The Richest Man in Babylon
  • Think and Trade Like a Champion
  • Value Investing and Behavioural Finance
  • Trading in the Zone
  • Learn to Earn
  • Book Summaries:
  • Rich Dad Poor Dad
  • Psychology of Money
  • The Intelligent Investor
  • The Richest Man in Babylon
  • Think and Trade Like a Champion
  • Value Investing and Behavioural Finance
  • Trading in the Zone
  • Learn to Earn
  • Tools:
  • CAGR Calculator
  • SIP Calculator
  • eLearnOptions
  • Future Value Calculator
  • Present Value Calculator
  • Atal Pension Yojana
  • Cost of Delay Calculator
  • Become a Crorepati
  • Tools:
  • CAGR Calculator
  • SIP Calculator
  • eLearnOptions
  • Future Value Calculator
  • Present Value Calculator
  • Atal Pension Yojana
  • Cost of Delay Calculator
  • Become a Crorepati

© 2025 Elearnmarkets. All Rights Reserved

  • Visit Elearnmarkets
  • Courses
  • Webinars
  • Financial Guides
  • Get Free Counselling
  • Visit Elearnmarkets
  • Courses
  • Webinars
  • Financial Guides
  • Get Free Counselling

Download Our App

No Result
View All Result
  • Article Categories
    • Basic Finance
    • Derivatives
    • Financial Planning
    • Fundamental Analysis
    • Technical Analysis
    • ETFs & Mutual Funds
    • Marketshala
    • Miscellaneous
  • Language
    • Hindi
    • Bengali
    • English
  • Courses
  • Webinars
  • Stories
Get Free Course

© 2024 Elearnmarkets All Rights Reserved

A Handbook of Technical Analysis
To start your trading journey as a seasoned technical analyst
Download Guide For FREE
Trading Mentorship Program