J. Welled Wilder developed the parabolic SAR, also known as the Parabolic Stop and Reverse. This trend-following indicator displays dots underneath the price bars in an uptrend and above them in a downtrend.
This indicator uses the recent extreme price (EP) with an acceleration factor (AF) to determine where the indicator dots will appear. In the consolidating markets, the PSAR tends to whipsaw back and forth and thus generate false trading signals
Traders can use other indicators, like the average directional index momentum indicator, to confirm the strength of the existing trend. Parabolic SAR, also known as the Parabolic Stop and Reverse, was developed by J. Welled Wilder.
This is a trend-following indicator that is displayed as dots underneath the price bars in an uptrend and above them in a downtrend.
Table of Contents
Let us discuss the basics of this indicator and then how to use this indicator in our trading:
What is Parabolic SAR?
It is a trend-following indicator that is popularly used by traders to set trailing stop losses. The Parabolic SAR has three main functions. Firstly, it highlights the current trend or price direction.
Secondly, it provides potential entry signals, and lastly, it provides potential exit signals. Dots that form below the price and are rising in an upwardly sloping pattern signal an uptrend.
Meanwhile, the dots that form above the price and fall in a downwardly sloping pattern signal a downtrend.
Calculation of Parabolic SAR
The Parabolic SAR (PSAR) indicator uses the recent extreme price (EP) with an acceleration factor (AF) to determine where the indicator dots will appear.
It is calculated as follows:
- Uptrend: PSAR = Prior PSAR + Prior AF (Prior EP – Prior PSAR)
- Downtrend: PSAR = Prior PSAR – Prior AF (Prior PSAR – Prior EP), Where:
- EP = Highest high for an uptrend and lowest low for a downtrend, updated each time a new EP is reached.
- AF = Default of 0.02, increasing by 0.02 each time a new EP is reached, with a maximum of 0.20.
This calculation creates a dot that can be connected with a line, below the rising price or above the falling price.
The dots are always present; this is why this indicator is also known as “stop and reverse.”
How to use this Indicator?
The Parabolic SAR performs well in the trending markets. In the consolidating markets, the parabolic SAR tends to whipsaw back and forth and thus generate false trading signals
The main use of this indicator is to buy when the dots move below the price bars, which signals an uptrend. And sell when the dots move above the price bars signaling a downtrend.
Example:
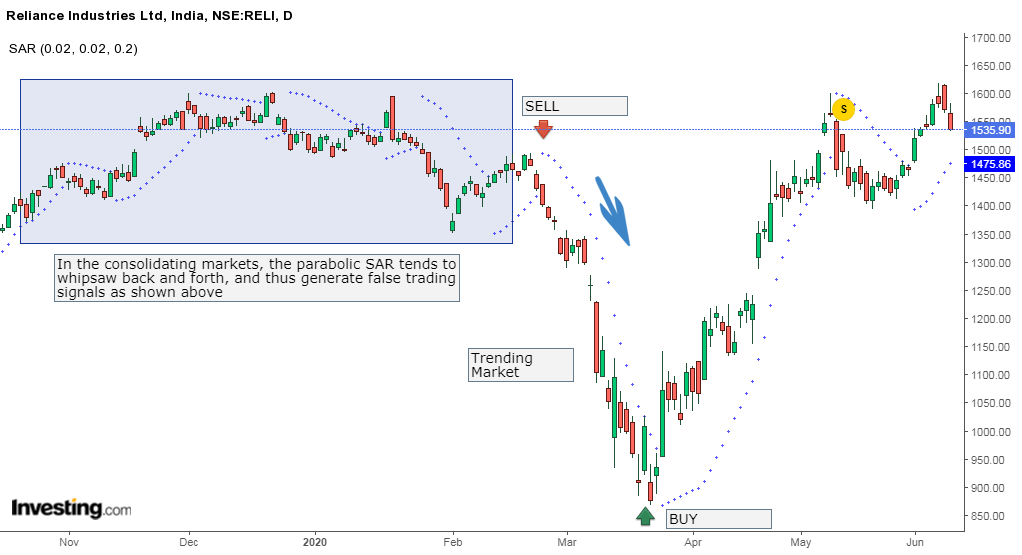
From the Daily chart of Reliance Industries Ltd. below, we can see how, in the consolidating market, the parabolic SAR tends to whipsaw back and forth and thus generate false trading signals.
Meanwhile, in trending markets, it gives a clear signal of buy and sell.
One should shorten the stock when the dots turn above the price, which signals that the trend is going to reverse in the downtrend, as shown above.
One should buy it when the dots turn below the prices, indicating the trend is going to reverse in the uptrend.
Indicators that complement PSAR
Traders can use other indicators, like the average directional index momentum indicator, to confirm the strength of the existing trend.
Other indicators complementing the SAR trading signals include moving averages and candlestick patterns.
Pros and Cons of Parabolic SAR
The main benefit of this indicator is that, during a strong trend, the indicator highlights that the trader should keep holding his position.
The indicator also gives an exit when there is a move against the trend, which signals a reversal.
Traders can also generate powerful trading signals using Parabolic SAR and RSI.
The main drawback of this indicator is that it doesn’t provide good trade signals during sideways market conditions.
Without a clear trend, the indicator constantly flip-flops above and below the price.
How to use Parabolic SAR Scans in StockEdge
You can also use the Parabolic SAR Scans in the StockEdge web version as shown below:
Steps to use Parabolic SAR scans in StockEdge:
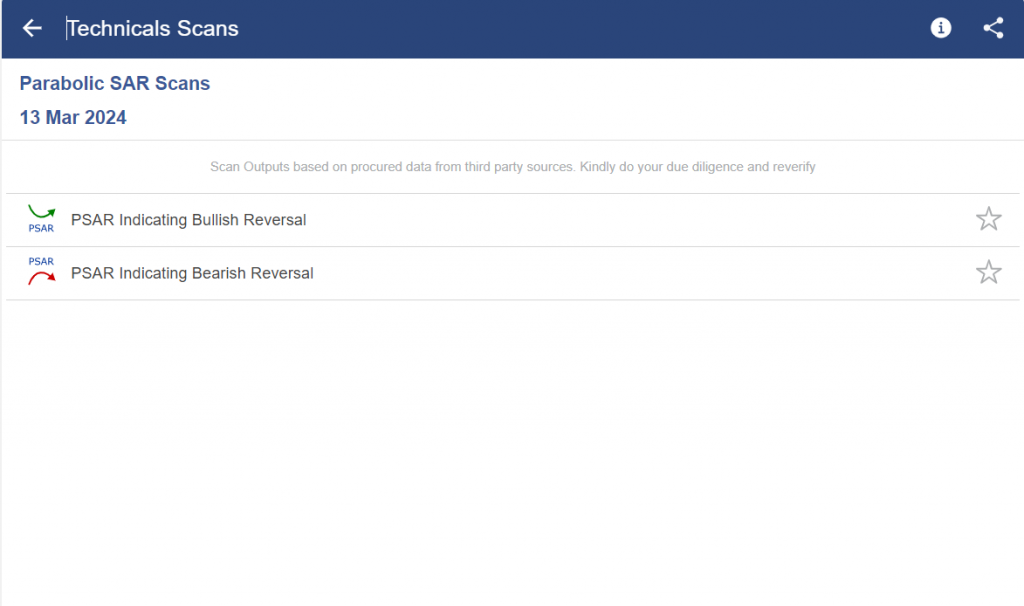
- Under the “Technical scans”, you can select “Parabolic SAR” scans as shown below:
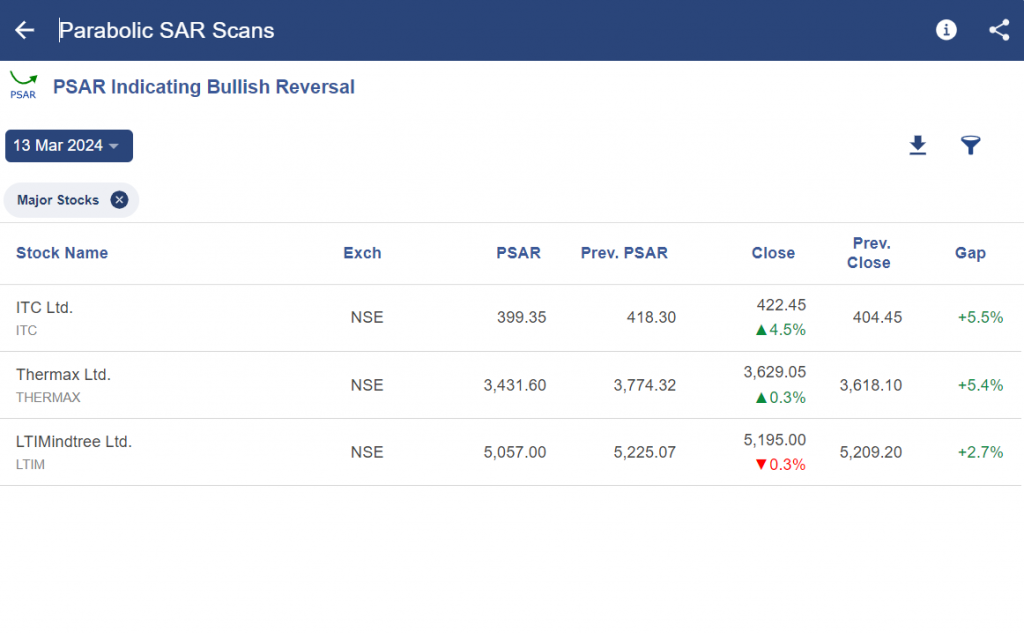
- There are 2 scans in this section as shown below. You can select any of them depending on your trading strategy. You can select PSAR Indicating Bullish reversal scan if you want a list of stocks having a bullish reversal.
- After choosing the scan, you will get a list of stocks with the details as shown below:
Bottomline
Potential trend reversals and entry/exit points can be found with the use of the PSAR indicator. It displays a sliding stop-loss that moves with the price in an effort to restrict the downside while capturing profits. Nevertheless, PSAR needs validation using additional technical analysis techniques and can produce whipsaws, or false signals.
Frequently Asked Questions (FAQs)
What is PSAR?
Parabolic Stop and Reverse is referred to as PSAR. Traders utilize this technical indicator to pinpoint probable turning points in the direction of an asset’s price movement.
How does PSAR work?
On a chart, PSAR positions dots above or below the price. The dots show an upward trend if they are below the price and a negative trend if they are above. The dots’ reversal indicates a possible reversal.
What do the PSAR dots represent?
The dots show possible levels of stop-loss or potential reversal points in the trend. The dots are computed using the acceleration factor, which rises with time and brings the price in a trending market closer.





nice
Hi,
Thank you for Reading!
Keep Reading!