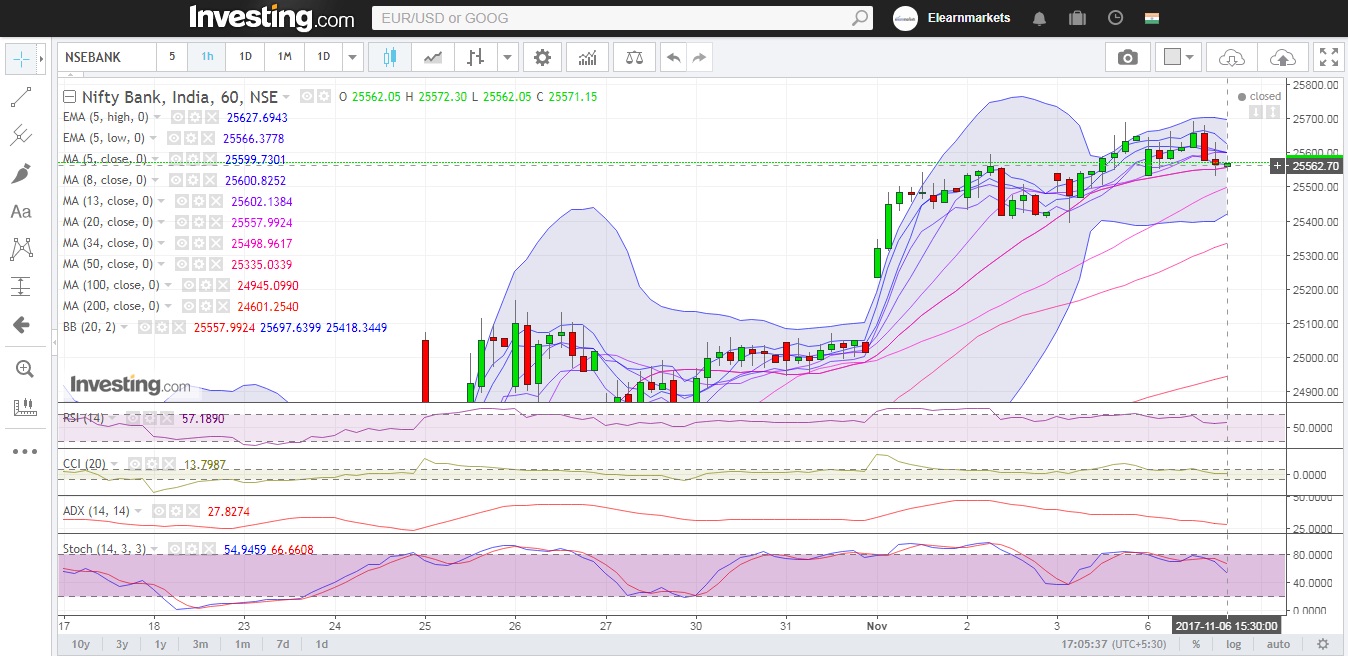
How to Withdraw Money from ATM ?
April 29, 2024
Business Models – Example, Types, Importance & Advantages
April 12, 2024
9 Types of Volume Indicators a trader should know
March 13, 2024
5 MACD Strategies For Stock Market Trading
April 24, 2024
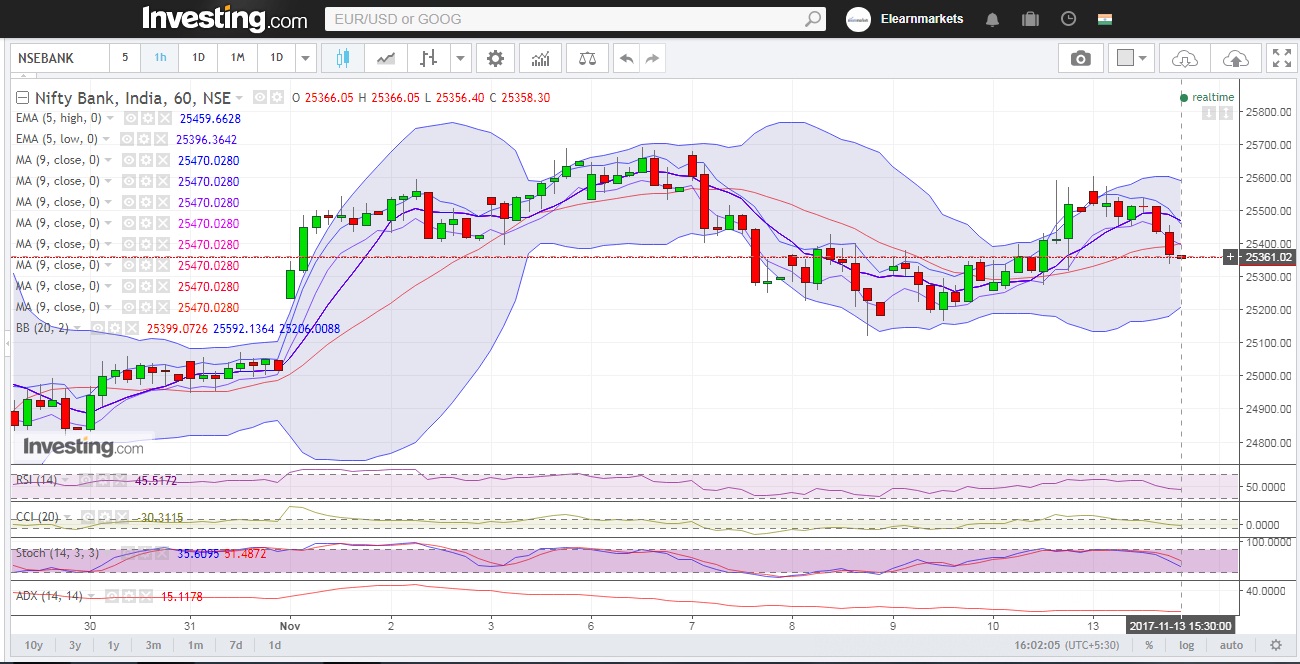
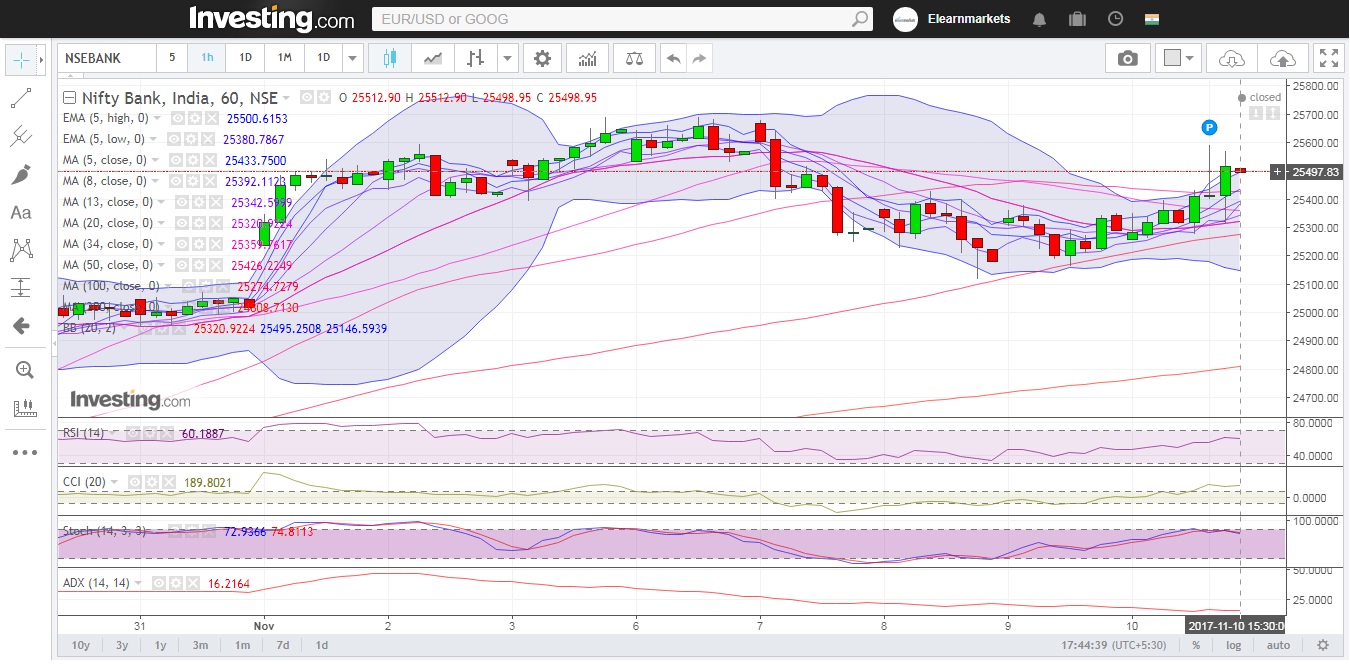
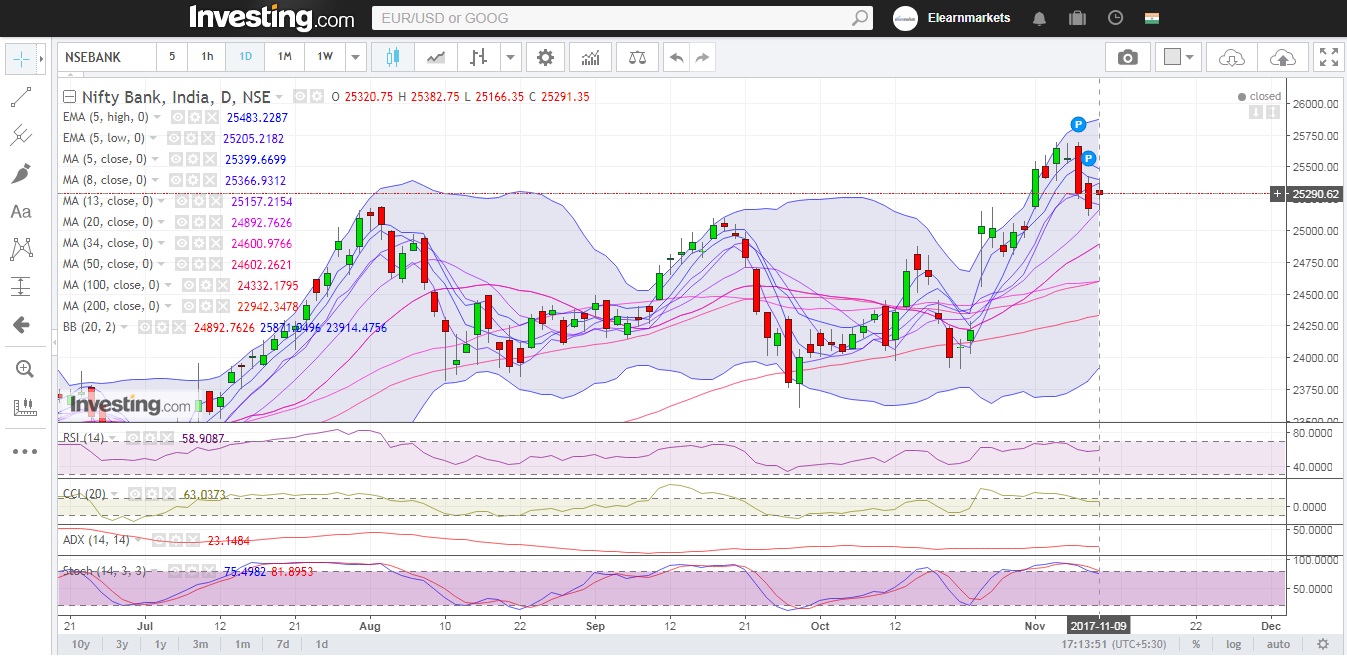
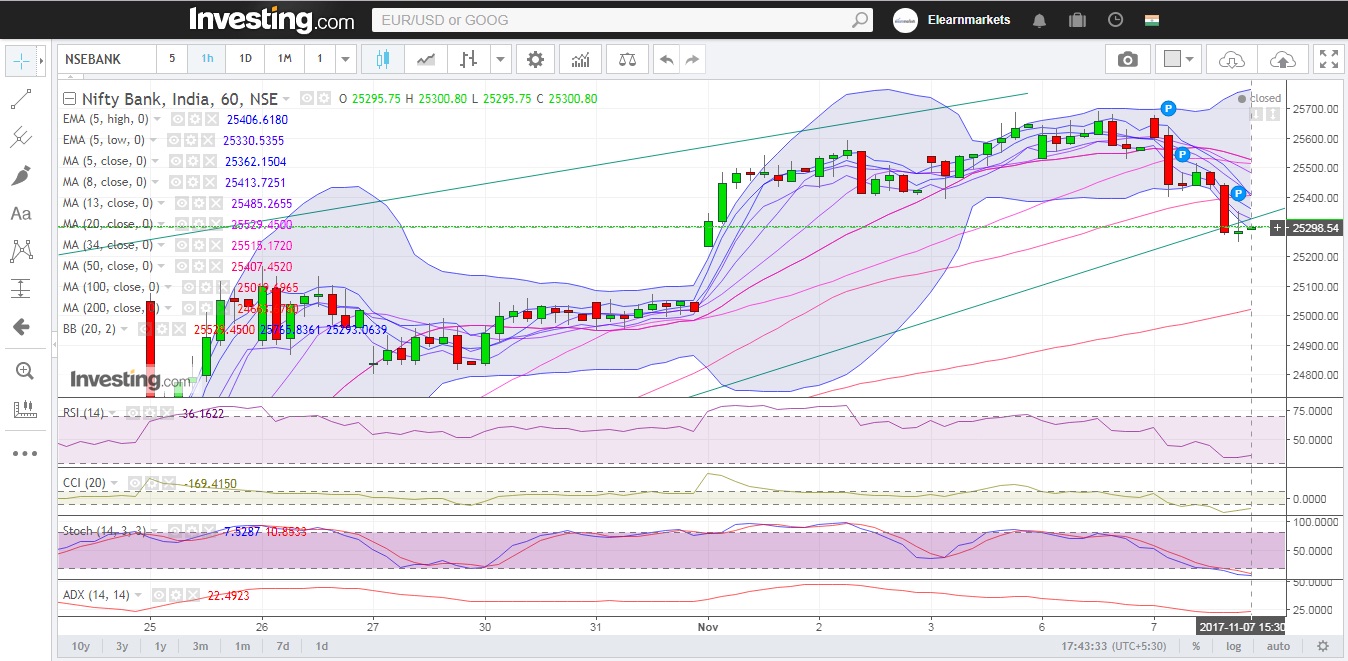
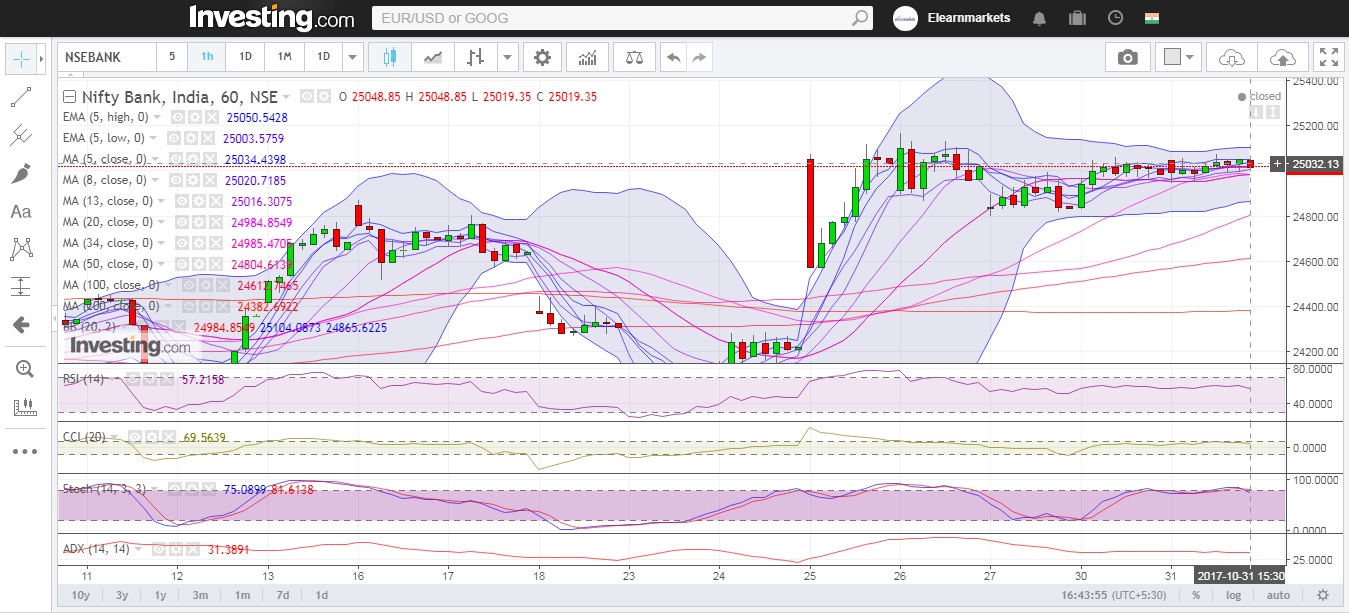
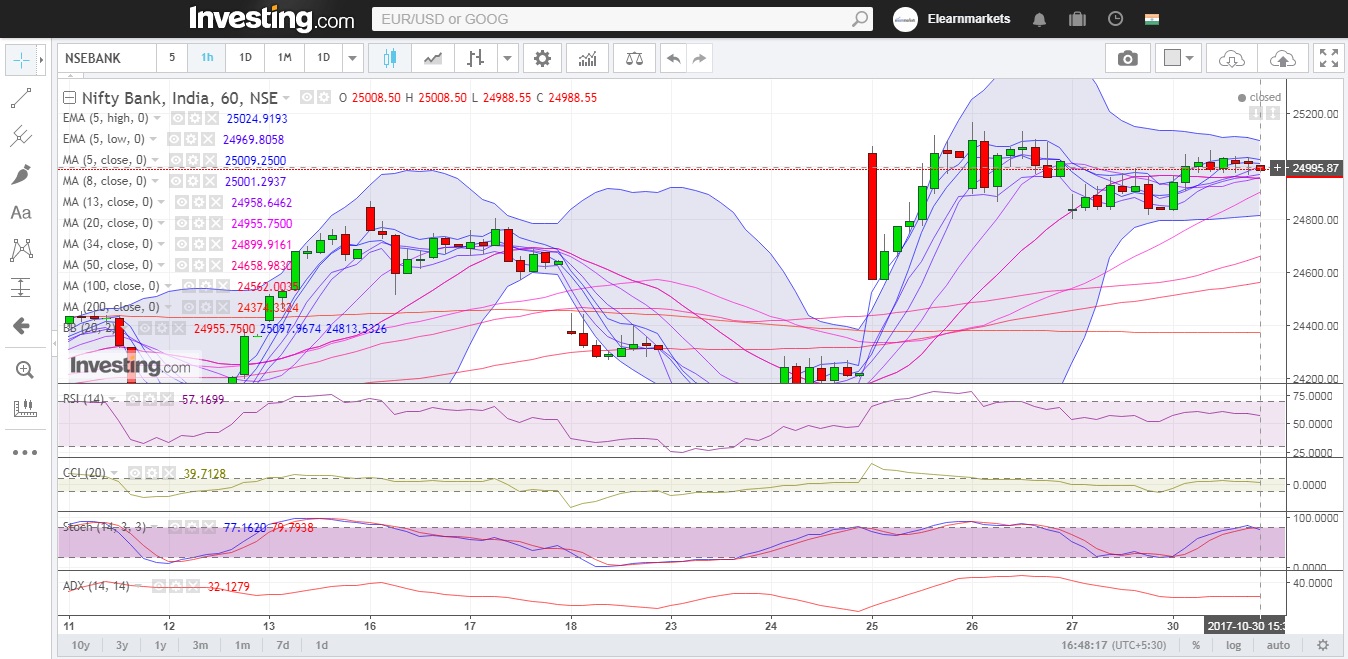
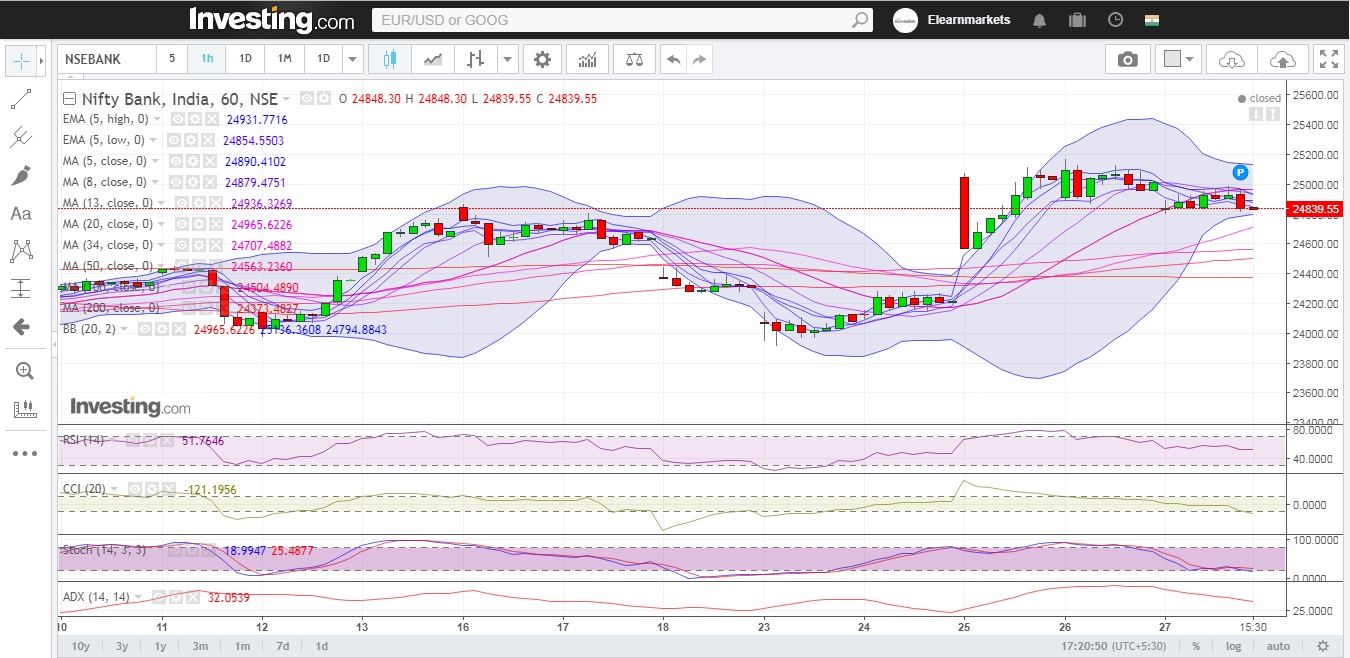
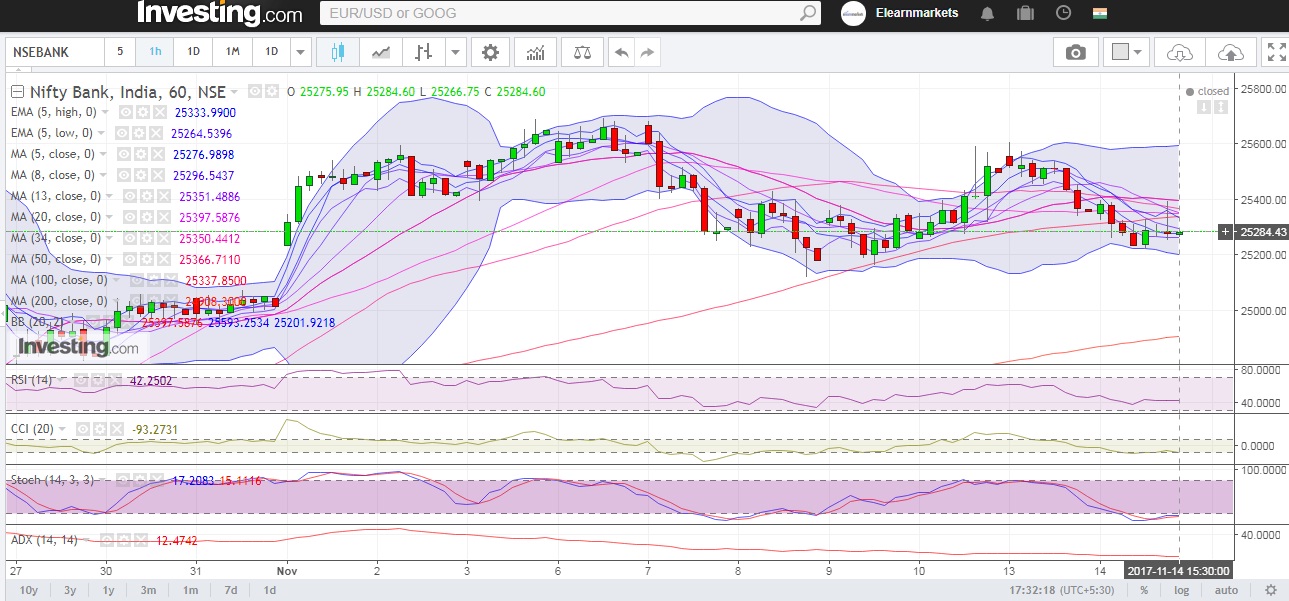
Bank Nifty opened above its 5 Day Low EMA (25351 approx) today. The Index traded in a range of 174 points and closed below its opening price. Hourly Technicals: In the Hourly Chart, Bank Nifty has closed above its 5 HMA of (25276 approx). The Index is likely to face immediate resistance above it's 5 hourly high EMA (25333 approx). Bank Nifty will find its next support around the 5 Hourly low EMA ( 25264 approx). Hourly RSI stands close to the lower end of the normal range while the CCI is indicating that sentiments are negative. ADX is indicating that Bank-Nifty might not undergo major volatility yet. Figure: Bank-Nifty Hourly Chart Daily Technicals: The daily chart indicates that Bank Nifty has closed marginally above its 5 day low EMA (25254 approx). The Index will face immediate resistance around its 8 DMA(25392 approx). On the downside, however, if Bank Nifty breaks and closes below its intraday low (25224 approx), it could find support at its 20 DMA (25012 approx). The daily RSI indicator has closed midway between the normal range. The CCI indicator, however, is indicating that sentiments are still positive. The ADX indicates that momentum might remain slack. Figure: Bank-Nifty Daily Chart Figure: Bank-Nifty Tech Table Watch ...
Bank Nifty opened above its 5 Day High EMA (25559 approx) today . The Index traded in a range of 265 points and closed below its opening price. Hourly Technicals: In the Hourly Chart, Bank Nifty has closed at its 34 HEMA of (25356 approx).The Index is likely to face immediate resistance above its 5 hourly low EMA (25396 approx). Hourly RSI stands close to the lower end of the normal range while the CCI is indicating that sentiments are negative. ADX is indicating that Bank Nifty might not undergo volatility yet. Figure: Bank-Nifty Hourly Chart Daily Technicals: The daily chart indicates that Bank Nifty has closed below its 5 day high EMA (25550 approx). The Index will face immediate resistance around its 8 DMA(25410 approx). On the downside however, if Bank Nifty breaks and closes below its 5 DMA (25326 approx), it could find support at its 5 day low EMA (25257 approx). The daily RSI indicator has closed midway between the normal range.The CCI indicator however is indicating that sentiments are still positive.The ADX indicates that momentum might remain slack. Figure: Bank-Nifty Daily Chart Figure: Bank-Nifty Tech Table
Bank Nifty opened above its 5 Day Low EMA (25262 approx) today . The Index traded in a range of ...
Bank Nifty opened above its 5 Day Low EMA (25205 approx) today . The Index traded in a range of ...
Bank Nifty opened above its 5 Day High EMA (25671 approx) today . The Index corrected sharply by 430 points ...
Bank Nifty opened at 25537 this morning, the Index moved within a range of 160 points today and closed above ...
Bank Nifty opened above its 5 Day High EMA (25531 approx). The Index traded in a range of 301 points ...
Bank Nifty opened at 25473 this morning, the Index moved by 191 points today and closed above its 5 day ...
Bank Nifty opened at 25239 this morning, the Index moved by 306 points today and closed above its 5 day ...
Bank Nifty opened at 25048 this morning, the Index moved by 125 points today and closed marginally above its 5 ...
Bank Nifty opened at 24842 this morning, the Index moved by 229 points today and closed marginally above its 5 ...
Bank Nifty opened at 24838 this morning, the Index moved by 190 points today and closed below its upper Bollinger ...
Create your free Elearnmarkets account and
Get 20% off with code WELCOME
on your first purchase of any course or webinar