An outside day is a particular trading day when the high is higher than the previous high and the low is lower than the previous low.
The trading range exceeds the range of the previous day on both the upper and the lower side.
An outside day is a wide-range, volatile trading session which encapsulates the entire trading range of the previous day.
The candlestick’s counterpart of the outside day is the Engulfing pattern, which consists of two bars, one small range candle followed by one wide range candle.
Read more: All you need to know about the Japanese Candlestick
There are two types of engulfing patterns distinguished on the basis of the color of second candle and the trend preceding the pattern.
They are the Bearish Engulfing Pattern and the Bullish Engulfing Pattern.
Engulfing pattern is a reversal pattern, and high volumes on the second candle increase the strength of the pattern.
The tail and the wick are short on the second candle.


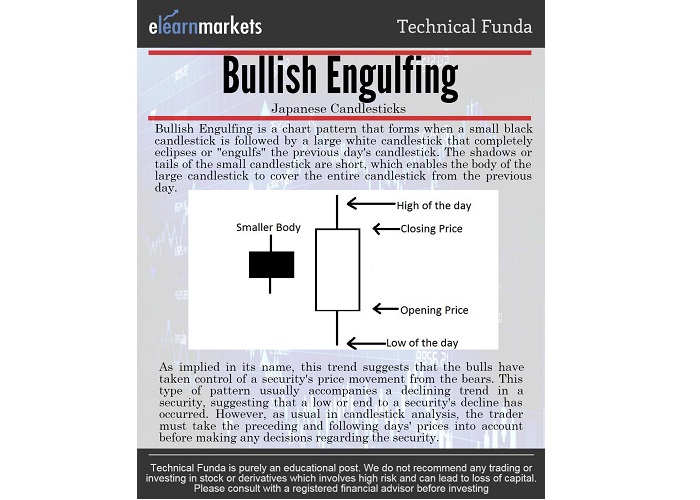
Bullish Engulfing Pattern
A bullish engulfing pattern forms after a downtrend.
It indicates a market bottom, at least for some time.
A wide range green candle encapsulated in a down (red) candle.
High volumes on the second candle is a good indication as it suggests increased buying interest in the stock.
Learn the art and science of trading with the help of extensive technical analysis of stocks, the analysis of financial charts, trading strategies and more. Enroll for NSE Academy Certified Technical Analysis course on Elearnamrkets.com
Bearish Engulfing Pattern
A Bearish engulfing pattern forms after an uptrend indicated a top.
The prices are seen moving away from the top after the formation of this pattern.
High volume on the outside bar is usually not observed in this pattern.
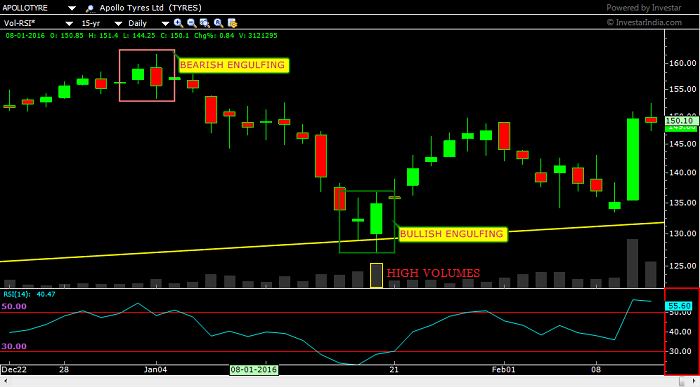
In the following chart of Apollo tyres, we can observe an example of Bearish Engulfing and Bullish Engulfing which lead to the turn in the prevailing trend.
Observe how on the Bearish Engulfing the volumes were not high but on the Bullish Engulfing, the volumes supported very well the occurrence of the outside bar.
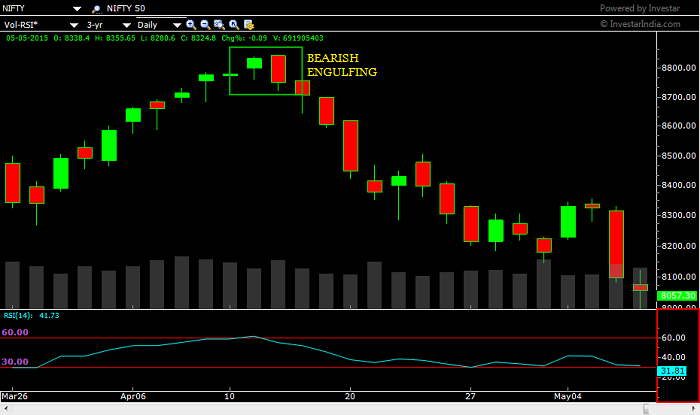
The Daily chart of Nifty50 Index also has the Bearish Engulfing Pattern formed near the high level of 8800.
Back then no one had thought that the current level of 70 would be a possibility.
See it for your self in the following chart.
Read More- All 35 Candlestick Chart Patterns in the Stock Market
Bottomline:
We hope that this article helped you to grasp Engulfing Patterns in a clear manner.
However, there are several other equally important candlestick patterns that you need to know about in order to be a better trader or an investor.
We will discuss some other important technical chart patterns in further articles.
Happy Learning!!