Elearnmarkets - Financial Market Learning
  • Categories
    • Basic Finance
    • Derivatives
      • Futures
      • Options
    • Financial Planning
    • Fundamental Analysis
    • Technical Analysis
    • Marketshala
    • Miscellaneous
  • Language
    • English
    • Hindi
    • Bengali
No Result
View All Result
  • Courses
  • Webinars
  • Stories
Elearnmarkets - Learn Stock Market, trading, investing for Free
No Result
View All Result
Home Technical Analysis
NR4 and NR7 Trading Strategy Setup 1

NR4 and NR7 Trading Strategy Setup

Elearnmarkets by Elearnmarkets
September 14, 2023
in Technical Analysis, Charts, Patterns & Indicators
Reading Time: 7 mins read
10
82.6k
VIEWS
Share on FacebookShare on XShare on WhatsApp

Narrow Range 4 and Narrow Range 7 (NR4 and NR7) help to find the calm so that we can prepare and profit from the impending storm. The market goes through a regular contraction and expansion cycle.

“The quiet period before the next explosive market move is like the calm before the storm”

In this trade setup, you should wait patiently for the market in order to enter contraction which means for range of the bars to reduced. Once we spot NR4 or NR7, a bigger price movement and direction is expected. It is a breakout and reversal pattern which helps to generate profit after a range.

In this blog, let us discuss what Narrow Range 4 and Narrow Range 7 mean and how to trade with them:

Table of Contents

  • NR4 and NR7 Trading Strategy
  • How to find NR7 day?
  • How to find NR4 day?
  • NR4 and NR7 Trading Example
  • How to trade using Narrow Range Scans in StockEdge?
  • Bottomline

NR4 and NR7 Trading Strategy

Narrow Range Trading Strategy is a breakout-based method that assumes that the price of the security trends up or down after consolidation in a narrow range.

For NR7 the default period is 7 days which means that if the price range of any particular day is lowest as compared to the last 7 days then that day is NR 7 days. Similarly, For NR4 the default period is 4 days which means that if the price range of any particular day is the lowest as compared to the last 4 days then that day is NR 4 days.

The range is calculated as the difference between the High and Low of the particular day. The day after the NR 7 or NR 4 day acts as the confirming day on where the price will move further. If the breakout happens at the high of the NR 7 candle then indicates bullishness whereas If the breakout happens at the low of the NR 4 candle then indicates bearishness.

RelatedPosts

Beginner's Guide to Trading Penny Stocks 6

Beginner’s Guide to Trading Penny Stocks

September 26, 2023
252
5 Important Volatility Indicators that Traders should know 7

5 Important Volatility Indicators that Traders should know

September 19, 2023
58.1k
Top 5 Momentum Indicators that Analyses Trend Strength 8

Top 5 Momentum Indicators that Analyses Trend Strength

September 7, 2023
93.8k

The philosophy behind this pattern is the same as the Bollinger Band Squeeze, a volatility contraction followed by a volatility expansion.

NR4 and NR7 Strategy

How to find NR7 day?

Following are steps to identify NR7 day:

  1. Get the high and low data of the last few days
  2. Calculate the range for every day (high-low)
  3. Compare the range of today and the previous 6-day range.
  4. If today’s range is the smallest of all the 7 days then it is NR 7 days else not.

How to find NR4 day?

Following are steps to identify NR4 day:

  1. Get the high and low data of the last few days
  2. Calculate the range for every day (high-low)
  3. Compare the range of today and the previous 3-day range.
  4. If today’s range is the smallest of all the 4 days then it is NR 4 days else not.

The NR 4 day can be seen from the chart below:

NR4 and NR7 Trading Strategy Setup 2

NR4 and NR7 Trading Example

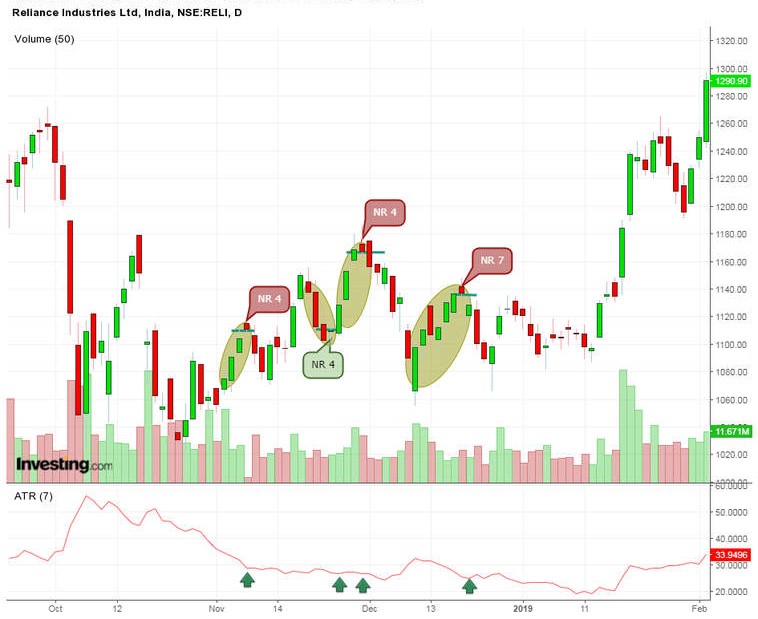
The trading example shows Reliance with 4 signal signs in less than 2 months. We have also used the Average True Range indicator which shows the range of the candles. We can see at the NR4 and NR 7 candles the ATR has decreased which means that the range of the candle is the lowest in the last 4 or 7 days.

A next-day move above the high is bullish whereas below the low is bearish. One can notice that NR 4 is formed back to back on three different occasions. The first NR 4 gave the bearish signal and we can see that the next day there is a gap down opening which confirms the signal. Next NR 4 signal is a bullish reversal signal confirmed by the volume and bullish candle on the next day.

We can see back-to-back NR 4 candles that generated a bearish candlestick pattern. One should sell when the price crosses the low of the NR 4 candle or may incur a loss if the signal does not work out. At this candle, we can also see that ATR has declined.

Finally, we can notice NR 7 giving a bearish breakout, confirmed by the volume and next-day candle.

NR4 and NR7 Trading Strategy Setup 3

Narrow-range stocks provide you with an opportunity to be ahead of trade followers/indicators who may only enter the trend after you. One of the simplest strategies to trade these setups is to go long above the day’s high of NR7 or NR4 while setting a stop at the day’s low of the same.

You can go short below the Day’s low of NR7 or NR4 with a stop at the day’s high of NR7 or NR4 day. This pattern gives a trader a distinct edge to trade at least the next 2-3 days. In many situations, NR 7 breakout is found near the beginning of the new wave.

How to trade using Narrow Range Scans in StockEdge?

We can use Narrow Range Scans available in StockEdge for filtering out stocks and trading accordingly. Below is the list of Narrow Range Scans:

NR4 and NR7 Trading Strategy Setup 4

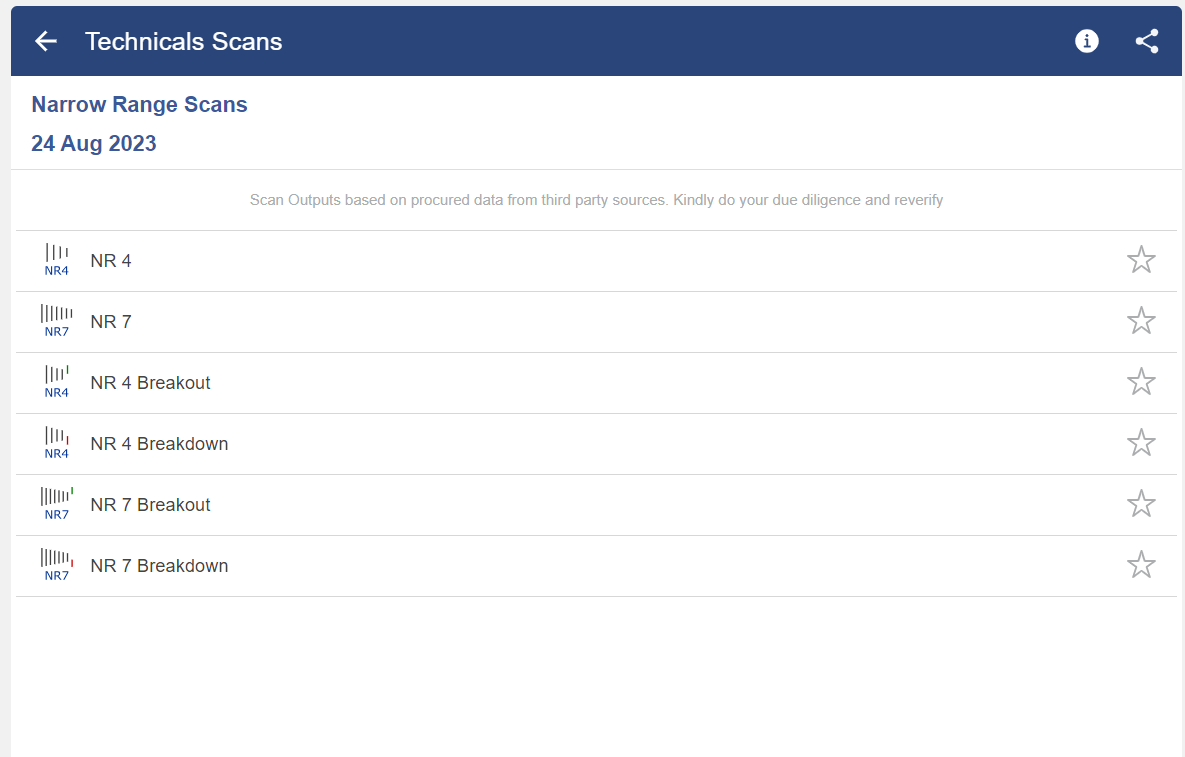
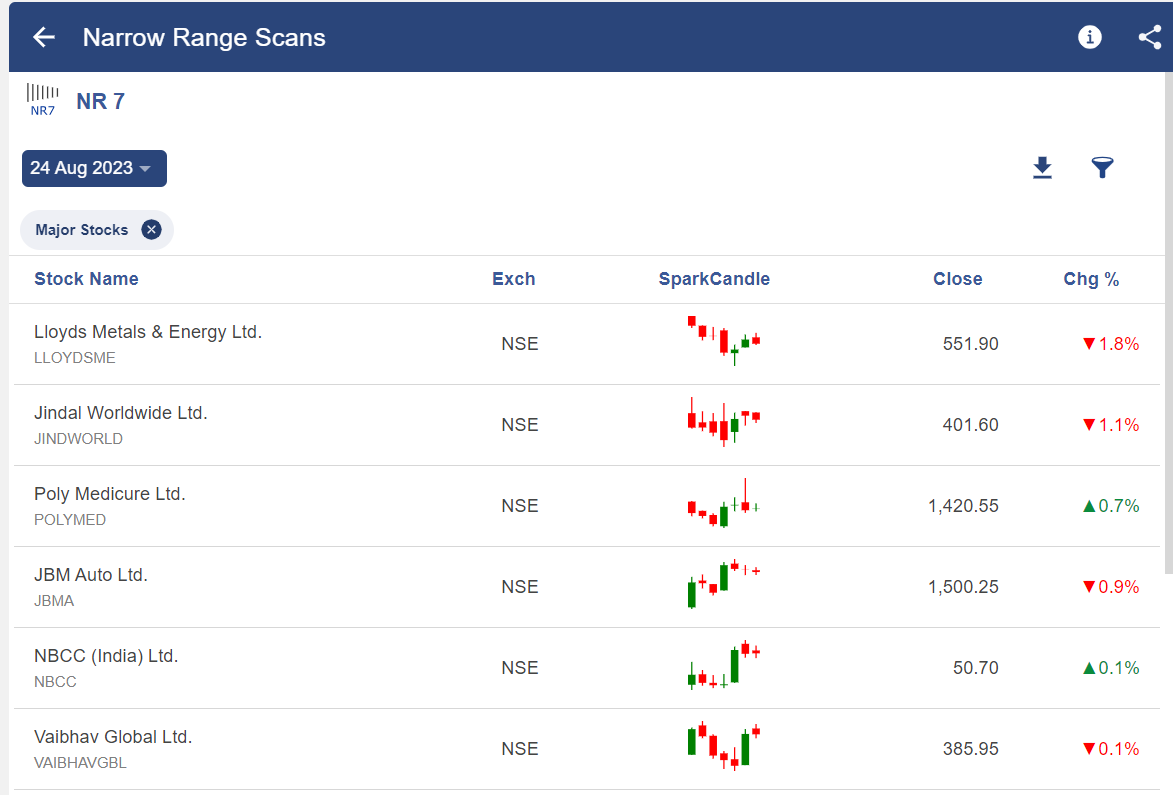
After clicking on any of the above scans, we will get a list of stocks fulfilling that criteria as shown below-

NR4 and NR7 Trading Strategy Setup 5

Learn more about Technical Analysis Strategies through our Technical Analysis Made Easy Course

Bottomline

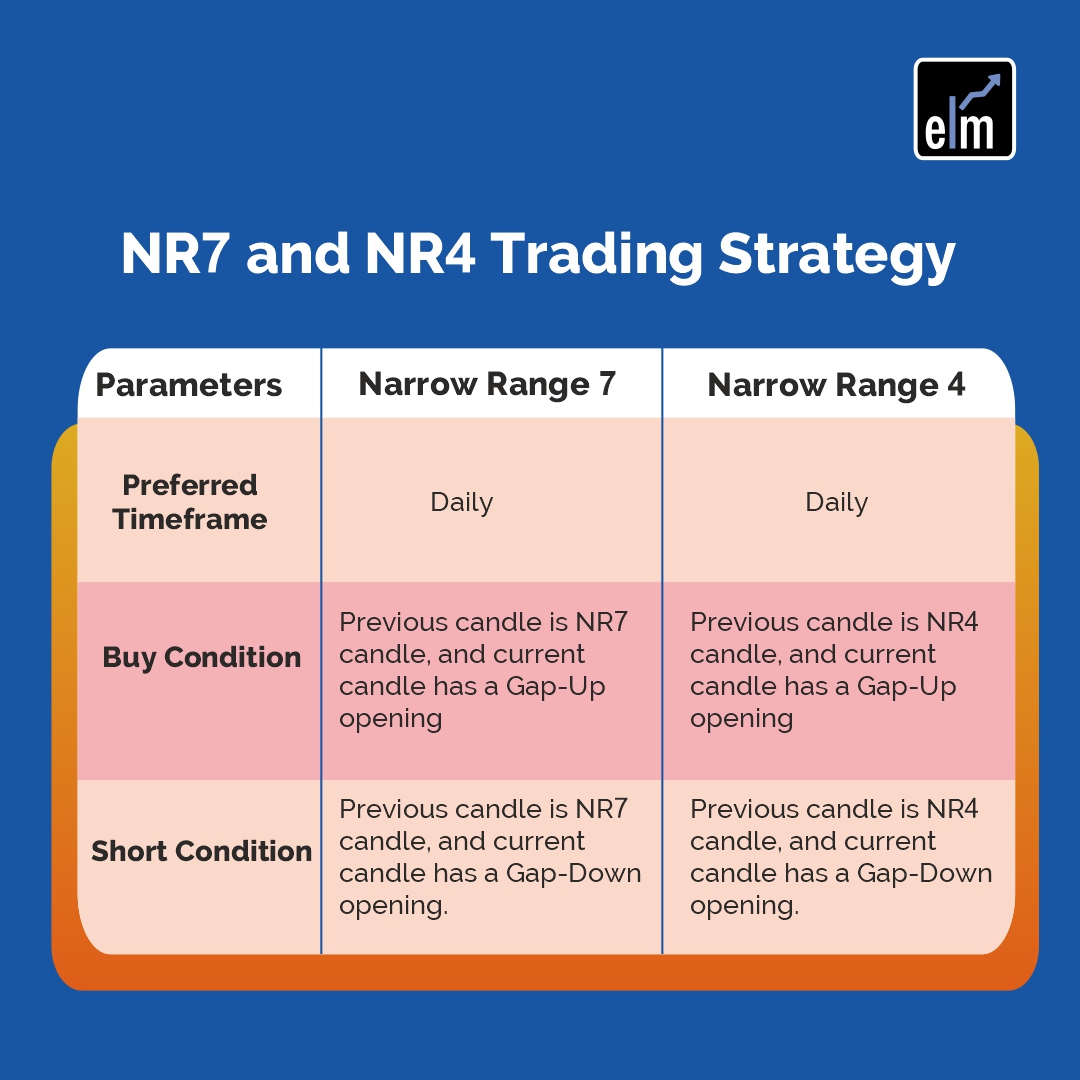
For NR7 stocks the default period is 7 days, if the price range of any particular day is lowest as compared to the last 7 days then that day is NR 7 days. For NR4 the default period is 4 days, if the price range of any particular day is lowest as compared to the last 4 days then that day is NR 4 day. One should buy only when the previous candle is an NR7 candle, and the current candle has a Gap-Up opening. One should sell only when the previous candle is an NR7 candle, and the current candle has a Gap-Down opening.

You can learn more about the concepts through our share trading courses online.

Tags: advancedBreakout PatternsenglishNarrow RangeNR4NR7
Share4TweetSend
Get Kotak Offer Get Kotak Offer Get Kotak Offer
Previous Post

The Smart Way to become Option Chain Expert in 30 min

Next Post

Best Trading Platforms in India: A Detailed Comparison

Elearnmarkets

Elearnmarkets

Elearnmarkets (ELM) is a complete financial market portal where the market experts have taken the onus to spread financial education. ELM constantly experiments with new education methodologies and technologies to make financial education effective, affordable and accessible to all. You can connect with us on Twitter @elearnmarkets.

Related Posts

Beginner's Guide to Trading Penny Stocks 9
Technical Analysis

Beginner’s Guide to Trading Penny Stocks

September 26, 2023
252
5 Important Volatility Indicators that Traders should know 10
Technical Analysis

5 Important Volatility Indicators that Traders should know

September 19, 2023
58.1k
Top 5 Momentum Indicators that Analyses Trend Strength 11
Technical Analysis

Top 5 Momentum Indicators that Analyses Trend Strength

September 7, 2023
93.8k
5 important roles of Relative Strength Index (RSI) 12
Technical Analysis

5 important roles of Relative Strength Index (RSI)

September 11, 2023
41.5k

Comments 10

  1. anand says:
    4 years ago

    in the chart shown above of reliance industries the NR4/NR7 strategy does not match with “key takeaway” points 3 and 4

    Reply
    • Sakshi Agarwal says:
      4 years ago

      Hi Anand,

      This is just one of the technical strategies which you can use on the charts.

      Thank you for Reading!

      Keep Reading!

      Reply
  2. Raman says:
    3 years ago

    When you say gap up or gap down. How much in term of percentage one should consider minimum for the same.

    Reply
    • Sakshi Agarwal says:
      3 years ago

      Hi,

      Gaps are areas on a chart where the price of a stock (or another financial instrument) moves sharply up or down, with little or no trading in between. As a result, the asset’s chart shows a gap in the normal price pattern. There is no fixed percentage for it.

      Thank you for reading!!

      Reply
  3. Dhevins vini says:
    3 years ago

    i appreciate your work. thank you.

    Reply
    • Sakshi Agarwal says:
      3 years ago

      Hi,

      Thank you for Reading!

      Keep Reading!

      Reply
  4. Jnbarman says:
    2 years ago

    Very good strategy 👍

    Reply
    • Sakshi Agarwal says:
      2 years ago

      Hi,

      We are glad that you liked our post.

      Thank you for Reading!

      Reply
  5. Renjith R says:
    2 years ago

    good one

    Reply
    • Sakshi Agarwal says:
      2 years ago

      Hi,

      We really appreciated that you liked our blog.

      Keep Reading!

      Reply

Leave a Reply Cancel reply

Your email address will not be published. Required fields are marked *

Elearnmarkets Logo

Follow Us

Facebook-f Twitter Instagram Linkedin-in Youtube Telegram

Register on Elearnmarkets

Continue your financial learning by creating your own account on Elearnmarkets.com

Register Free Account

Download App

Playstore logo
Download on app store

Categories

  • Basic Finance
  • Derivatives
  • Financial Planning
  • Fundamental Analysis
  • Technical Analysis
  • Marketshala
  • Miscellaneous

Popular On Elearnmarkets

  • Market Superheroes:
  • Vivek Bajaj
  • Chetan Panchamia
  • Ashish Kyal
  • Premal Parekh
  • Abhijit Paul
  • Jegan
  • Sivakumar Jayachadran
  • Vishal Malkan
  • Jyoti Budhia
  • Vivek Gadodia
  • Vishal Mehta
  • Piyush Chaudhry
  • Santosh Pasi
  • Gomathi Shankar
  • Market Superheroes:
  • Vivek Bajaj
  • Chetan Panchamia
  • Ashish Kyal
  • Premal Parekh
  • Abhijit Paul
  • Jegan
  • Sivakumar Jayachadran
  • Vishal Malkan
  • Jyoti Budhia
  • Vivek Gadodia
  • Vishal Mehta
  • Piyush Chaudhry
  • Santosh Pasi
  • Gomathi Shankar
  • Courses:​
  • Options Trading
  • Dow Theory
  • Momentum Trading
  • Stock Investing
  • Stock Market for Beginners
  • Harmonic Chart Patterns
  • Algo Trading
  • Elliot Wave Theory
  • Advanced Excel
  • Cryptocurrency
  • NSE Certification Course
  • Courses:​
  • Options Trading
  • Dow Theory
  • Momentum Trading
  • Stock Investing
  • Stock Market for Beginners
  • Harmonic Chart Patterns
  • Algo Trading
  • Elliot Wave Theory
  • Advanced Excel
  • Cryptocurrency
  • NSE Certification Course
  • Webinars:
  • Bank Nifty Scalping
  • Intraday Trading Strategies
  • Options Trading Strategies
  • Options selling
  • Price Action
  • Relative Strength
  • Tax Planning
  • Options Buying
  • Growth Stocks
  • Portfolio Management
  • Relative Strength Index
  • Risk Management
  • Renko Charts
  • Crude Oil
  • Traders Psychology
  • Moving Average
  • Multibagger Stocks
  • Free Learning Modules:
  • Intraday Trading
  • Options Scalping
  • Swing Trading
  • Financial Modelling
  • RSI Indicator
  • Bollinger Bands
  • Pricing of Futures
  • Personal Finance
  • Initial Public Offerings (IPO)
  • Value Investing
  • Technical Indicators
  • Candlesticks
  • Chart Patterns
  • Option Greeks
  • ELSS Funds
  • Banking and Insurance
  • Real Estate
  • Gold
  • Book Summaries:
  • Rich Dad Poor Dad
  • Psychology of Money
  • The Intelligent Investor
  • The Richest Man in Babylon
  • Think and Trade Like a Champion
  • Value Investing and Behavioural Finance
  • Trading in the Zone
  • Learn to Earn
  • Book Summaries:
  • Rich Dad Poor Dad
  • Psychology of Money
  • The Intelligent Investor
  • The Richest Man in Babylon
  • Think and Trade Like a Champion
  • Value Investing and Behavioural Finance
  • Trading in the Zone
  • Learn to Earn
  • Tools:
  • CAGR Calculator
  • SIP Calculator
  • eLearnOptions
  • Future Value Calculator
  • Present Value Calculator
  • Atal Pension Yojana
  • Cost of Delay Calculator
  • Become a Crorepati
  • Tools:
  • CAGR Calculator
  • SIP Calculator
  • eLearnOptions
  • Future Value Calculator
  • Present Value Calculator
  • Atal Pension Yojana
  • Cost of Delay Calculator
  • Become a Crorepati

© 2023 Elearnmarkets. All Rights Reserved

  • Visit Elearnmarkets
  • Courses
  • Webinars
  • Financial Guides
  • Get Free Counselling
  • Visit Elearnmarkets
  • Courses
  • Webinars
  • Financial Guides
  • Get Free Counselling

Get Elearnmarkets App

No Result
View All Result
  • Article Categories
    • Basic Finance
    • Derivatives
    • Financial Planning
    • Fundamental Analysis
    • Technical Analysis
    • Marketshala
    • Miscellaneous
  • Language
    • Hindi
    • Bengali
    • English
  • Courses
  • Webinars
  • Stories

© 2020 Elearnmarkets All Rights Reserved

A Handbook of Technical Analysis
To start your trading journey as a seasoned technical analyst
Download Now
View Details
View Course Details
Guidebook On Chart Patterns
Take Your Trading To The Next Level With Strategies Shared In This Ebook
Download Now