Elearnmarkets - Financial Market Learning
  • Courses
  • Webinars
  • Stories
  • Language
    • English
    • Hindi
    • Bengali
No Result
View All Result
Get Free Course
  • Basic Finance
  • Derivatives
    • Futures
    • Options
  • Financial Planning
  • Fundamental Analysis
  • Technical Analysis
  • Mutual Funds
  • Marketshala
  • Miscellaneous
Elearnmarkets - Learn Stock Market, trading, investing for Free
  • Courses
  • Webinars
  • Stories
  • Language
    • English
    • Hindi
    • Bengali
No Result
View All Result
Get Free Course
Elearnmarkets - Learn Stock Market, trading, investing for Free
No Result
View All Result
Home Technical Analysis
Moving Average

Why Moving Average is important for your technical toolbox

Elearnmarkets by Elearnmarkets
November 9, 2021
in Technical Analysis
Reading Time: 5 mins read
0
4.1k
VIEWS
Share on FacebookShare on XShare on WhatsApp

The world of Technical Analysis has always been filled with fancy terms and tools. With new indicators being developed every day, you often tend to forget the classic tools which actually formed the origin of Technical Analysis. One such tool is the technical indicator known as the Moving Average. It is a very powerful tool that can come in handy to every stock trader.

Table of Contents
What is Moving Average?
Use of Moving Average
What Moving Average trend tell you?
Bottomline

What is Moving Average?

Moving averages provide important information regarding the direction of the market.

They were created to provide the directional information of the market to smoothen out the zig-zags that form during a trend formation.

In the current generation of high speed computer calculations, its use has become much more relevant and simplified.

Learn about Magic of Moving Averages from Market Experts

Now they can be calculated and utilized up to the very minute and second of the price information when it appears in your computer screen.

Their applications along with the candlestick charts and pattern formations can provide trading signals for a very strong and profitable trading format.

As like all other technical indicators, Moving averages(MA) are utilized in correlation with other technical tools.

How they are followed and how they are utilized make a difference in moderate returns and highly profitable returns.

Trading techniques using the MA provide improved entries and exits into the markets.

Use of Moving Average

The most common use is when the relevant moving averages like the Simple Moving Average (SMA), Weighted Moving Average (WMA) and the Exponential Moving Average (EMA) cross each other and generate trading signals.

Read more: How to trade using moving average on different timeframes?

However, just observing and referring to the moving average isn’t gonna help you to make money. Applying candlestick patterns along with MA provide a higher function to the indicator.

Candlestick patterns and MA together form strategies with higher profitability with the formation of support and resistance levels with reference to MA.

This will help you identify the correct trend and execute trades with a better percentage of profits. The use of MA is very simple.

Once applied to candlestick charts, it makes the identification and analysis of supports and resistances very simple.

But the question always arises whether to use the Simple Moving Average (SMA), Weighted Moving Average (WMA) or the Exponential Moving Average (EMA).

Due to its technicality, the EMA has gained popularity over the years.

Money managers as well as the majority of technical investors use the EMA for their trading as well as investing decisions. 

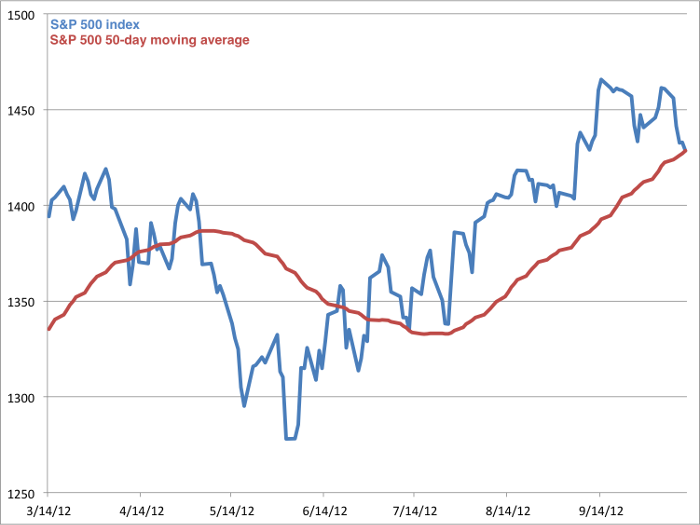
What Moving Average trend tell you ?

The MA provides a simple visual indication of a trend’s slope.

When the MA is rising, it indicates a trend’s slope on the upside.

When the MA is falling, it indicates a downtrend. When the MA is trending sideways, it indicates a sideways market.

Traders who follow moving indicators follow these basic rules for their entry and exits:

  1.  If the EMA is trending up, trade the market on the long side. Buy when the prices pullback to, or slightly below, the MA. After a long position is established, use the recent low as your stop.
  2. If the EMA is trending down, trade the market to the short side. Short when prices rally to or slightly above the EMA. Once the short position is established, use the recent high as your stop loss.
  3. When the EMA is trading flat, or trending sideways, it signifies a sideways market. If you are an intelligent trader, utilize the MA to identify the sideways trend and avoid trading in this kind of market.

So, simply stated, traders who use EMA as a trend indicator go long when the prices are trading above the MA and go short when the prices are trading below the MA. If you are a candlestick trader, you will have an immense advantage over the average retail investors.

Watch this video to understand the magic of Moving Averages –

Bottomline:

As you are able to derive more information from the charts evaluations and your own chart studying, the relevance of these moving average start to appear more significant to you.

The point of using the MA along with other candlestick and technical signals is that historically these price points have been followed by the majority of technical traders.

So, due to crowd psychology, it becomes a self fulfilling prophecy.

In order to get the latest updates on Financial Markets visit stockedge.

Tags: englishmoving averagetechnical analysis
ShareTweetSend
Get Kotak Offer Get Kotak Offer Get Kotak Offer
Previous Post

NISM Certification – Everything you should know about NISM

Next Post

5 Reasons Why A Country Without Financial Literacy Is Destined To Doom

Elearnmarkets

Elearnmarkets

Elearnmarkets (ELM) is a complete financial market portal where the market experts have taken the onus to spread financial education. ELM constantly experiments with new education methodologies and technologies to make financial education effective, affordable and accessible to all. You can connect with us on Twitter @elearnmarkets.

Related Posts

Understand Slippage in Trading
Technical Analysis

What is Slippage in Trading? Meaning & Examples

March 28, 2025
302
Breakout trading strategies
Technical Analysis

Top 5 Breakout Trading Strategies

March 12, 2025
1.1k
5 stocks for today
Technical Analysis

5 Stocks to Buy Today That Could Beat the NIFTY in 2025!

May 5, 2025
400
Image describing What is marginal trading facility
Technical Analysis

 What is a Margin Trading Facility? Advantages & Risks

April 4, 2025
662

Leave a Reply Cancel reply

Your email address will not be published. Required fields are marked *

Disclaimer

Elearnmarkets (Kredent InfoEdge Pvt. Ltd.) is a SEBI-registered Research Analyst (RA) entity (SEBI Registration No.: INH300007493). The information provided in this article is for educational and informational purposes only and should not be considered as an offer to buy or sell any securities or investment products.

The stocks, securities, and investment instruments mentioned herein are not recommendations under SEBI (Research Analysts) Regulations, 2014. Readers are advised to conduct their own due diligence and seek independent financial advice before making any investment decisions.

Investments in securities markets are subject to market risks. Please read all related documents carefully before investing. Investing in Equity Shares,
Derivatives, Mutual Funds, or other instruments carry inherent risks, including potential loss of capital. Elearnmarkets (Kredent InfoEdge Pvt. Ltd.) does not provide any guarantee or assurance of returns on any investments. Past performance is not indicative of future performance.

Elearnmarkets Logo

Follow Us

Facebook-f X-twitter Instagram Linkedin-in Youtube Telegram

Register on Elearnmarkets

Continue your financial learning by creating your own account on Elearnmarkets.com

Register Free Account

Download App

Playstore logo
Download on app store

Categories

  • Basic Finance
  • Derivatives
  • Financial Planning
  • Fundamental Analysis
  • Technical Analysis
  • Mutual Funds
  • Miscellaneous

Popular On Elearnmarkets

  • Market Superheroes:
  • Vivek Bajaj
  • Chetan Panchamia
  • Ashish Kyal
  • Premal Parekh
  • Abhijit Paul
  • Jegan
  • Sivakumar Jayachadran
  • Jyoti Budhia
  • Vivek Gadodia
  • Vishal Mehta
  • Piyush Chaudhry
  • Santosh Pasi
  • Gomathi Shankar
  • Market Superheroes:
  • Vivek Bajaj
  • Chetan Panchamia
  • Ashish Kyal
  • Premal Parekh
  • Abhijit Paul
  • Jegan
  • Sivakumar Jayachadran
  • Jyoti Budhia
  • Vivek Gadodia
  • Vishal Mehta
  • Piyush Chaudhry
  • Santosh Pasi
  • Gomathi Shankar
  • Courses:​
  • Options Trading
  • Dow Theory
  • Momentum Trading
  • Stock Investing
  • Harmonic Chart Patterns
  • Algo Trading
  • Elliot Wave Theory
  • Advanced Excel
  • Cryptocurrency
  • NSE Certification Course
  • Courses:​
  • Options Trading
  • Dow Theory
  • Momentum Trading
  • Stock Investing
  • Harmonic Chart Patterns
  • Algo Trading
  • Elliot Wave Theory
  • Advanced Excel
  • Cryptocurrency
  • NSE Certification Course
  • Webinars:
  • Bank Nifty Scalping
  • Intraday Trading Strategies
  • Options Trading Strategies
  • Options selling
  • Price Action
  • Relative Strength
  • Tax Planning
  • Options Buying
  • Growth Stocks
  • Portfolio Management
  • Risk Management
  • Renko Charts
  • Crude Oil
  • Traders Psychology
  • Moving Average
  • Multibagger Stocks
  • Free Learning Modules:
  • Intraday Trading
  • Options Scalping
  • Swing Trading
  • Financial Modelling
  • RSI Indicator
  • Bollinger Bands
  • Pricing of Futures
  • Personal Finance
  • Initial Public Offerings (IPO)
  • Value Investing
  • Technical Indicators
  • Candlesticks
  • Chart Patterns
  • Option Greeks
  • ELSS Funds
  • Banking and Insurance
  • Real Estate
  • Gold
  • Book Summaries:
  • Rich Dad Poor Dad
  • Psychology of Money
  • The Intelligent Investor
  • The Richest Man in Babylon
  • Think and Trade Like a Champion
  • Value Investing and Behavioural Finance
  • Trading in the Zone
  • Learn to Earn
  • Book Summaries:
  • Rich Dad Poor Dad
  • Psychology of Money
  • The Intelligent Investor
  • The Richest Man in Babylon
  • Think and Trade Like a Champion
  • Value Investing and Behavioural Finance
  • Trading in the Zone
  • Learn to Earn
  • Tools:
  • CAGR Calculator
  • SIP Calculator
  • eLearnOptions
  • Future Value Calculator
  • Present Value Calculator
  • Atal Pension Yojana
  • Cost of Delay Calculator
  • Become a Crorepati
  • Tools:
  • CAGR Calculator
  • SIP Calculator
  • eLearnOptions
  • Future Value Calculator
  • Present Value Calculator
  • Atal Pension Yojana
  • Cost of Delay Calculator
  • Become a Crorepati

© 2025 Elearnmarkets. All Rights Reserved

  • Visit Elearnmarkets
  • Courses
  • Webinars
  • Financial Guides
  • Get Free Counselling
  • Visit Elearnmarkets
  • Courses
  • Webinars
  • Financial Guides
  • Get Free Counselling

Download Our App

No Result
View All Result
  • Article Categories
    • Basic Finance
    • Derivatives
    • Financial Planning
    • Fundamental Analysis
    • Technical Analysis
    • ETFs & Mutual Funds
    • Marketshala
    • Miscellaneous
  • Language
    • Hindi
    • Bengali
    • English
  • Courses
  • Webinars
  • Stories
Get Free Course

© 2024 Elearnmarkets All Rights Reserved

A Handbook of Technical Analysis
To start your trading journey as a seasoned technical analyst
Download Guide For FREE
Trading Mentorship Program