Elearnmarkets - Financial Market Learning
  • Courses
  • Webinars
  • Stories
  • Language
    • English
    • Hindi
    • Bengali
No Result
View All Result
Get Free Course
  • Basic Finance
  • Derivatives
    • Futures
    • Options
  • Financial Planning
  • Fundamental Analysis
  • Technical Analysis
  • Mutual Funds
  • Marketshala
  • Miscellaneous
Elearnmarkets - Learn Stock Market, trading, investing for Free
  • Courses
  • Webinars
  • Stories
  • Language
    • English
    • Hindi
    • Bengali
No Result
View All Result
Get Free Course
Elearnmarkets - Learn Stock Market, trading, investing for Free
No Result
View All Result
Home Technical Analysis
Moving Average Indicator – a technical tool for traders 1

Moving Average Indicator – a technical tool for traders

Elearnmarkets by Elearnmarkets
March 13, 2024
in Technical Analysis
Reading Time: 11 mins read
2
9.2k
VIEWS
Share on FacebookShare on XShare on WhatsApp

Hindi: आप इस लेख को हिंदी में भी पढ़ सकते है|

In technical analysis, price is everything. However, while trading with the help of technical analysis, the price alone is not enough to understand the market sentiment. To get a better picture of the market, traders use different types of indicators and oscillators like moving average indicators, Relative Strength Index(RSI), Stochastic, etc.

In this article, we will discuss the moving average indicator. The indicator not only helps a trader to understand the market situation but also helps to make better trading decisions.

There are different types of moving averages in the field of technical analysis. Let’s discuss each one.

Table of Contents

  • Simple Moving Average
  • Weighted Moving Average
  • Exponential Moving Average
  • The 5-9 Day Short Term Moving Average Rule
  • How do 50-day, 100-day, and 200-day moving averages differ?
  • Bottomline:
  • Frequently Asked Questions (FAQs)
    • What is a moving average (MA)?
    • How does a moving average work?
    • What is the significance of using moving averages in trading?

Simple Moving Average

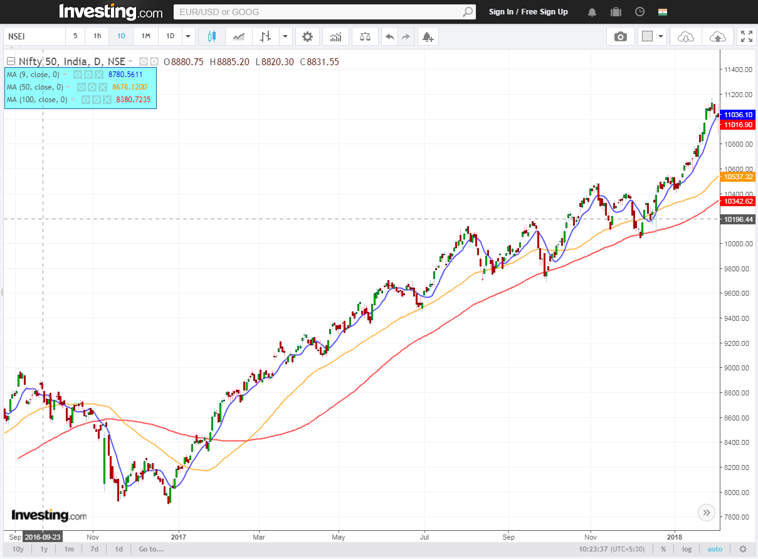
Simple Moving Average indicator or SMA is a moving average which is calculated by adding the closing price of security prices for the last n-periods and dividing it by the total number of time periods.

For example, suppose we want to calculate the 9 periods SMA of a security price.

First, we will add the last 9 Days closing price of the security and then it will be divided by the 9 periods.

Calculation for 9 periods SMA:

(P9+P8+P7+P6…. +P1)/9

Where,

P=Price

P9= Price 9days ago
simple moving average

SMA is a Technical indicator represented by a line. It is directly plotted on the security price. The periods can be changed at the trader’s choice.

For shorter-term SMA, we can use 5,9,13, etc. For the Medium term, we can use 20,34,50, and for the longer term, 100,200. 

Weighted Moving Average

Sometimes technical traders feel that only the closing or opening price is not enough for calculating a moving average, and this was one of the most important reasons behind the introduction of the Weighted Moving Average indicator.

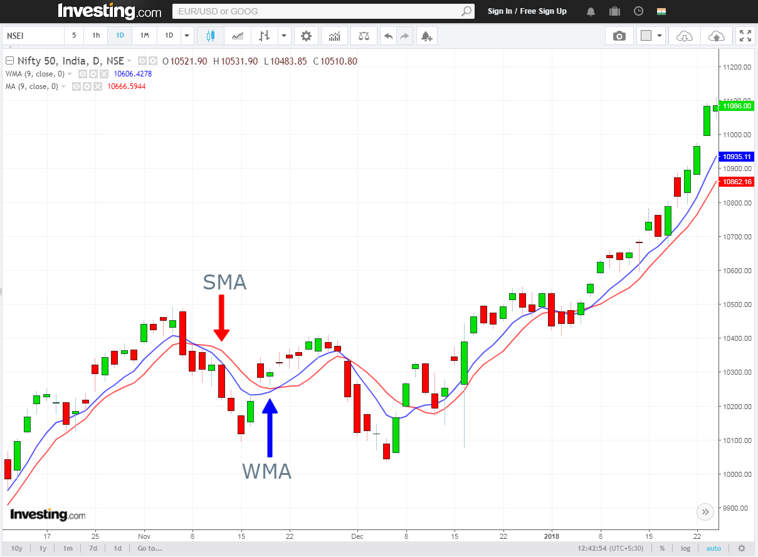
Weighted Moving Averages (WMA) concentrate more on recent price action. Like SMA, they are also plotted directly on the security price.

While calculating SMA, we have seen that equal weightage is given to individual prices. But, in the case of WMA, it is not the same. Here the latest price gets the maximum importance or weightage.

Suppose we want to calculate the 9 periods WMA of a security price. Then, the recent price will get the maximum importance compared to previous prices. In this way, the last day’s price (9 periods ago) will get the minimum weightage.

Suggested Read: How to use moving average for trading on different timeframes?

Calculation of a 9 periods WMA –

WMA = (P1 * 9) + (P2 * 8) + (P3 * 7) +…….+ (P9 * 1) / (9+8+7+6+5 + 4+ 3 + 2 + 1)

where,

P1= Recent price of the security

P2= Price one day ago.

P3= Price two days ago etc.
weighted moving average

Exponential Moving Average

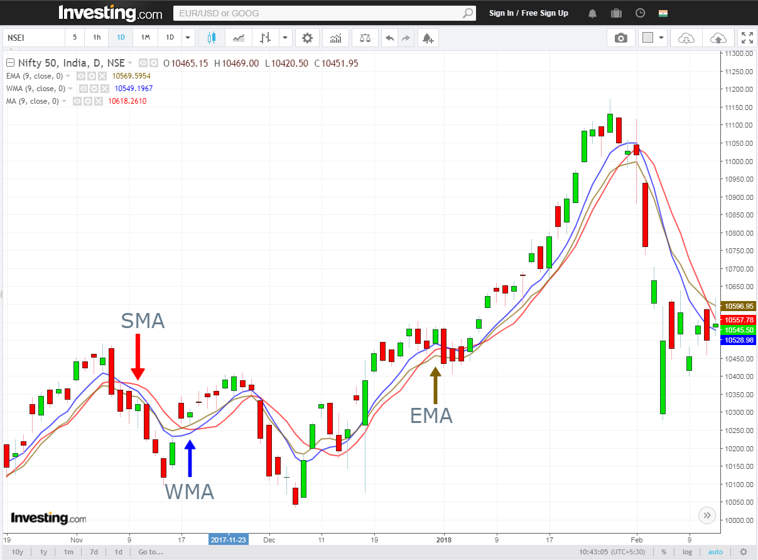
Exponential Moving Average or EMA is quite similar to the WMA. EMA also gives more weight to recent prices. Like other moving averages, EMA is also plotted directly on the prices.

The main difference is in the calculation of this moving average indicator. While calculating the EMA, the decreasing rate of one price to another is not same.  Price decreases exponentially.

Learn in just 2 hours : Building Long & Short term trading strategies with Moving Averages

There are three steps required to calculate the EMA.

1> Finding out the SMA

2>Calculating the Weighting multiplier

3>Finding out the EMA

For, SMA = (Sum of closing price)/Number of time periods

Weighting multiplier= (2 / (Time period + 1))

and then,

EMA= Closing price-EMA (previous day)) x Weighting multiplier + EMA (previous day)
exponential moving average

Calculating the EMA is a little bit complicated, but thanks to the advanced charting system, there is no need to calculate it manually or on your own. The EMA is calculated automatically, and it is easily available in most charting platforms.

The 5-9 Day Short Term Moving Average Rule

5 and 9 EMA are both considered short-term moving averages. These moving averages follow prices more closely relative to a medium or longer-term moving average.

It is pretty obvious that EMA 5 will fluctuate more than the 9EMA according to the price movement.

This combination of EMAs is very popular among traders. They help traders by providing early trade signals and good entry and exit points.

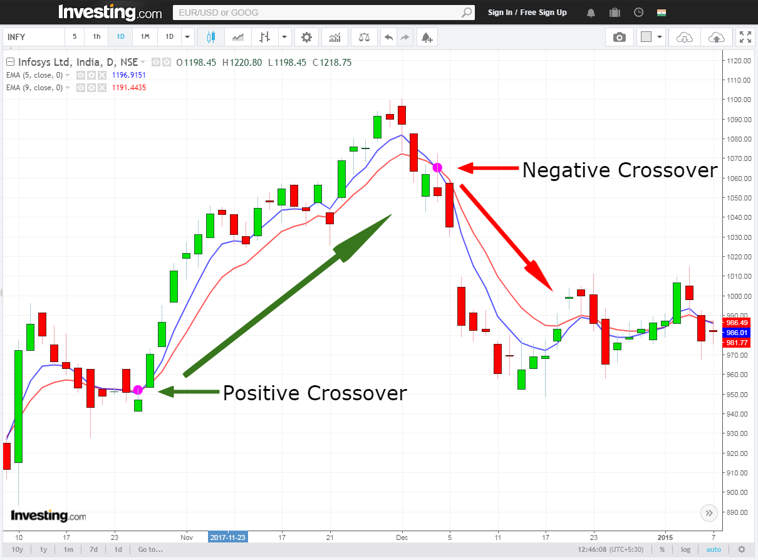
Signals occur when short-term EMA (5) crosses the longer-term EMA (9). Depending upon the nature of the crossover, buy and sell signals are generated.

If the EMA 5 crosses the 9 EMA from below, it will generate a positive crossover signal, and according to that, a buy position can be taken. The opposite happens when the 5 EMA crosses the 9 EMA from above. This crossover is called a negative crossover, and depending on that signal, a trader can take a short position.

Also Read: How to trade with Rate of change (ROC) Indicator Strategy?

Below are few examples of positive and negative crossover.
positive negative crossover

This one-day chart of Infosys showing a positive and negative crossover.
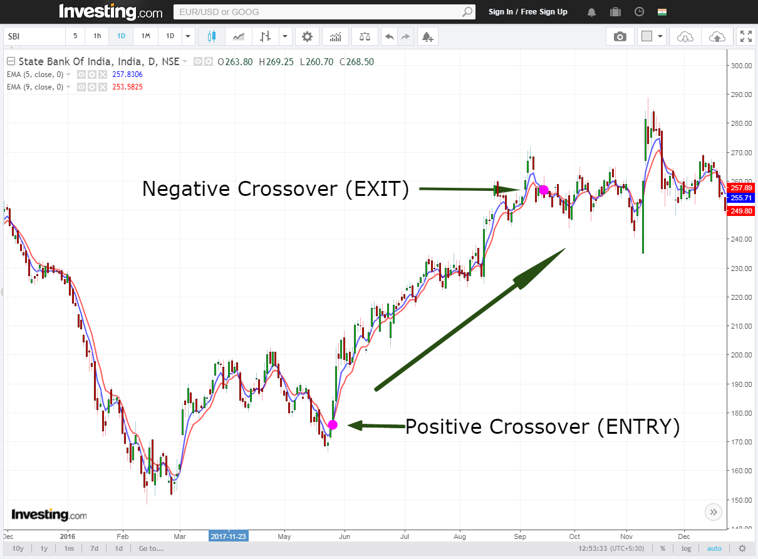
sbi positive crossover

This is the daily chart of SBI. A positive crossover happened during the month of May-June and the stock moved nearly 80points in the upward direction.
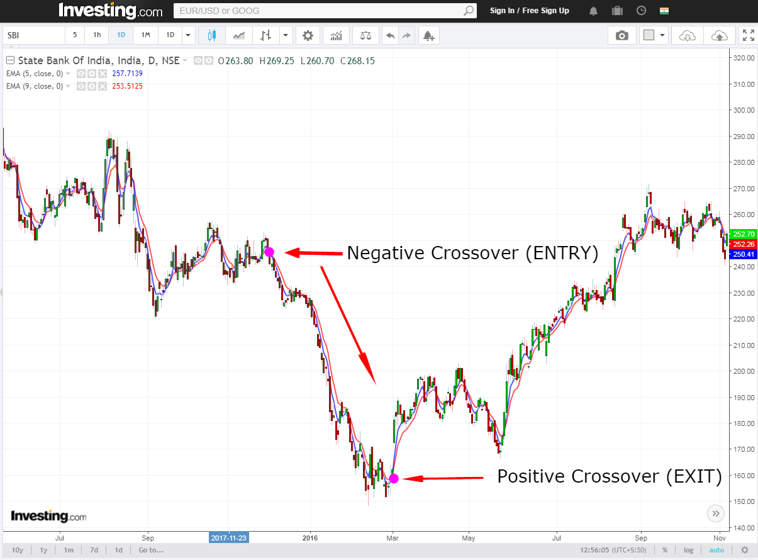
sbi negative crossover

Another example also from SBI. This negative crossover happened in the daily chart. This time also it gave nearly 80 points downward move.

Drawbacks:

1>Due to the high fluctuation of these EMAs they often end up generating false trade signals.

2> Does not work well in choppy market condition.

3> Signals generates very frequently.

It is advisable that do not trade only using these two EMAs. Take the other indicators like RSI and stochastics for better trading decisions.

How do 50-day, 100-day, and 200-day moving averages differ?

These are the most important SMAs in technical analysis. SMA 50 is considered as a medium-term moving average SMA but 100 SMA and 200 SMA both are considered as long-term moving average.

The main difference lies in the calculation of these SMAs. SMA 50 requires 50 time periods to calculate, in case of 100 MA and 200 MA 100time periods and 200 time periods are required.

For short-term trades, 50SMA plays an important role and it is considered as a basic resistance and support line. In longer-term time frame, 100 SMA and 200SMAs both play the same role but weightage of these lines are greater than 50 SMA line. It is always better to take a trade at these levels because the price in these level is generally less risky to enter because they are good support levels.

Also Read : A comprehensive study on Support and Resistance

For SMA 50 it is constructed by using the 50 trading day’s closing price. So basically traders see it as a line which is representing 10weeks’ average closing price. Similarly, for SMA 100 line and SMA 200 line represents the average closing price of 20 weeks and 40 weeks.
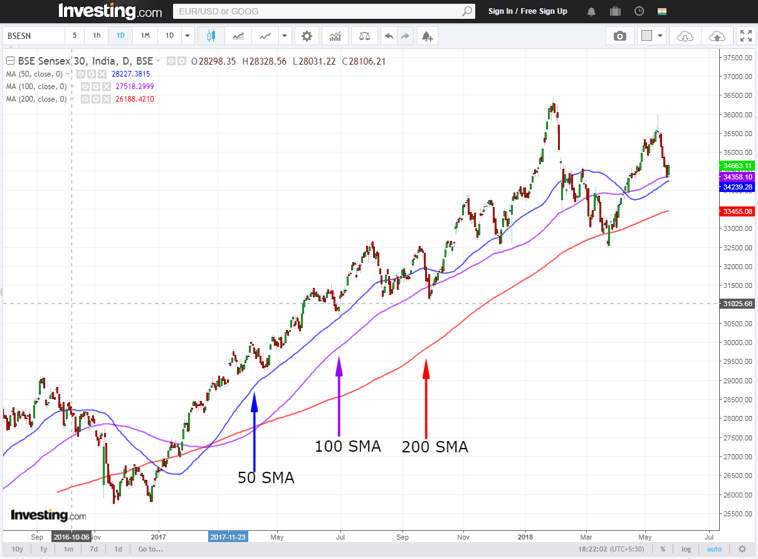
50 100 200 sma

You can also watch the video below to Learn a Trading Strategy using Moving Average in the Stock Market :

Bottomline:

Moving average indicator is very useful. They suggest good entry and exit points while trading. The simplicity of this indicator makes it popular among the traders. But it has some drawbacks too. In a highly volatile market condition, short-term MAs generate false trade signals which lead to a loss. Moving Average does not work well in choppy market condition and it is advisable to not to use shorter or medium term MAs during that period.

Every indicator has different drawbacks but it is also true that they work well if they are combined with other indicators and oscillators. RSI and Stochastics are one of the most commonly used indicators and oscillator to combine with a moving average indicator.

Frequently Asked Questions (FAQs)

What is a moving average (MA)?

A series of averages of various subsets of the entire data set are created statistically to examine data points, and this process is known as a moving average. It smoothes price data in financial markets so that trends over a given time span can be found.

How does a moving average work?

Using moving averages, one may determine the average price of an asset or security over a certain time frame, like 10, 50, or 200 days. A dynamic average is produced as the computation advances and older data points are removed in favor of newly available data points.

What is the significance of using moving averages in trading?

Moving averages smooth out short-term swings to show the underlying direction of price movements, which aids traders in identifying trends. They also serve as dynamic levels of resistance or support, suggesting possible locations of entry or departure.
Tags: moving averagemoving average indicatortechnical analysistechnical tool
ShareTweetSend
Get Kotak Offer Get Kotak Offer Get Kotak Offer
Previous Post

How to Take Control of Your Finances- Budgeting 101

Next Post

Understanding Bear Call Spread Strategy

Elearnmarkets

Elearnmarkets

Elearnmarkets (ELM) is a complete financial market portal where the market experts have taken the onus to spread financial education. ELM constantly experiments with new education methodologies and technologies to make financial education effective, affordable and accessible to all. You can connect with us on Twitter @elearnmarkets.

Related Posts

Understand Slippage in Trading
Technical Analysis

What is Slippage in Trading? Meaning & Examples

March 28, 2025
297
Breakout trading strategies
Technical Analysis

Top 5 Breakout Trading Strategies

March 12, 2025
1.1k
5 stocks for today
Technical Analysis

5 Stocks to Buy Today That Could Beat the NIFTY in 2025!

May 5, 2025
398
Image describing What is marginal trading facility
Technical Analysis

 What is a Margin Trading Facility? Advantages & Risks

April 4, 2025
661

Comments 2

  1. Naranbhai Kalaria says:
    7 years ago

    Know more about INTRADAY trading strategies.

    Reply
  2. Naranbhai Kalaria says:
    7 years ago

    Learn about INTRADAY trading.

    Reply

Leave a Reply Cancel reply

Your email address will not be published. Required fields are marked *

Disclaimer

Elearnmarkets (Kredent InfoEdge Pvt. Ltd.) is a SEBI-registered Research Analyst (RA) entity (SEBI Registration No.: INH300007493). The information provided in this article is for educational and informational purposes only and should not be considered as an offer to buy or sell any securities or investment products.

The stocks, securities, and investment instruments mentioned herein are not recommendations under SEBI (Research Analysts) Regulations, 2014. Readers are advised to conduct their own due diligence and seek independent financial advice before making any investment decisions.

Investments in securities markets are subject to market risks. Please read all related documents carefully before investing. Investing in Equity Shares,
Derivatives, Mutual Funds, or other instruments carry inherent risks, including potential loss of capital. Elearnmarkets (Kredent InfoEdge Pvt. Ltd.) does not provide any guarantee or assurance of returns on any investments. Past performance is not indicative of future performance.

Elearnmarkets Logo

Follow Us

Facebook-f X-twitter Instagram Linkedin-in Youtube Telegram

Register on Elearnmarkets

Continue your financial learning by creating your own account on Elearnmarkets.com

Register Free Account

Download App

Playstore logo
Download on app store

Categories

  • Basic Finance
  • Derivatives
  • Financial Planning
  • Fundamental Analysis
  • Technical Analysis
  • Mutual Funds
  • Miscellaneous

Popular On Elearnmarkets

  • Market Superheroes:
  • Vivek Bajaj
  • Chetan Panchamia
  • Ashish Kyal
  • Premal Parekh
  • Abhijit Paul
  • Jegan
  • Sivakumar Jayachadran
  • Jyoti Budhia
  • Vivek Gadodia
  • Vishal Mehta
  • Piyush Chaudhry
  • Santosh Pasi
  • Gomathi Shankar
  • Market Superheroes:
  • Vivek Bajaj
  • Chetan Panchamia
  • Ashish Kyal
  • Premal Parekh
  • Abhijit Paul
  • Jegan
  • Sivakumar Jayachadran
  • Jyoti Budhia
  • Vivek Gadodia
  • Vishal Mehta
  • Piyush Chaudhry
  • Santosh Pasi
  • Gomathi Shankar
  • Courses:​
  • Options Trading
  • Dow Theory
  • Momentum Trading
  • Stock Investing
  • Harmonic Chart Patterns
  • Algo Trading
  • Elliot Wave Theory
  • Advanced Excel
  • Cryptocurrency
  • NSE Certification Course
  • Courses:​
  • Options Trading
  • Dow Theory
  • Momentum Trading
  • Stock Investing
  • Harmonic Chart Patterns
  • Algo Trading
  • Elliot Wave Theory
  • Advanced Excel
  • Cryptocurrency
  • NSE Certification Course
  • Webinars:
  • Bank Nifty Scalping
  • Intraday Trading Strategies
  • Options Trading Strategies
  • Options selling
  • Price Action
  • Relative Strength
  • Tax Planning
  • Options Buying
  • Growth Stocks
  • Portfolio Management
  • Risk Management
  • Renko Charts
  • Crude Oil
  • Traders Psychology
  • Moving Average
  • Multibagger Stocks
  • Free Learning Modules:
  • Intraday Trading
  • Options Scalping
  • Swing Trading
  • Financial Modelling
  • RSI Indicator
  • Bollinger Bands
  • Pricing of Futures
  • Personal Finance
  • Initial Public Offerings (IPO)
  • Value Investing
  • Technical Indicators
  • Candlesticks
  • Chart Patterns
  • Option Greeks
  • ELSS Funds
  • Banking and Insurance
  • Real Estate
  • Gold
  • Book Summaries:
  • Rich Dad Poor Dad
  • Psychology of Money
  • The Intelligent Investor
  • The Richest Man in Babylon
  • Think and Trade Like a Champion
  • Value Investing and Behavioural Finance
  • Trading in the Zone
  • Learn to Earn
  • Book Summaries:
  • Rich Dad Poor Dad
  • Psychology of Money
  • The Intelligent Investor
  • The Richest Man in Babylon
  • Think and Trade Like a Champion
  • Value Investing and Behavioural Finance
  • Trading in the Zone
  • Learn to Earn
  • Tools:
  • CAGR Calculator
  • SIP Calculator
  • eLearnOptions
  • Future Value Calculator
  • Present Value Calculator
  • Atal Pension Yojana
  • Cost of Delay Calculator
  • Become a Crorepati
  • Tools:
  • CAGR Calculator
  • SIP Calculator
  • eLearnOptions
  • Future Value Calculator
  • Present Value Calculator
  • Atal Pension Yojana
  • Cost of Delay Calculator
  • Become a Crorepati

© 2025 Elearnmarkets. All Rights Reserved

  • Visit Elearnmarkets
  • Courses
  • Webinars
  • Financial Guides
  • Get Free Counselling
  • Visit Elearnmarkets
  • Courses
  • Webinars
  • Financial Guides
  • Get Free Counselling

Download Our App

No Result
View All Result
  • Article Categories
    • Basic Finance
    • Derivatives
    • Financial Planning
    • Fundamental Analysis
    • Technical Analysis
    • ETFs & Mutual Funds
    • Marketshala
    • Miscellaneous
  • Language
    • Hindi
    • Bengali
    • English
  • Courses
  • Webinars
  • Stories
Get Free Course

© 2024 Elearnmarkets All Rights Reserved

A Handbook of Technical Analysis
To start your trading journey as a seasoned technical analyst
Download Guide For FREE
Trading Day 2025