Technical analysis refers to the analysing of past data on the price movement and forecasting future price movements.
Technical Analysis is a research technique that is used for identifying trading opportunities in the market which depends on market participants’ actions.
The actions of market participants can be analysed by the technical charts, indicators and patterns.
These chart patterns are formed within these technical charts and convey a certain message. Traders need to identify these patterns and make trading decisions.
The trading decisions should include when to enter, or exit the trade or where to put a stop-loss.
If you are worried about how to do that, then below is a guide that will help you in understanding how to do technical analysis on stocks:
Technical Analysis for Beginners
First, let us discuss 38 terms used in technical analysis-
- Accumulation-A period when buyers start to appear and start buying assets, usually from struggling sellers. It can be viewed as a time when shares are absorbed by growing demand over time, potentially having a positive impact on price, or as a time when prices stabilise after a decrease. This might be seen as the start of a bull market or possibly the first phase of a bull trend.
- Advance-Decline Line- Divide the number of stocks rising by the number of stocks falling during a specific time frame.
- Apex-A peak or the point where two trendlines converge, with the implication that a new trend may develop as prices approach the point of intersection.
- Arbitrage-Simultaneous purchasing in one market while selling in another in order to profit from price disparities. The acquisition of the acquiree and sale of the acquirer as it relates to shares are two possible transactions. Purchasing one futures contract and then selling a similar contract in order to take advantage of market inefficiencies.
- Bar Chart-A price/time chart with time intervals on the horizontal axis and bars representing high, low, and close data is shown. Usually, behind the relevant price data at the bottom of the chart, volume is also shown as vertical bars.
- The base-Accumulation period (see above), is also known as the “Bottom.” Can also be referred to as a pricing point when purchasers keep making purchases to support the market.
- Bear Market-An extended period, frequently lasting a year or longer, during which the price of securities is generally declining.
- Bear Trap- A deceptive downward movement that doesn’t signal the start of a new downturn but rather the last reaction before a long gain, thereby “trapping the bears.”
- Breadth-Total number of rising versus falling equities. Breadth is positive when increases outweigh decreases; when the opposite is true, breadth is negative.
- Breakout-When a stock’s price or volume surpasses its prior high or low (or a level of support or resistance) or any other set standard. Likewise known as “Penetration.”
- Bull Market-An extended period, usually lasting a year or longer, during which time the price of securities has often increased.
- Bull Trap-A fake upward movement that doesn’t signal the start of a new upswing but rather the last rise before a long collapse, thereby “trapping the bulls.” A powerful rise during a “Bear Market” that deceives purchasers into thinking the market is turning upward is known as a bull trap.
- Climax-(Climatic highpoint or low point). abrupt trend reversal characterised by significant volatility and high relative volume.
- Confirmation-At the same time, two or more trends or momentum indicators are extending their trends to new highs (or lows). The inference is that there is optimism about the future of the trend. Frequently used to compare the Dow Jones Transportation Average to the Dow Jones Industrial Average.
- Consolidation-A trend reversal that is expected to continue in the same direction after pausing. Usually taking place much sooner than stabilisation.
- Continuation Pattern-Consolidation phase, usually of brief length, that momentarily halts an upward or downward movement and prepares the way for a subsequent move in the same direction.
- Correction-A change that goes against a trend but won’t stop it or make it go the other way. typically takes more time than a reflex rally or reflex response.
- Distribution-Process wherein an increasing supply of a stock outpaces demand, which over time has a negative impact on the price of the stock. Although the price trend is often neutral throughout this time, there is frequently substantial volatility.
- Divergence-While another measure succeeds in continuing its trend to a new high (or low), the first measure fails to do so. Less confidence is expressed in maintaining the trend as a result. Frequently used to compare the Dow Jones Transportation Average to the Dow Jones Industrial Average.
- Extended-When a stock has moved past or beyond the limits of its trend and a consolidation is expected.
- Gap-When a stock’s daily high and low prices do not coincide with that stock’s daily high and low. Or, when an instrument trades above or below the high or low of the previous day and continues in that direction. It is known as a breakaway gap when a gap starts a trend; an exhaustion gap stops or reverses a trend; measurement gaps typically replicate the most recent move made before to the gap.
- Momentum Indicators-Momentum indicators are tools used to assess overbought and oversold market circumstances as well as the underlying strength or weakness of current market movements. They are typically tied to price and volume. The majority use moving averages.
- Moving Average-To smooth patterns of small variations, the average of price or volume over time is utilised.
- On-Balance Volume-A measure of cumulative volume, the direction of which depends on price movement; for example, a rising price suggests rising volume for that particular time period, whereas a falling price change indicates falling volume.
- Oscillator-An indicator that shifts to a positive or negative extreme near zero to gauge the strength of momentum (or sentiment) activity. The computations commonly employ moving averages.
- Overbought– The price has stretched to the upside too quickly.
- Oversold- The price has extended to the downside too quickly.
- Point and Figure- A chart type for tracking price activity without taking into account volume or time. A pure price charting technique is called Point and Figure.
- Relative Strength Line-A stock’s (or group’s) price performance line against a broad market index (or a group of stocks, or another stock). It is calculated by subtracting the cost of a sock from the market index for each time period, and then drawing a line through the ratios that are obtained.
- Resistance-A price level where it is anticipated that selling will outpace demand and momentarily halt or reverse an advance.
- Reversal Pattern-A distinctive pattern that marks the end of an upward or downward trend.
- Sentiment Indicators– Indicators that are employed in an effort to track shifts in the psychology of investors.
- Stop Loss- The price level that, if exceeded (on the upside in a short position; on the downside in a long position), negates a reversal pattern or breaks the trend. Typically, the point is slightly above a resistance level or just below a support level. Sometimes referred to as “Protection Point” or “Failsafe Point.“
- Support- A price point where buying is anticipated to pick up enough steam to momentarily halt or reverse a slide.
- Trendline- A line that, on a graph, links two or more points and symbolises the slope of movement.
- Volatility- Degree in intraday fluctuation, not necessarily correlated with price movement over time.
- Volume-Total trading activity in a stock or set of stocks over a certain time period is known as volume. It is typically shown as vertical bars at the bottom of a bar chart.
- Wedge– A pattern in which only slight advancement is made, such as rising tops and bottoms in an uptrend or falling tops and bottoms in a downtrend, and which typically heralds a trend reversal.
Now, we will understand what trends in technical analysis mean:
1. Identifying Uptrend and Downtrend
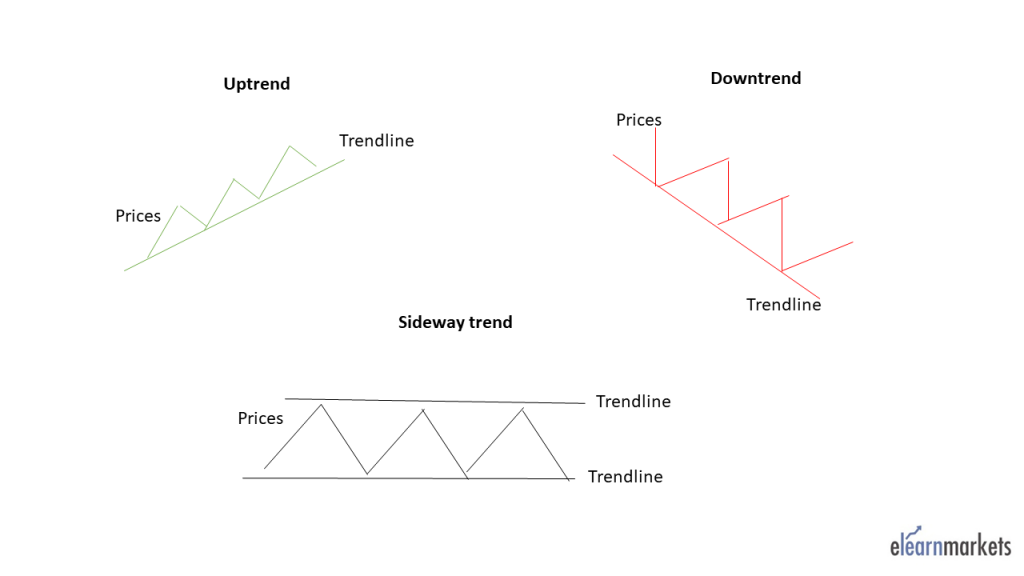
A trend in technical analysis can be defined as the direction of the market which can be of three types: uptrend, downtrend and sideways trend.
If the direction of the prices is upward, then that specific trend is said to be in an uptrend. On the other hand, if prices are moving down then it is in a downtrend.
When the prices are moving or fluctuating between two levels, then the prices of that stock are in a sideways trend.
An uptrend in the charts is characterized by the higher highs and higher lows of the prices.
A downtrend is characterized by the lower highs and lower lows of the prices. A sideways trend can be identified by drawing horizontal lines on the highs and lows of the price movement as shown below:
It is important to identify trends in the stock market as it tells us in what directions the prices are moving.
One should remember that profits in the stock market can be earned by trading with the trend. Novice traders should always try to trade along with the trend as it minimizes the risk
2. Identifying Support and Resistance Levels
It is important to identify levels of support and resistance as they indicate whether the prices are going to reverse or continue.
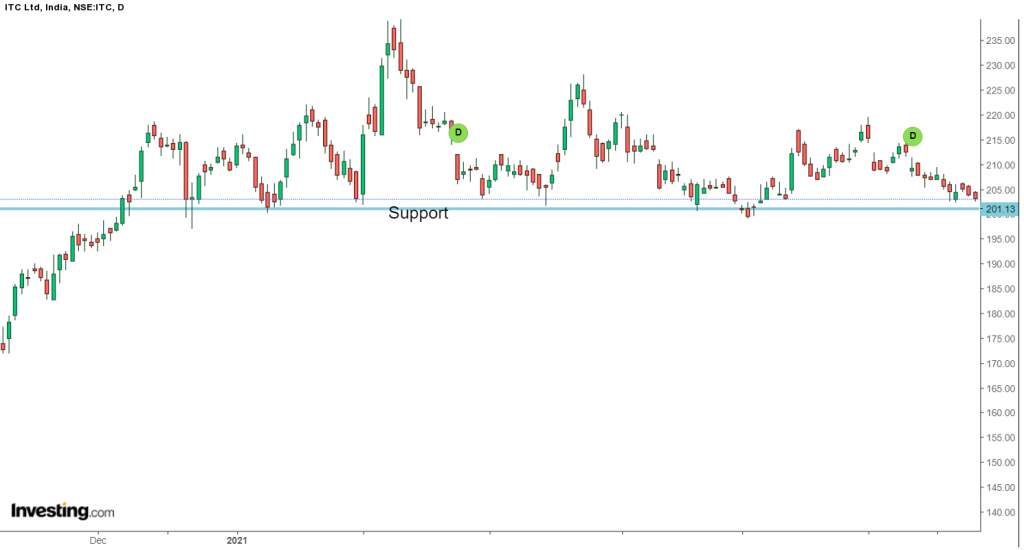
Support is an area where the demand for the stock is more than the supply for the stock, thus, when the prices reach this level, they can reverse to the upside.
Similarly, Resistance is an area where the supply for the stock is more than the demand for the stock, thus, when the prices reach this level, they can reverse to the downside.
The support level can be identified when the prices reverse from the same level to the upside at least more than two times.
The resistance level can be identified when the prices reverse from the same level to the downside at least more than two times.
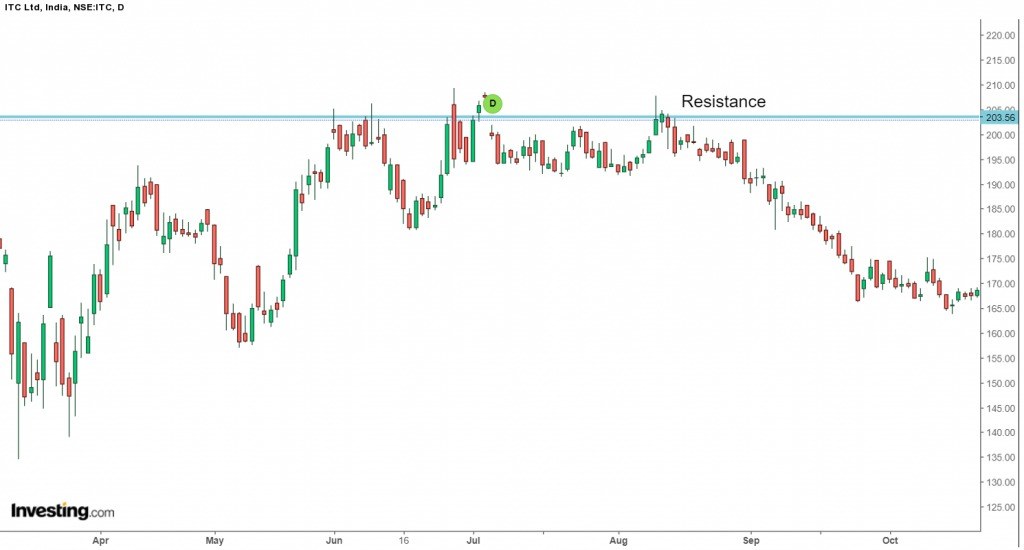
When the prices break out either from support or resistance, then the prices continue in either the directions.
3. Price and Volume Analysis
Volume analysis is a crucial technical indicator that every trader should look into as it confirms the ongoing price movement.
An increase in the volume in the ongoing uptrend and downtrend confirms that the trend will continue as shown below:
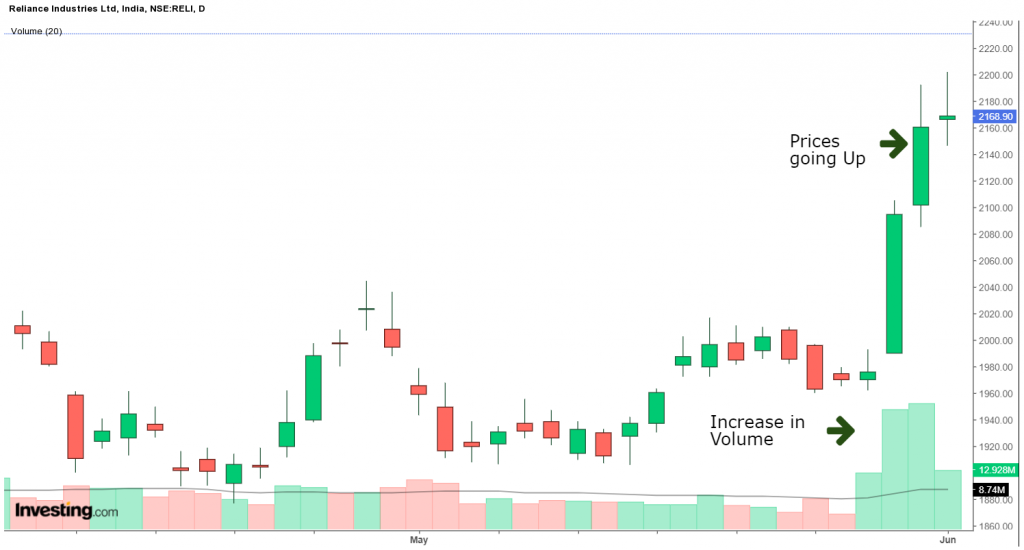
On the other hand, a decrease in the volume in the ongoing uptrend and downtrend indicates that the ongoing trend will soon reverse.
4. Analysing candlestick charts
The price actions can be analysed by the candlestick patterns which are formed on the candlestick charts.
Candlestick patterns are a group of candles that indicates whether the current trend is going to continue or reverse.
Advanced Technical Analysis-
We have discussed above the basics of technical analysis on stocks which all kinds of traders whether novice or experienced should consider while analysing the technical charts for trading in the stock market.
Now lets level up and understand Advanced Technical Analysis concepts.
Below are some of the advanced technical tools which traders should analyse along with the above technical tools.
1. Analysing major technical indicators
Technical indicators indicate and confirm the signals given by the price actions on the charts.
Technical indicators can be categorised into- trend, momentum, volume and volatility indicators.
Below are some of the popular technical indicators:
A. Moving Averages
Moving Averages are trend-following indicators that help us in identifying the ongoing trend, i.e., whether the stock is in an uptrend or downtrend.
Moving Averages are simply averages of the specific period, say 10, 20, 50, 100 or 200.
This indicator generates signals when the moving averages cross-price from above or below.
When the moving average crosses price from below then it generates a buy signal and when It crosses the prices from above then it generates a sell signal as shown below:
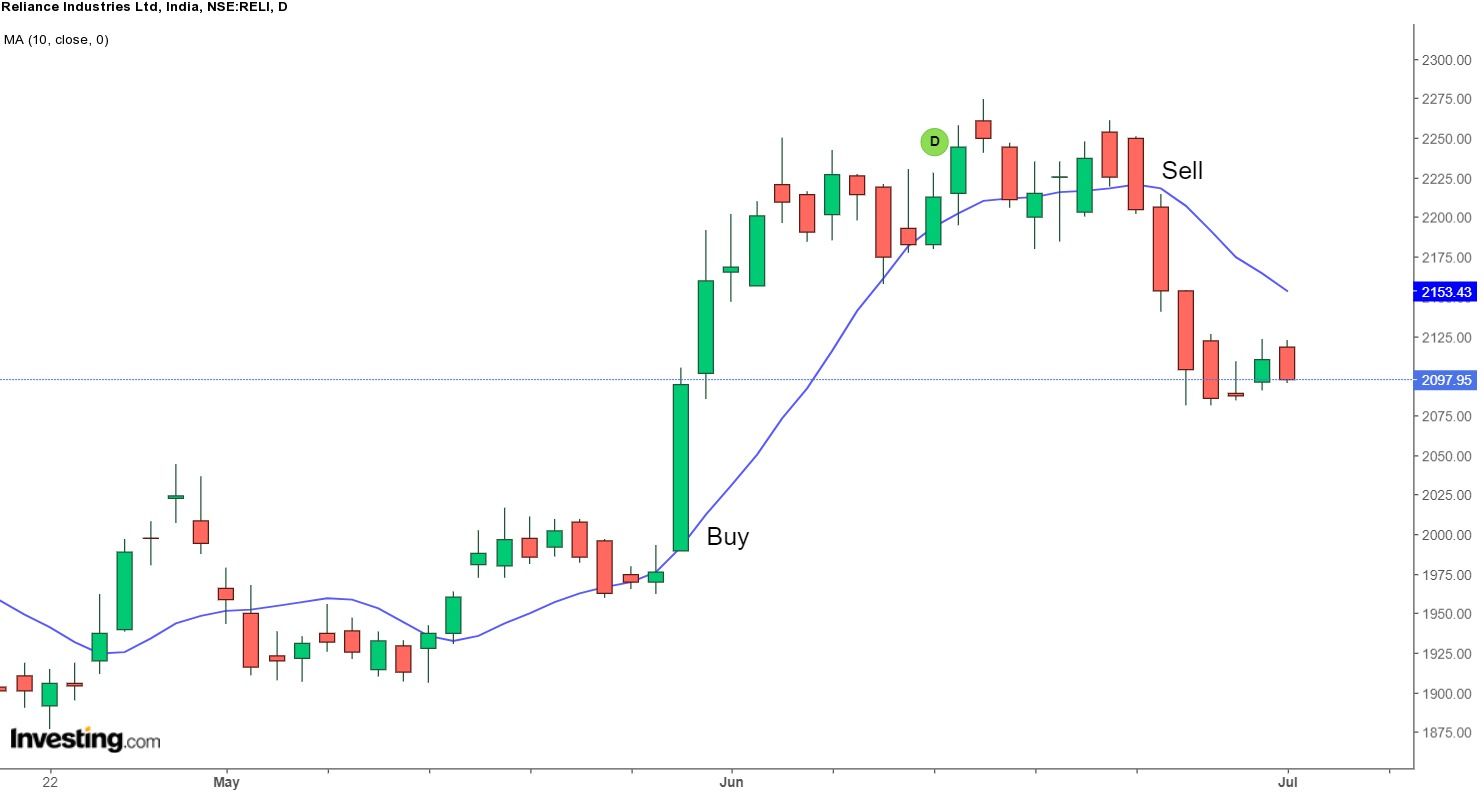
As it is a trend-following indicator, one should use them in the trending market as in the range-bound market, this indicator may give false signals.
B. Super Trend indicator:
Super Trend indicator mainly indicates the current direction of the price movement in a market which is trending either upwards or downwards.
This indicator is plotted in stock price charts for traders to analyse the current trend which is shown in red when prices fall and green when prices rise as shown below.
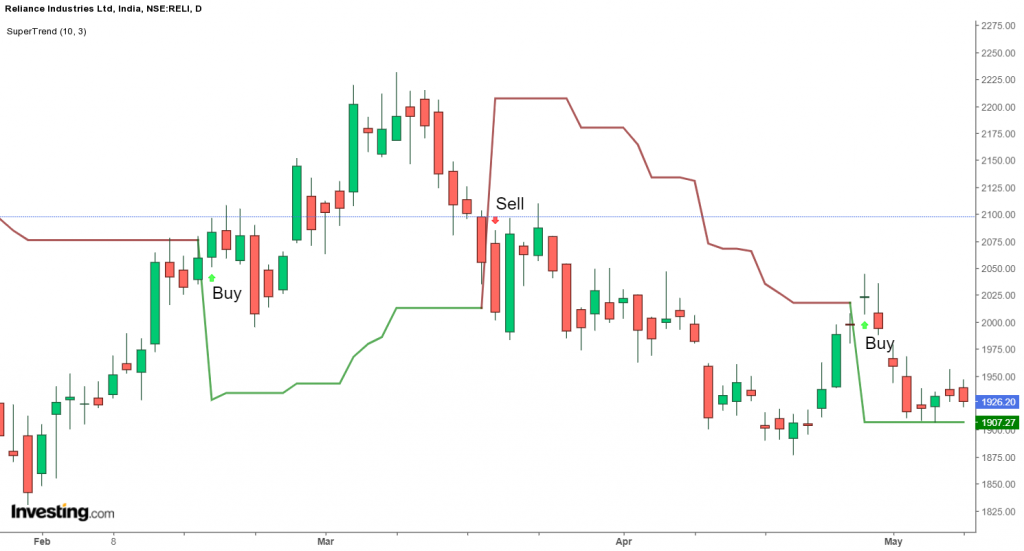
Traders can take trading decisions when this indicator reverses from an uptrend to a downtrend or vice versa.
C. Relative Strength Index:
The relative strength index (RSI) is a momentum indicator that measures the magnitude of a recent price change.
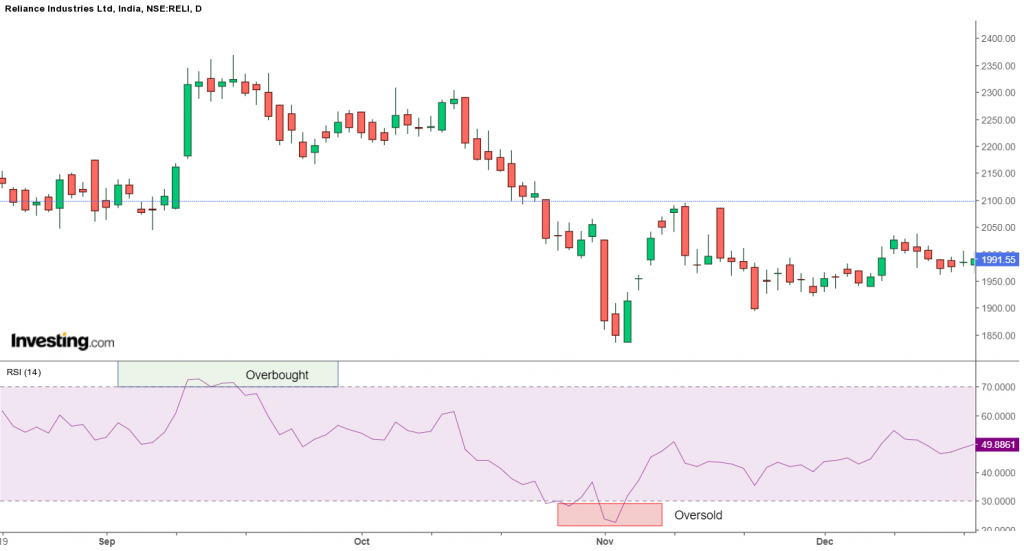
This indicator helps in evaluating the overbought or oversold conditions in the price of a stock.
RSI moves between the range of 0 and 100, when this indicator is above 70 then it indicates that the stock may reverse to the downside.
On the other hand, when the stock is below 30, it indicates that the stock may reverse to the upside as shown below:
D. Bollinger Bands:
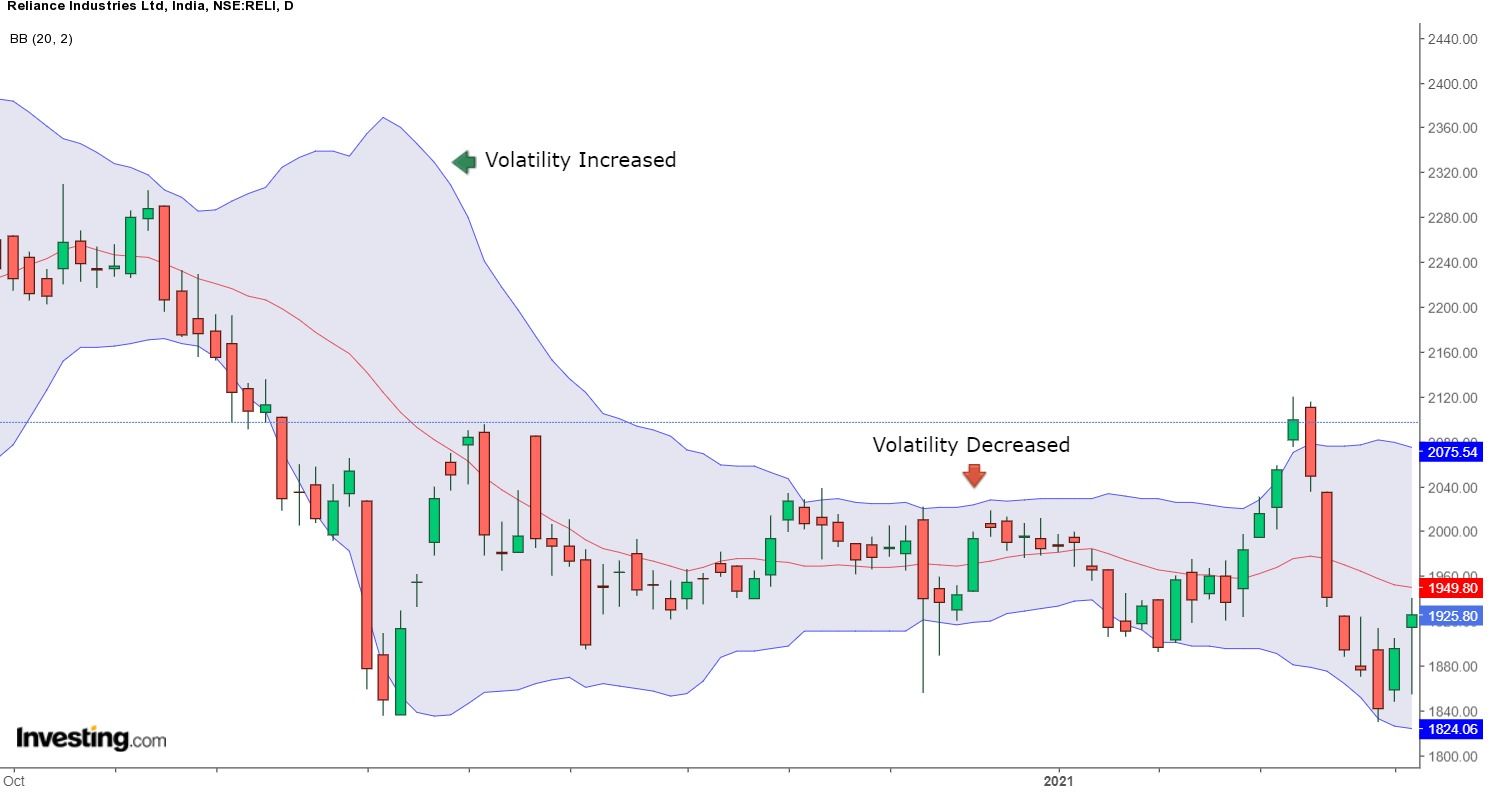
Bollinger Bands is a volatility indicator that indicates volatility in the stock. It consists of three bands, the lower band, the middle band and the upper band.
The middle band is the 20-period Simple Moving Average and the upper and lower bands are plus two and minus standard deviation of the middle band.
When the Bollinger band widens it shows that the volatility in the market has increased and when it contracts it shows that the volatility has decreased as shown below:
2. Identifying Trend Reversal through Candlesticks Patterns
As we have discussed above, the candlestick patterns help in identifying trend reversal. The candlesticks patterns can be divided into bullish and bearish reversal patterns:
A. Bullish candlestick patterns:
The Bullish candlestick patterns are formed after a downtrend and indicate a reversal to the uptrend.
The prior trend should be the downtrend when these candlesticks are formed. It can be made up of single or multiple candlesticks.
Some examples of Bullish candlestick patterns are Bullish Engulfing, Bullish Harami, Hammer, Inverted Hammer, Morning Star etc.
B. Bearish candlestick patterns:
The Bearish candlestick patterns are formed after an uptrend and indicate a reversal of the downtrend.
The prior trend should be the uptrend when these candlesticks are formed. It can be made up of single or multiple candlesticks.
Some the examples of Bearish candlestick patterns are Bearish Engulfing, Bearish Harami, shooting star, Hanging Man, Evening Star etc.
Learn in details about Candlestick Pattern Course from our online course on Candlestick.
How to learn Technical Analysis ?
Novice traders should first gain knowledge about technical analysis and start applying it for making trading decisions.
Below are some of the courses that novice traders can take:
1. Certificate in online technical Analysis:
Certification in Online Technical Analysis course is jointly certified by NSE Academy & Elearnmarkets (NSE Academy is a subsidiary of the National Stock Exchange of India).
With the help of this course, traders can learn about the different aspects of technical analysis which is used in trading.
2. Technical Analysis Made Easy
Technical Analysis Made Easy helps you understand historical price data, chart patterns, and indicators. It simplify the market analysis and elevate your trading skills.
Students will learn the technical analysis of stocks in the form of the art of working in Intraday and Positional Trades, a variety of techniques for understanding the market behaviour and psychology of a normal Investor/Trader and how the stock markets react to this, with the help of charts.
Bottomline
As we have discussed, novice traders should first gain knowledge about technical analysis before applying it in making trading decisions. One should note that the technical indicators should be used with price actions to confirm the signals given by them
Enjoyed the Blog? Join our advanced technical analysis course online to enhance your knowledge even further.
Frequently Asked Questions
What are the 4 basics of technical analysis?
The 4 Fundamental Technical Analysis Principles are-
- Range contraction and expansion are alternating in the markets.
- Reversal of the trend is less likely than its continuation.
- Trends can either roll over or reach a climax.
- Momentum comes before pricing.
What are the 2 types of technical analysis?
Chart patterns and technical (statistical) indicators are the two main categories of technical analysis. Technical analysts use chart patterns, a form of subjective technical analysis, to try and pinpoint regions of support and resistance on a chart.
What is technical analysis with example?
Investors utilise technical analysis as a trading strategy to find fresh investment opportunities. For instance, historical price and volume data are analysed and shown on graphic charts where trends, patterns, and technical indicators can be seen in order to forecast future price movements of stocks or other assets.
What is the basis of technical analysis?
Investors utilise technical analysis as a trading strategy to find fresh investment opportunities. For instance, historical price and volume data are analysed and shown on graphic charts where trends, patterns, and technical indicators can be seen in order to forecast future price movements of stocks or other assets.
Wish to learn more of some related topics? Then checkout some of our equity research courses online now!
For more stock-related queries visit web.stockedge.com
