| Table of Contents |
|---|
| Phases of Market Cycle |
| What are Indicators and Oscillators? |
| How to use Technical Analysis tools? |
| How to make Maximum Profit at Minimum Risk? |
| Bottomline |
Technical Analysis tools is a technique of analyzing securities using charts, statistical trends of price action, volume data and behavioral economics. There is a fundamental analysis which uses revenue, earnings, valuation or industry trends data to identify investment opportunities.
Technical Analysis is based on the principle that price or market action discounts every information and prices move in trends.
“You don’t make money by trading, you make it by sitting. It takes patience to wait for the trade to develop, for the opportunity to present itself. Let the market come to you, instead of chasing the market. Chart patterns are very accurate. They have proven their accuracy and predictability time and time again, but you have to wait for them to develop.” ― Fred McAllen, Charting and Technical Analysis
Phases of Market Cycle
All the market goes through some phases and these phases are cyclical in nature. While it is very difficult to know the beginning or end of any cycle, understanding market cycles is crucial to maximize trading or investing returns.
Four major phases of market cycles are discussed here.
Accumulation Phase
This phase occurs after the market has bottomed. Early movers, smart money managers, experienced traders, corporate insiders, and a few value investors buy in this phase. At this phase, valuations are attractive and market sentiment is still bearish.
Mark-Up Phase
At this stage, the market has been stable for a long time and is beginning to move higher. Technicians who are following the charts get in after seeing clear trends form. Other market followers who get hint of recovery from the news also join in this phase of the market.
At the end of this phase, the majority of the investors get in. Higher volumes are seen at this period. Valuations reaches peak at the end of this phase. While majority get in, the smart money and experienced investors unload.
Distribution Phase
In this phase of the market cycle sellers dominate. While in earlier phase the market sentiment was bullish, in this phase the market sentiment turns into mixed. Prices can often stay in a trading range.
This phase is an uncertain phase where it’s tough to take a decision. Share Valuations in this phase is usually on the higher side. In this phase also, the remaining lot of smart investors get out.
Mark-Down Phase
The last phase is unforgiving to the investors who still hold a position. Many stays invested in the hope that they will recover. Booking loss is not easy, so a lot of investors want to get out at least on their entry price.
A lot of them get out when their value has depreciated significantly and there is no hope of rebound. This co-incidentally is also the time when smart money gets in.
But money can be made in every phase if one were to analyze properly and predict the trend.
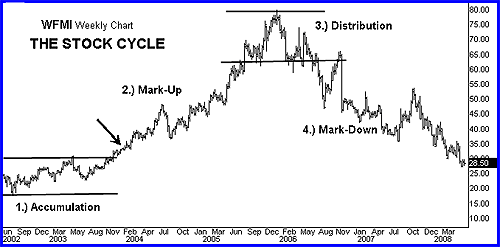
Image-source: Investopedia.com
What are Indicators and Oscillators?
Indicators are statistical approach to technical analysis tools. They represent money flow, trends, volatility and momentum, they act as proxy to the actual price movement and help analysts confirm the trend.
Indicators can be divided into two broad categories:
- Oscillator: Oscillators are range bound. For example: if the range of the indicator is from 0-100. 0 would mean an oversold position and 100 would mean an over-bought position.
- Non-bounded: They are not range bound.
Moving Average
Moving average is the average of a security price over a certain period of time. Two moving averages are commonly used, Simple Moving Average (SMA) is simple average of security prices and Exponential Moving Average(EMA) gives more weight to recent prices. Moving average helps smooth out the price action by averaging random price fluctuation.
Moving averages helps to identify trend direction and determine support and resistance levels. Moving average along with other technical indicators such as Moving Average Convergence Divergence (MACD) helps to analyse more information and indicate entry and exit level.
Relative Strength Index(RSI)
This technical analysis tools is an oscillator with range 0-100. It is a momentum indicator which helps to predict over-bought and over-sold positions. It is calculated for a period of a fixed no. of days (standard being 14 days).
When the indicator reaches 30 it is generally considered an over-sold condition and when it reaches 70 it is generally considered an over-bought position. By using the divergence (bullish or bearish) reading from the RSI graph, the signals become more reliable.
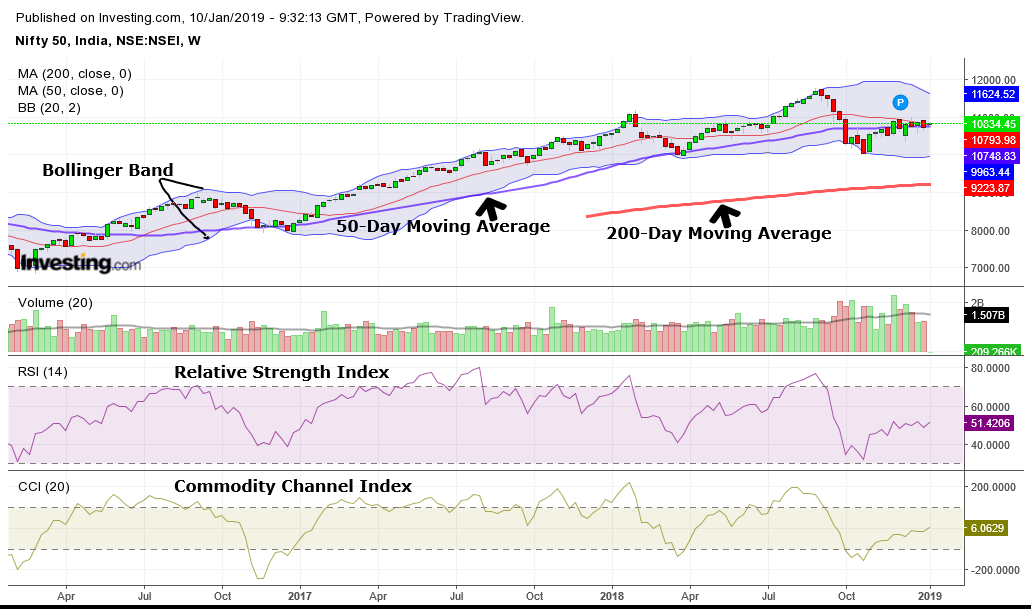
Commodity Channel Index
Although CCI was originally developed to identify cyclical turns in commodities, it can be applied to other indices and securities. It measures the current price level relative to an average price level over a certain time-period.
CCI is relatively high when prices are far above their average and is relatively low when prices are far below their average. In this way, CCI can be used to identify over-bought and over-sold levels.
Bollinger Bands
Bollinger Bands are volatility measurement bands. Volatility is based on the standard deviation, which changes as volatility changes. The bands widen when volatility increases and narrows when volatility decreases. They can be used to determine the strength of the trend.
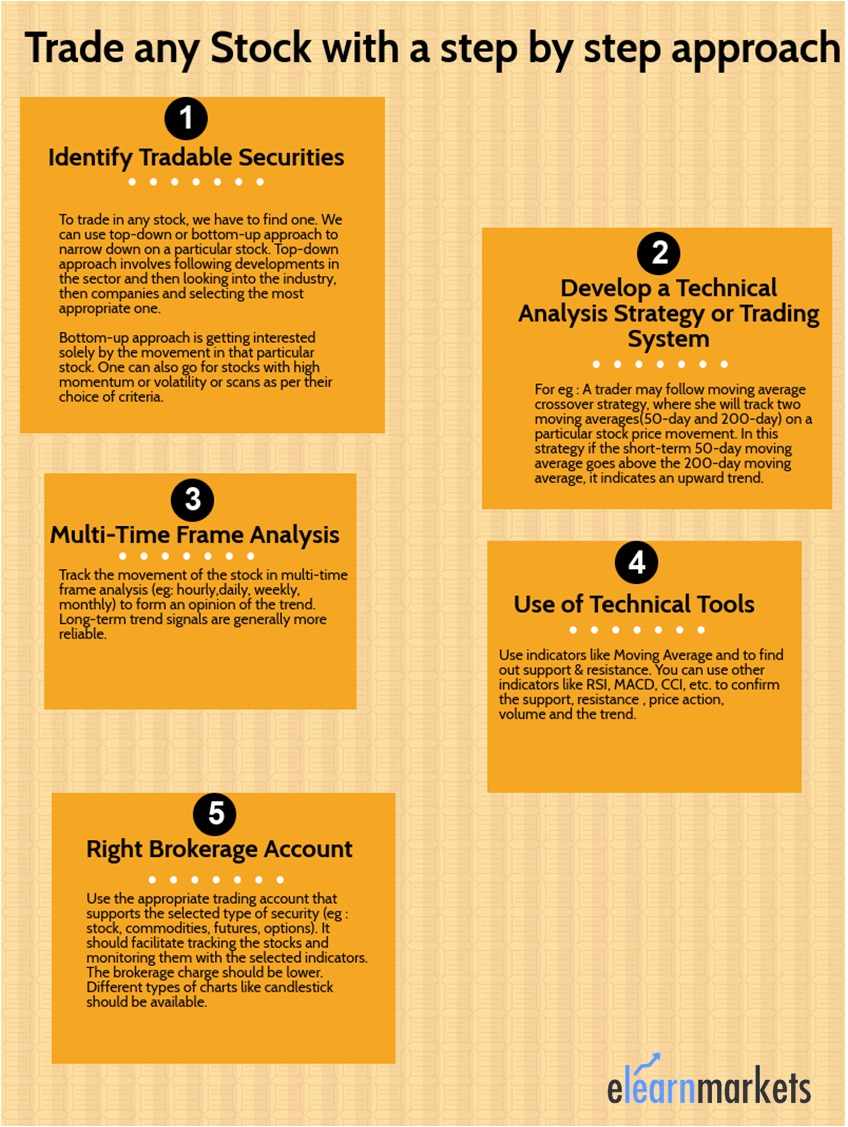
How to use Technical Analysis tools?
Technical Analysis can be used to trade in any markets. The underlying principles of technical analysis are same for all the markets. All the markets such as commodity prices, foreign exchange rates, cryptocurrency value follow similar movements.
These charting patterns are trading systems are applicable in these markets also. So, you can use same skills to trade in stocks, commodities, currencies, indices, interest rates, cryptocurrency, etc.
How to make Maximum Profit at Minimum Risk?
Also, rememer the fact that risk is a part of every trade you put in. So, you should learn and use proper risk-management tools to minimize your losses. You should always make use of stop-loss to protect you in case the trade goes against your analysis.
Always remember the principle to use as low risk as possible in order to earn a certain return. For example: If there is a possibility to earn 2 % return your loss exposure should not be more than 1-1.5%.
Bottomline
None of the technical indicators in a fool-proof method in itself. Indicators do provide false signals so you should practice and use these indicators and techniques with utmost skill. The techniques mentioned above are not the only ways. You can develop your own system and back-test them and finally use them successfully.


