Key Takeaways
- Spinning tops require confirmation with other technical indicators and candlestick patterns.
- A spinning top candlestick pattern have a small real body with upper and lower shadows of the almost same length.
- The real body is small as it shows little difference between the open and close prices.
- The pattern shows indecision as buyers and sellers both pushed the price on either sides.
- If there is a strong up move, then a spinning top shows buyers may be losing some of their control, and there might be a reversal of the trend
Components of Spinning Top Candlestick:
Let us discuss the following components:
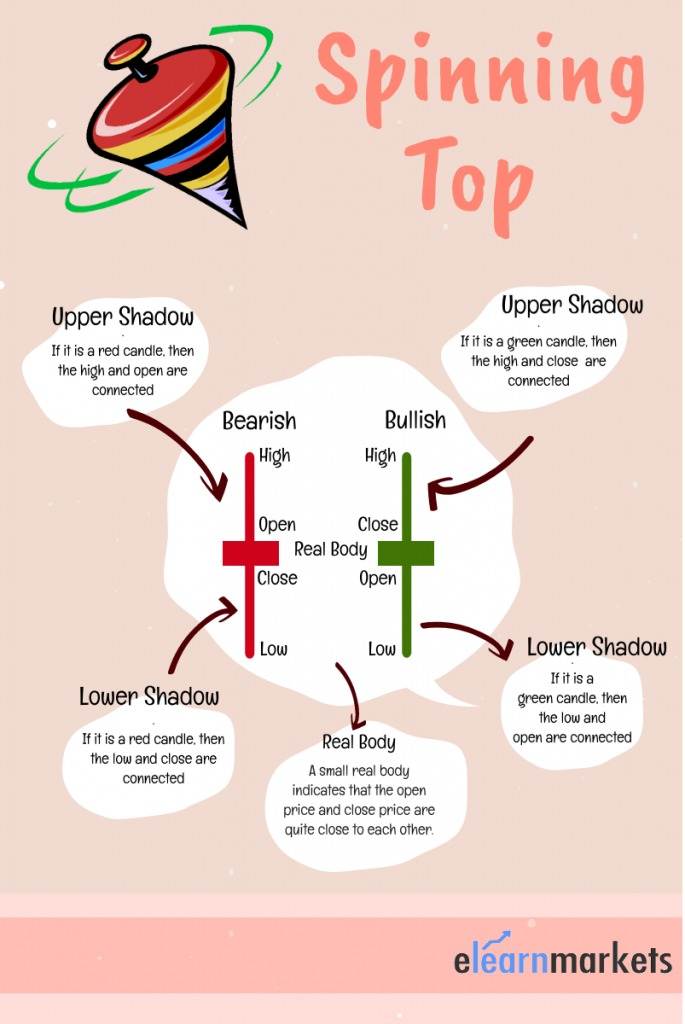
1. The Upper Shadow:
The upper shadow connects the highest price of the day with the real body.
If it is a red candle, then the high and open are connected, and if it is a green candle, then the high and close are connected.
2. Small Real body:
A small real body indicates that the open price and close price are quite close to each other.
For instance, if the open price is Rs. 320, and the closing price is Rs. 324, then this will lead to the creation of a small real body as a 4-point move is not much.
As the open and close prices are near to each other, the colour of the candle does not matter.
3. The Lower Shadow:
The lower shadow connects the lowest price of the day with the real body.
If it is a red candle, then the low and closing prices are connected, and if it is a green candle, then the low and opening prices are connected.
What does Spinning Top Candlestick Tell You?
The upper shadow tells us that the bulls did attempt to take the prices of the stock higher, but they failed in doing so.
If the bulls were successful, then the real body would have become a long green candle.
Thus this can be considered as an attempt by the bulls for taking the markets higher, but they were not successful in doing so.
The lower shadow tells us that the bears did take an attempt to bring the stock prices low, but they were not successful at it.
If the bears were successful, then the real body would have become a long red candle.
Thus this can be considered as an attempt by the bears to take the stock prices lower, but they were not successful in doing so.
1. Spinning Top in a Downtrend:
Let us discuss what does a spinning top in a downtrend indicate:
In a downtrend, the bears have total control as they keep making the prices fall.
The spinning top in the downtrend may indicate that the bears may be consolidating their position.
Or it may also indicate that the bulls have come and tried to take the prices higher, but they were unable to do so.

Thus the spinning top candlestick in the downtrend indicates two probable situations:
- The bears are consolidating, and there may be another round of selling
- The market could reverse upside.
2. Spinning Top in an Uptrend:
Let us discuss what does a spinning top in an uptrend indicate:
In an uptrend, the bulls have total control as they keep rising the prices.
Want to know psychology behind candlestick? Enroll for Trade Better with Candlesticks webinar by market experts
The spinning top in the uptrend may indicate that the bulls may be consolidating their position.
Or it may also indicate that the bears have come and tried to make the prices lower, but they were unable to do so.
Thus the spinning top candlestick in the uptrend indicates two probable situations:
- The bulls are consolidating, and there may be another round of buying
- The market could reverse downside.
To know about other candlesticks, read our blog on All 35 Candlestick Chart Patterns in the Stock Market-Explained
Difference Between Doji and Spinning Top:
Spinning tops and dojis, they both represent indecision.
Dojis are smaller; they have small real bodies and small upper and lower shadows, whereas the Spinning top has long upper and lower shadows.
Both patterns frequently occur and can be used to warn of a reversal after a strong price move.
There are some problems when trading with a spinning top.
One should place a stop loss above or below the high/low of the spinning top when trading with it.
It is also difficult to assess the reward potential of a spinning top candlestick trade as the price target cannot be set.
Traders should use other strategies or indicators to confirm the signal given by the spinning top candlestick.
You can also use technical scans to filter out stocks for trading next day by using StockEdge App.
Did you find spinning top candlestick pattern useful? Tell us by commenting below.
Happy Learning!


Essential and useful candle stick analysis explained easily.
Very informative
Hi,
We are glad that you liked our blog post.
Thank you for Reading!