Elearnmarkets - Financial Market Learning
  • Courses
  • Webinars
  • Stories
  • Language
    • English
    • Hindi
    • Bengali
No Result
View All Result
Get Free Course
  • Basic Finance
  • Derivatives
    • Futures
    • Options
  • Financial Planning
  • Fundamental Analysis
  • Technical Analysis
  • Mutual Funds
  • Marketshala
  • Miscellaneous
Elearnmarkets - Learn Stock Market, trading, investing for Free
  • Courses
  • Webinars
  • Stories
  • Language
    • English
    • Hindi
    • Bengali
No Result
View All Result
Get Free Course
Elearnmarkets - Learn Stock Market, trading, investing for Free
No Result
View All Result
Home Technical Analysis
How to trade with Renko Charts Efficiently? 1

How to trade with Renko Charts Efficiently?

Vivek Bajaj by Vivek Bajaj
August 1, 2024
in Technical Analysis
Reading Time: 7 mins read
0
7k
VIEWS
Share on FacebookShare on XShare on WhatsApp

The Renko Trading Strategy is intended to eliminate much of the market noise produced by standard candlestick charts. We’d like to introduce you to Renko charts if you’re tired of using the same old Japanese candlestick charts. Using Renko charts, we remove the time element and concentrate solely on the price, isolating the trend.

When actively trading the markets (scalping, day trading), it is critical to have a methodology in place to filter out market noise. The Renko trading strategy is time-independent and provides an unusual perspective on price action.

Even though free Renko charts can be used across multiple asset classes, including cryptocurrencies, our basic Renko system is designed, but not limited to, to use in the Forex market.

In today’s blog, we will discuss how to trade with Renko Charts and Trading Patterns:

Table Of Contents
  1. What are Renko Charts?
  2. How to use Renko Charts?
  3. Trading Strategy using Renko Charts
    • 1. Support and Resistance
    • 2. Chart Patterns
    • 3. Trailing Stop Losses
  4. Pros and Cons of Renko Charts
  5. Bottomline
    • What are Renko Charts?
    • How are Renko Charts Different from Traditional Candlestick Charts?

What are Renko Charts?

A Renko chart is a type of Japanese chart that is built using price movement rather than price and standardized time intervals, as most charts are. The chart is thought to be named after the Japanese word for bricks, “renga,” because it resembles a series of bricks. 

What are renko charts explained

When the price moves a certain amount, a new brick is created, and each block is positioned at a 45-degree angle (up or down) to the previous brick. An up brick is usually white or green, whereas a down brick is usually black or red.

How to use Renko Charts?

Renko charts filter out minor price movements, allowing traders to focus on important trends. While this makes identifying trends much easier, the downside is that some price information is lost due to the Renko charts‘ simple brick construction.

The first step in creating a Renko chart is determining the size of the boxes to represent the magnitude of price movement. For the stock example, suppose a stock is worth Rs. 10 and has  Rs. 0.25 box size. 

A new brick will be drawn if the price rises to Rs. 10.25. That brick will not be drawn until the price reaches Rs. 10.25 or higher. A new brick will not be drawn if the price only reaches Rs. 10.24. A brick is not deleted once it has been drawn. If the price rises to or exceeds Rs. 10.50 (and remains there), another brick will be drawn.

ATR is used in addition to fixed box sizes. Because ATR is a measure of volatility, it fluctuates over time. The fluctuating ATR value will be used as the box size in Renko charts based on ATR.

Renko charts have a time axis, but the time intervals are variable. One brick may take months, whereas several bricks may form daily. This differs from candlesticks or bar charts, in which a new candle/bar forms regularly.

Trading Strategy using Renko Charts

A Renko trading strategy can assist traders in identifying high-quality trading opportunities. A Renko chart can provide the following signals:

1. Support and Resistance

Renko charts exhibit strength when the bricks alternate at a specific price area for an extended period of time. At these levels, traders can trade range-bound strategies while watching for them. 

support and resistance in renko charts

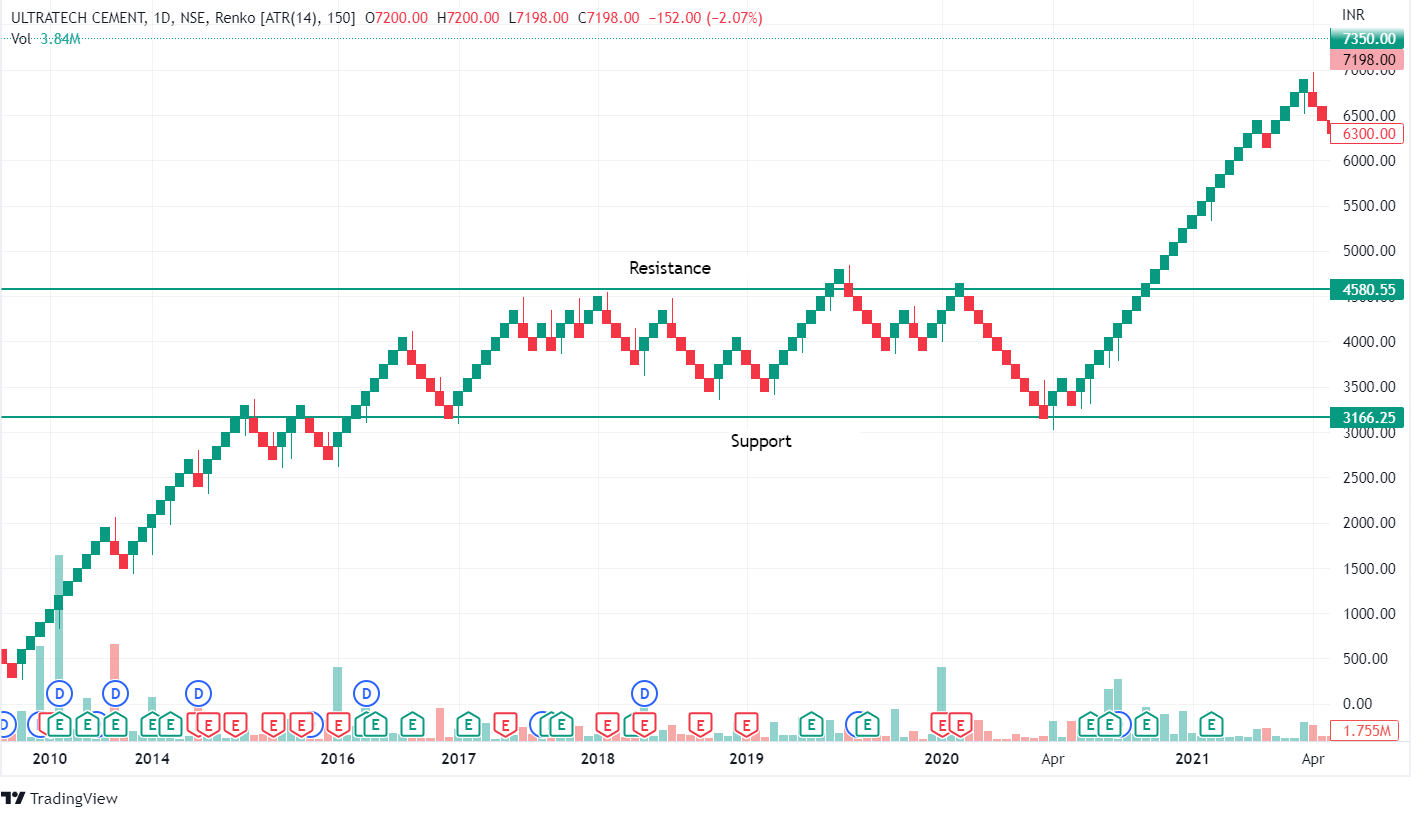
A range-bound trade will involve buying near areas of support and selling near areas of resistance. Renko charts highlight strong support and resistance areas, allowing traders to look for price breakouts and ride the new trend.
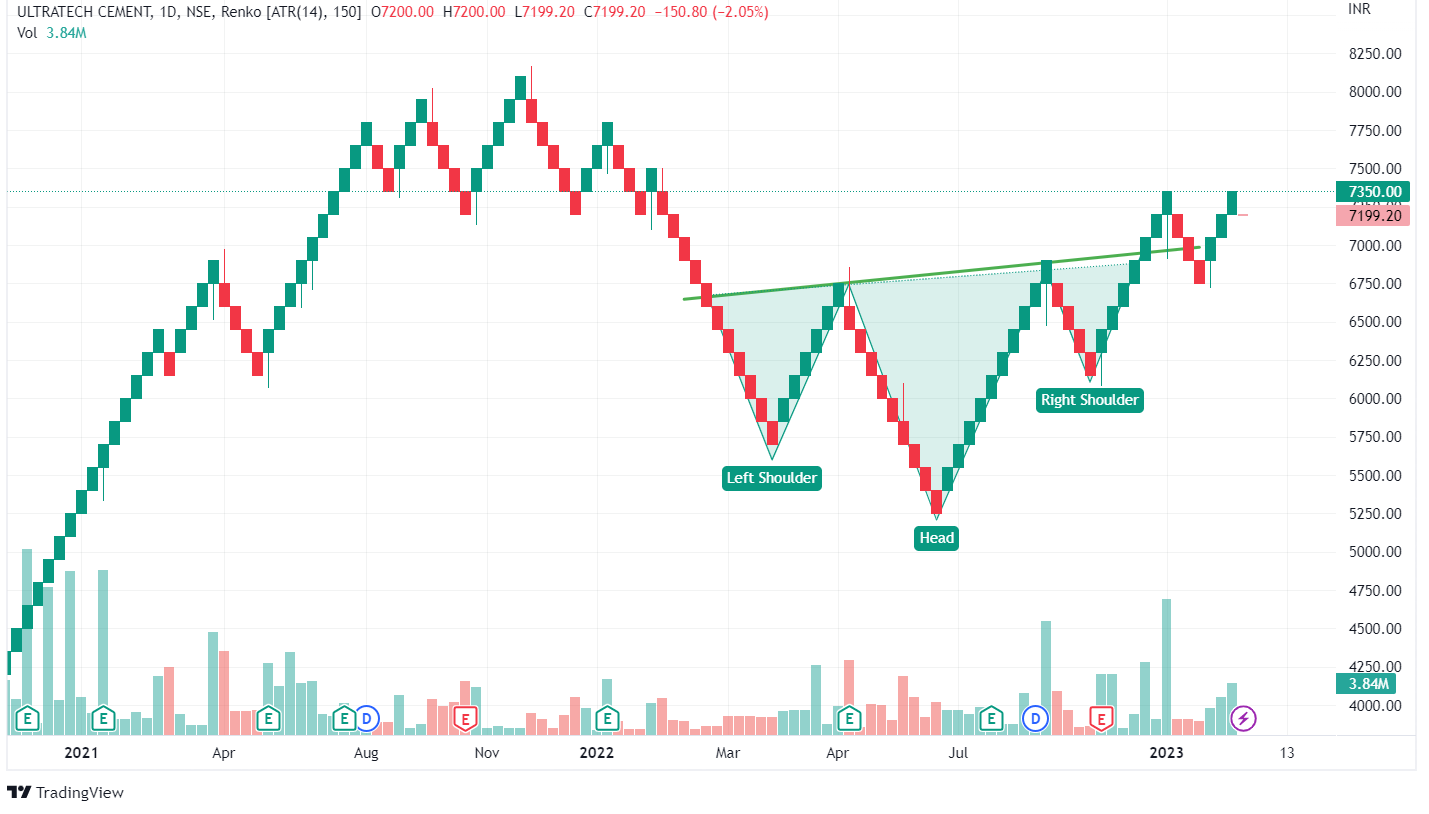
2. Chart Patterns

As Renko bricks are drawn over time, they exhibit characteristics similar to those seen in traditional candlestick charts, such as double tops and double bottoms, head and shoulders, and triangles. When such chart patterns appear on a Renko chart, they are easy to identify, more reliable, and have a high probability of occurrence.

chart patterns in renko charts

3. Trailing Stop Losses

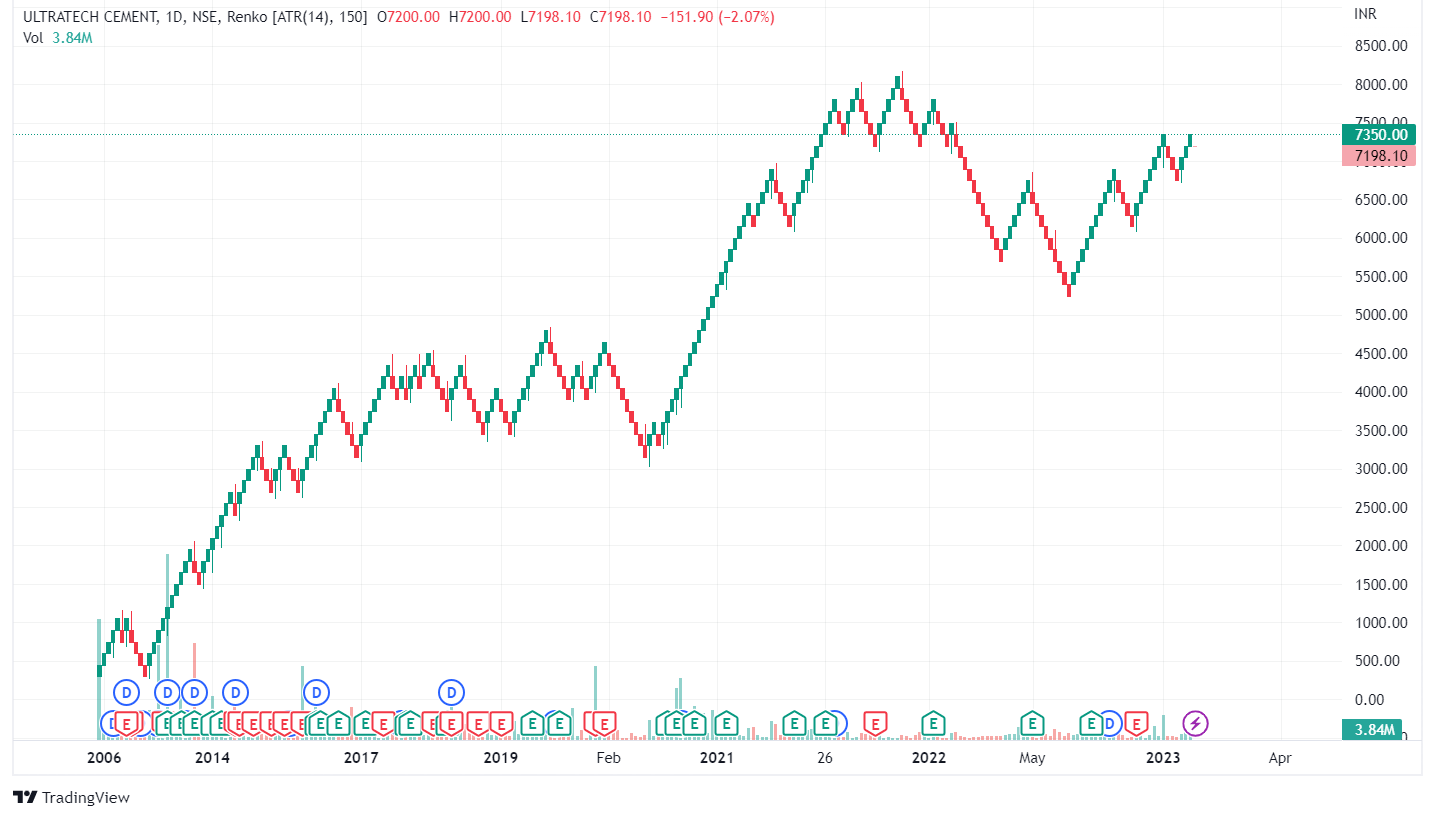
Renko charts help traders identify the long-term dominant trend. This could allow traders to profit from the trend in the long run. While this is fantastic, it is also critical to partial book profits as the trend continues. Renko charts are excellent for determining the best price areas to enter to maximize profits from following an existing trend.

Renko charts provide traders with high-quality, dependable signals. However, the formation of boxes can sometimes be delayed, denying traders the opportunity to capitalize on a good opportunity early on. While long-term traders will not be bothered by this, it may be very restrictive.

Watch our webinar on Index and Stocks trading using Renko Charts

Pros and Cons of Renko Charts

Let us discuss the advantages and disadvantages of using Renko Charts:

Due to their lack of reliance on time, Renko charts do not provide as much detail as candlesticks or bar charts. A stock fluctuating for a long time may be represented by a single box, which does not convey everything that happened during that time. This may be advantageous to some traders but not to others.

Renko charts provide a broader view of the market and aid in identifying long-term market trends (short-term noise is filtered out), and assist traders in identifying market support and resistance areas.

Renko charts assist traders in capitalizing on long-term trends and identifying markets where the trend has clearly reversed. This can help you decide when to offset positions in trending markets.

You can also do our Masterclass on Renko Chart Patterns

Bottomline

These charts provide traders with a straightforward yet effective understanding of market patterns because of their distinctive architecture based on price fluctuations. These charts help traders identify trends clearly by removing noise and emphasizing big price movements, which enables them to make well-informed decisions. Including Renko charts in your technical analysis, toolset can help traders of all skill levels identify trends, control risk, and develop more effective trading methods.

What are Renko Charts?

One kind of financial chart utilized in technical analysis is the Renko chart. They differ from other price representations in that they employ fixed-size bricks or boxes to symbolize price fluctuations rather than time intervals.

How are Renko Charts Different from Traditional Candlestick Charts?

These charts highlight notable price moves as opposed to standard candlestick charts, which show price movements over predetermined time intervals. Without regard to time, a new brick is only created when the price rises above a certain threshold.

Visit StockEdge for more Market Updates

Tags: basicenglishrenko chartstechnical analysis
ShareTweetSend
Get Kotak Offer Get Kotak Offer Get Kotak Offer
Previous Post

Top 5 Swing Trading Webinars for Stock Market Traders

Next Post

The Ultimate Guide to Currency Hedging for International Investors

Vivek Bajaj

Vivek Bajaj

Mr. Vivek Bajaj has over 18 years of trading experience in equities, options, currencies, and commodity markets. He is the co-founder of Stockedge and Elearnmarkets and is passionate about data, analytics, and technology. He serves on various exchange committees and has played a significant role in the evolution of India's derivative market. He has been a speaker at various colleges and higher institutions, including IIT and IIMs.

Related Posts

Understand Slippage in Trading
Technical Analysis

What is Slippage in Trading? Meaning & Examples

March 28, 2025
349
Breakout trading strategies
Technical Analysis

Top 5 Breakout Trading Strategies

March 12, 2025
1.2k
5 stocks for today
Technical Analysis

5 Stocks to Buy Today That Could Beat the NIFTY in 2025!

May 5, 2025
434
Image describing What is marginal trading facility
Technical Analysis

 What is a Margin Trading Facility? Advantages & Risks

April 4, 2025
849

Leave a Reply Cancel reply

Your email address will not be published. Required fields are marked *

Disclaimer

Elearnmarkets (Kredent InfoEdge Pvt. Ltd.) is a SEBI-registered Research Analyst (RA) entity (SEBI Registration No.: INH300007493). The information provided in this article is for educational and informational purposes only and should not be considered as an offer to buy or sell any securities or investment products.

The stocks, securities, and investment instruments mentioned herein are not recommendations under SEBI (Research Analysts) Regulations, 2014. Readers are advised to conduct their own due diligence and seek independent financial advice before making any investment decisions.

Investments in securities markets are subject to market risks. Please read all related documents carefully before investing. Investing in Equity Shares,
Derivatives, Mutual Funds, or other instruments carry inherent risks, including potential loss of capital. Elearnmarkets (Kredent InfoEdge Pvt. Ltd.) does not provide any guarantee or assurance of returns on any investments. Past performance is not indicative of future performance.

Elearnmarkets Logo

Follow Us

Facebook-f X-twitter Instagram Linkedin-in Youtube Telegram

Register on Elearnmarkets

Continue your financial learning by creating your own account on Elearnmarkets.com

Register Free Account

Download App

Playstore logo
Download on app store

Categories

  • Basic Finance
  • Derivatives
  • Financial Planning
  • Fundamental Analysis
  • Technical Analysis
  • Mutual Funds
  • Miscellaneous

Popular On Elearnmarkets

  • Market Superheroes:
  • Vivek Bajaj
  • Chetan Panchamia
  • Ashish Kyal
  • Premal Parekh
  • Abhijit Paul
  • Jegan
  • Sivakumar Jayachadran
  • Jyoti Budhia
  • Vivek Gadodia
  • Vishal Mehta
  • Piyush Chaudhry
  • Santosh Pasi
  • Gomathi Shankar
  • Market Superheroes:
  • Vivek Bajaj
  • Chetan Panchamia
  • Ashish Kyal
  • Premal Parekh
  • Abhijit Paul
  • Jegan
  • Sivakumar Jayachadran
  • Jyoti Budhia
  • Vivek Gadodia
  • Vishal Mehta
  • Piyush Chaudhry
  • Santosh Pasi
  • Gomathi Shankar
  • Courses:​
  • Options Trading
  • Dow Theory
  • Momentum Trading
  • Stock Investing
  • Harmonic Chart Patterns
  • Algo Trading
  • Elliot Wave Theory
  • Advanced Excel
  • Cryptocurrency
  • NSE Certification Course
  • Courses:​
  • Options Trading
  • Dow Theory
  • Momentum Trading
  • Stock Investing
  • Harmonic Chart Patterns
  • Algo Trading
  • Elliot Wave Theory
  • Advanced Excel
  • Cryptocurrency
  • NSE Certification Course
  • Webinars:
  • Bank Nifty Scalping
  • Intraday Trading Strategies
  • Options Trading Strategies
  • Options selling
  • Price Action
  • Relative Strength
  • Tax Planning
  • Options Buying
  • Growth Stocks
  • Portfolio Management
  • Risk Management
  • Renko Charts
  • Crude Oil
  • Traders Psychology
  • Moving Average
  • Multibagger Stocks
  • Free Learning Modules:
  • Intraday Trading
  • Options Scalping
  • Swing Trading
  • Financial Modelling
  • RSI Indicator
  • Bollinger Bands
  • Pricing of Futures
  • Personal Finance
  • Initial Public Offerings (IPO)
  • Value Investing
  • Technical Indicators
  • Candlesticks
  • Chart Patterns
  • Option Greeks
  • ELSS Funds
  • Banking and Insurance
  • Real Estate
  • Gold
  • Book Summaries:
  • Rich Dad Poor Dad
  • Psychology of Money
  • The Intelligent Investor
  • The Richest Man in Babylon
  • Think and Trade Like a Champion
  • Value Investing and Behavioural Finance
  • Trading in the Zone
  • Learn to Earn
  • Book Summaries:
  • Rich Dad Poor Dad
  • Psychology of Money
  • The Intelligent Investor
  • The Richest Man in Babylon
  • Think and Trade Like a Champion
  • Value Investing and Behavioural Finance
  • Trading in the Zone
  • Learn to Earn
  • Tools:
  • CAGR Calculator
  • SIP Calculator
  • eLearnOptions
  • Future Value Calculator
  • Present Value Calculator
  • Atal Pension Yojana
  • Cost of Delay Calculator
  • Become a Crorepati
  • Tools:
  • CAGR Calculator
  • SIP Calculator
  • eLearnOptions
  • Future Value Calculator
  • Present Value Calculator
  • Atal Pension Yojana
  • Cost of Delay Calculator
  • Become a Crorepati

© 2025 Elearnmarkets. All Rights Reserved

  • Visit Elearnmarkets
  • Courses
  • Webinars
  • Financial Guides
  • Get Free Counselling
  • Visit Elearnmarkets
  • Courses
  • Webinars
  • Financial Guides
  • Get Free Counselling

Download Our App

No Result
View All Result
  • Article Categories
    • Basic Finance
    • Derivatives
    • Financial Planning
    • Fundamental Analysis
    • Technical Analysis
    • ETFs & Mutual Funds
    • Marketshala
    • Miscellaneous
  • Language
    • Hindi
    • Bengali
    • English
  • Courses
  • Webinars
  • Stories
Get Free Course

© 2024 Elearnmarkets All Rights Reserved

A Handbook of Technical Analysis
To start your trading journey as a seasoned technical analyst
Download Guide For FREE
Young Investors