Elearnmarkets - Financial Market Learning
  • Courses
  • Webinars
  • Stories
  • Language
    • English
    • Hindi
    • Bengali
No Result
View All Result
Get Free Course
  • Basic Finance
  • Derivatives
    • Futures
    • Options
  • Financial Planning
  • Fundamental Analysis
  • Technical Analysis
  • Mutual Funds
  • Marketshala
  • Miscellaneous
Elearnmarkets - Learn Stock Market, trading, investing for Free
  • Courses
  • Webinars
  • Stories
  • Language
    • English
    • Hindi
    • Bengali
No Result
View All Result
Get Free Course
Elearnmarkets - Learn Stock Market, trading, investing for Free
No Result
View All Result
Home Technical Analysis
How to trade using Larry Connor’s 2-period RSI? 1

How to trade using Larry Connor’s 2-period RSI?

Elearnmarkets by Elearnmarkets
April 22, 2024
in Technical Analysis, Charts, Patterns & Indicators
Reading Time: 6 mins read
8
45.8k
VIEWS
Share on FacebookShare on XShare on WhatsApp

The 2 period RSI developed by Larry Connors is a mean reversion strategy which provides a short-term buy-sell signal.

The strategy gives a probable buy signal when 2-period RSI goes below 10 (lower the better) which is regarded as highly oversold. Similarly move above 90 generates sell signal (of course higher the better) which is seen as a highly overbought zone.

Table of Contents
Identification of long-term trend
Wait for RSI signal
Actual buy and sell signal
Exit strategy
How to trade using Larry Connors RSI (2) strategy?
Conclusion

The trading strategy using  connor’s 2-period RSI basically comprises of four steps which are discussed below-

1. Identification of long-term trend

In order to identify the long-term trend, we can take the help of long-term moving average where  Connor uses 200 DMA for this matter.

When the stock is above 200 DMA, the long-term trend is up and traders may look for buying opportunities.

On the other hand, when the stock is below 200 DMA, the long-term trend is down and can be looked upon as a shorting opportunity.

Also read: Mastering Inside bar trading strategy

2. Wait for RSI signal

You may use RSI to identify buying and selling opportunities within the broader trend.

Larry Connor found that RSI between 0 to 10 is good buying area but discovered that RSI going below 5 provides a better return than RSI going below 10.

Similarly, RSI in a range of 90 to 100 is a good selling area while RSI above 95 gives a better return than above 90.

In simple words, the more short-term overbought or oversold the RSI, the higher the subsequent returns.

Larry Connor 2 period RSI 2-period strategy

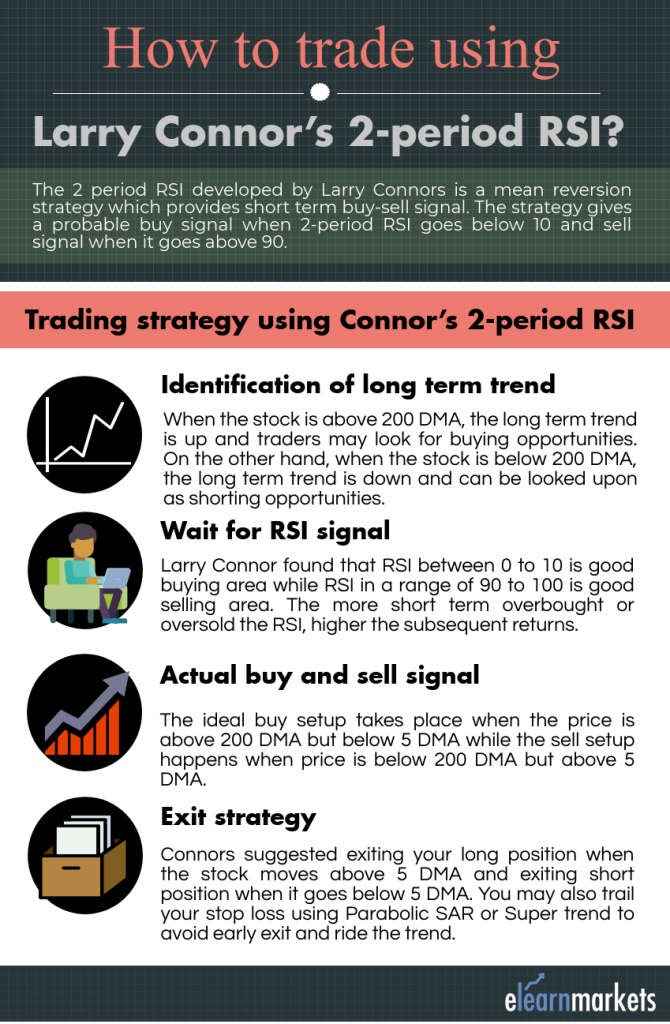
3. Actual buy and sell signal

This is the most important step since actual buying or selling is done in this step.

Another important factor here is with regard to entry timing.

The ideal buy setup takes place when the price is above 200 DMA but below 5 DMA while the sell setup happens when the price is below 200 DMA but above 5 DMA.

Traders can either make position just before the close or can make position next day opening.

Both the logic has its own pros and cons since entry based on close approach can be with gap up or gap down which may either go in favor or against the trader and thus may maximize your potential gains.

On the other hand, making position next day opening provides flexibility but can lose in case of gap up trade and thus reduces risk.

Depending upon your risk profile, you may make your position. The traders who are unable to devote much time in analyzing charts of various securities may benefit from scan section in the  StockEdge mobile app.

4. Exit strategy

This point is with regards to the exit strategy where Connors suggested exiting your long position when the stock moves above 5 DMA and exiting short position when it goes below 5 DMA.

Here you will not enjoy long trending moves but it is a short-term trading strategy which will result in quick exits.

You may also trail your stop loss using Parabolic SAR or Supertrend so that instead of making an early exit, you may ride the trend trailing your stop loss.

Know More: How to generate powerful trading signals using Parabolic SAR and RSI?

How to trade using Larry Connors 2 Period RSI strategy?

Based on the above 4 conditions, we will take a practical example to discuss the above trading strategy. Below is the daily chart of Havells India.

rsi strategy havells

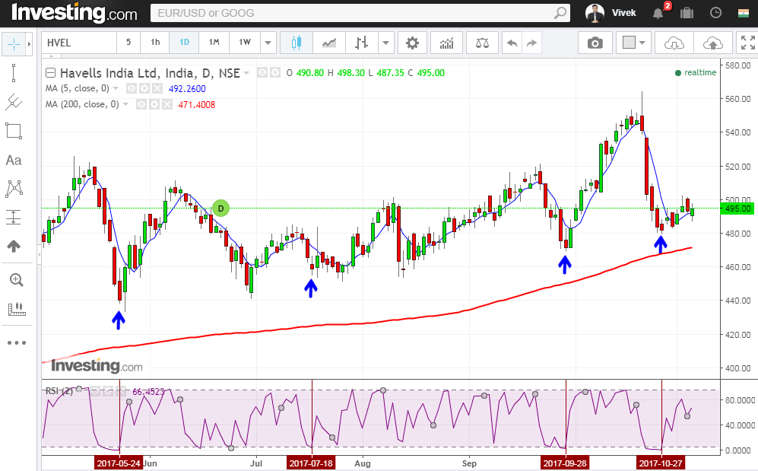
In all the above buying situations, the price candle was above 200 DMA but below 5 DMA.

In order to execute the actual trade, you may either make your position, when the RSI is below 5 or the next day open when the RSI crosses 5 from below.

Read More: 5 important roles of Relative Strength Index (RSI)

One important thing to note here is that you will execute your trade only when all the above conditions are met.

For exit, you may trail your stop-loss or above the close of 5 DMA.

In the same way, now we will look at the stock on the sell-side.

rsi trading strategy Wockhardt

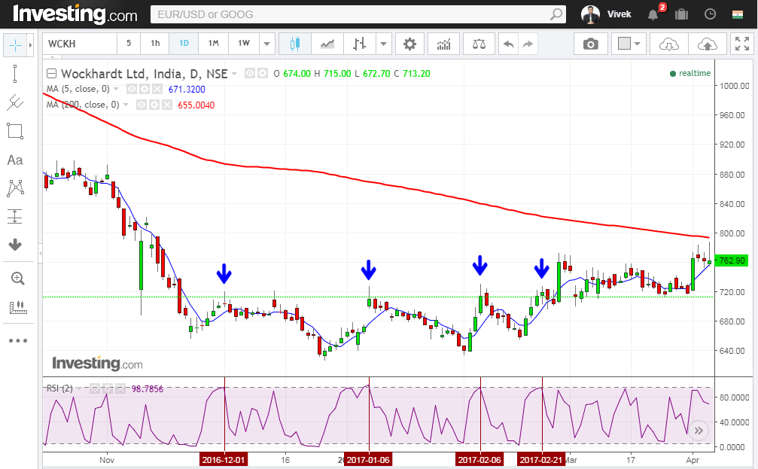
In all the above selling situations, the price candle was below 200 DMA but above 5 DMA.

In order to execute the actual trade, you may either make your position, when the RSI is above 95 or the next day open when the RSI crosses 95 from above.

For exit, you may trail your stop loss or below the close of 5 DMA.

Conclusion

This 2 period RSI strategy is designed not to look for tops or bottom but to participate in an ongoing uptrend.

But one problem within this 2 period RSI strategy is that Connor doesn’t believe in putting stops and he discovered that 2 period RSI may hurt your overall performance and thus he left on to traders to decide themselves based on their risk profile.

You may use 2 period RSI in conjunction with other indicators or strategies so that you can filter out the strategy as per your trading style.

Tags: advanceenglishIndicatorrsitechnical analysis
ShareTweetSend
Get Kotak Offer Get Kotak Offer Get Kotak Offer
Previous Post

Nifty sees some profit booking at the record high

Next Post

Bank Nifty likely to make a sharp move either way

Elearnmarkets

Elearnmarkets

Elearnmarkets (ELM) is a complete financial market portal where the market experts have taken the onus to spread financial education. ELM constantly experiments with new education methodologies and technologies to make financial education effective, affordable and accessible to all. You can connect with us on Twitter @elearnmarkets.

Related Posts

Understand Slippage in Trading
Technical Analysis

What is Slippage in Trading? Meaning & Examples

March 28, 2025
313
Breakout trading strategies
Technical Analysis

Top 5 Breakout Trading Strategies

March 12, 2025
1.1k
5 stocks for today
Technical Analysis

5 Stocks to Buy Today That Could Beat the NIFTY in 2025!

May 5, 2025
407
Image describing What is marginal trading facility
Technical Analysis

 What is a Margin Trading Facility? Advantages & Risks

April 4, 2025
674

Comments 8

  1. Dhanashree Hardikar says:
    5 years ago

    I’m subscribed member of Stock Edge . How to create this scan using stock edge ? because it does not have scan for 5 DMA and RSI above 90 or below 10.

    Please guide.

    Reply
    • Sakshi Agarwal says:
      5 years ago

      Hi,

      You can just use the ready Technical scans in StockEdge!

      Thank you for Reading!

      Reply
      • Dhanashree Hardikar says:
        5 years ago

        Please guide as to how to create this scan using the ready technical scans ? as I’m not able to to do it.

        Reply
        • Sakshi Agarwal says:
          5 years ago

          Hi,

          There is no option in creating of creating new scans in StockEdge.

          Thank you for Reading!

          Reply
  2. Dhanashree Hardikar says:
    5 years ago

    Hi,
    I know I can’t create new scan. What I’m asking is how to create my own combo scan using your crafted scans for the above ? Hope I’m clear this time.

    Reply
    • Sakshi Agarwal says:
      5 years ago

      Hi,

      Please refer to our blog on How to make a combination scan

      Reply
      • Arun Kumar Goyal says:
        5 years ago

        hi mam,
        In the trading view, we have a separate indicators of C RSI but it is showing a completely different buy/sell-side compared to RSI(2). Please suggest.

        Reply
        • Sakshi Agarwal says:
          5 years ago

          Hi,

          Yes as it is 2 period RSI it will show different signals.

          Thank you for Reading!

          Reply

Leave a Reply Cancel reply

Your email address will not be published. Required fields are marked *

Disclaimer

Elearnmarkets (Kredent InfoEdge Pvt. Ltd.) is a SEBI-registered Research Analyst (RA) entity (SEBI Registration No.: INH300007493). The information provided in this article is for educational and informational purposes only and should not be considered as an offer to buy or sell any securities or investment products.

The stocks, securities, and investment instruments mentioned herein are not recommendations under SEBI (Research Analysts) Regulations, 2014. Readers are advised to conduct their own due diligence and seek independent financial advice before making any investment decisions.

Investments in securities markets are subject to market risks. Please read all related documents carefully before investing. Investing in Equity Shares,
Derivatives, Mutual Funds, or other instruments carry inherent risks, including potential loss of capital. Elearnmarkets (Kredent InfoEdge Pvt. Ltd.) does not provide any guarantee or assurance of returns on any investments. Past performance is not indicative of future performance.

Elearnmarkets Logo

Follow Us

Facebook-f X-twitter Instagram Linkedin-in Youtube Telegram

Register on Elearnmarkets

Continue your financial learning by creating your own account on Elearnmarkets.com

Register Free Account

Download App

Playstore logo
Download on app store

Categories

  • Basic Finance
  • Derivatives
  • Financial Planning
  • Fundamental Analysis
  • Technical Analysis
  • Mutual Funds
  • Miscellaneous

Popular On Elearnmarkets

  • Market Superheroes:
  • Vivek Bajaj
  • Chetan Panchamia
  • Ashish Kyal
  • Premal Parekh
  • Abhijit Paul
  • Jegan
  • Sivakumar Jayachadran
  • Jyoti Budhia
  • Vivek Gadodia
  • Vishal Mehta
  • Piyush Chaudhry
  • Santosh Pasi
  • Gomathi Shankar
  • Market Superheroes:
  • Vivek Bajaj
  • Chetan Panchamia
  • Ashish Kyal
  • Premal Parekh
  • Abhijit Paul
  • Jegan
  • Sivakumar Jayachadran
  • Jyoti Budhia
  • Vivek Gadodia
  • Vishal Mehta
  • Piyush Chaudhry
  • Santosh Pasi
  • Gomathi Shankar
  • Courses:​
  • Options Trading
  • Dow Theory
  • Momentum Trading
  • Stock Investing
  • Harmonic Chart Patterns
  • Algo Trading
  • Elliot Wave Theory
  • Advanced Excel
  • Cryptocurrency
  • NSE Certification Course
  • Courses:​
  • Options Trading
  • Dow Theory
  • Momentum Trading
  • Stock Investing
  • Harmonic Chart Patterns
  • Algo Trading
  • Elliot Wave Theory
  • Advanced Excel
  • Cryptocurrency
  • NSE Certification Course
  • Webinars:
  • Bank Nifty Scalping
  • Intraday Trading Strategies
  • Options Trading Strategies
  • Options selling
  • Price Action
  • Relative Strength
  • Tax Planning
  • Options Buying
  • Growth Stocks
  • Portfolio Management
  • Risk Management
  • Renko Charts
  • Crude Oil
  • Traders Psychology
  • Moving Average
  • Multibagger Stocks
  • Free Learning Modules:
  • Intraday Trading
  • Options Scalping
  • Swing Trading
  • Financial Modelling
  • RSI Indicator
  • Bollinger Bands
  • Pricing of Futures
  • Personal Finance
  • Initial Public Offerings (IPO)
  • Value Investing
  • Technical Indicators
  • Candlesticks
  • Chart Patterns
  • Option Greeks
  • ELSS Funds
  • Banking and Insurance
  • Real Estate
  • Gold
  • Book Summaries:
  • Rich Dad Poor Dad
  • Psychology of Money
  • The Intelligent Investor
  • The Richest Man in Babylon
  • Think and Trade Like a Champion
  • Value Investing and Behavioural Finance
  • Trading in the Zone
  • Learn to Earn
  • Book Summaries:
  • Rich Dad Poor Dad
  • Psychology of Money
  • The Intelligent Investor
  • The Richest Man in Babylon
  • Think and Trade Like a Champion
  • Value Investing and Behavioural Finance
  • Trading in the Zone
  • Learn to Earn
  • Tools:
  • CAGR Calculator
  • SIP Calculator
  • eLearnOptions
  • Future Value Calculator
  • Present Value Calculator
  • Atal Pension Yojana
  • Cost of Delay Calculator
  • Become a Crorepati
  • Tools:
  • CAGR Calculator
  • SIP Calculator
  • eLearnOptions
  • Future Value Calculator
  • Present Value Calculator
  • Atal Pension Yojana
  • Cost of Delay Calculator
  • Become a Crorepati

© 2025 Elearnmarkets. All Rights Reserved

  • Visit Elearnmarkets
  • Courses
  • Webinars
  • Financial Guides
  • Get Free Counselling
  • Visit Elearnmarkets
  • Courses
  • Webinars
  • Financial Guides
  • Get Free Counselling

Download Our App

No Result
View All Result
  • Article Categories
    • Basic Finance
    • Derivatives
    • Financial Planning
    • Fundamental Analysis
    • Technical Analysis
    • ETFs & Mutual Funds
    • Marketshala
    • Miscellaneous
  • Language
    • Hindi
    • Bengali
    • English
  • Courses
  • Webinars
  • Stories
Get Free Course

© 2024 Elearnmarkets All Rights Reserved

A Handbook of Technical Analysis
To start your trading journey as a seasoned technical analyst
Download Guide For FREE
Guidebook On Chart Patterns
Take Your Trading To The Next Level With Strategies Shared In This Ebook
Download Guide For FREE
Trading Mentorship Program