We all love riding the roller coaster, isn’t it? It has its ups and downs and we cheer every time it changes its vertical direction. Sometimes it goes in an upward direction and sometimes we get butterflies in the stomach when it goes in the downward direction. We can feel that thrill, right? Just like the roller coaster ride, the same thing happens in the capital market and price channel pattern trading.
The capital market has its own ups and downs. But, not every trader is able to take the ultimate enjoyment of this ride. Because Predicting the market is really a difficult job. In this topic, we are going to discuss how the price channel helps us to recognize the opportune trend (high & low) and how we can take benefit of this ride.
| Table of Contents |
|---|
| What is Channel Pattern Trading? |
| Types of Price channel |
| How to Identify the price channel continuation pattern? |
| Trading Price channel |
| How to predict early Breakouts? |
| Bottom line |
What is Channel Pattern Trading?
Price channel Continuation pattern is a combination of two lines. These two lines are parallel to each other and they compose a channel when placed on the price chart.
The upper line of the channel represents the Resistance line while the lower one acts as a support line.
When the direction of the price channel is in the upward direction it is considered as the Bullish Price channel and when the face of the price channel is in the downward direction it is called the Bearish price channel.
Types of Price channel:
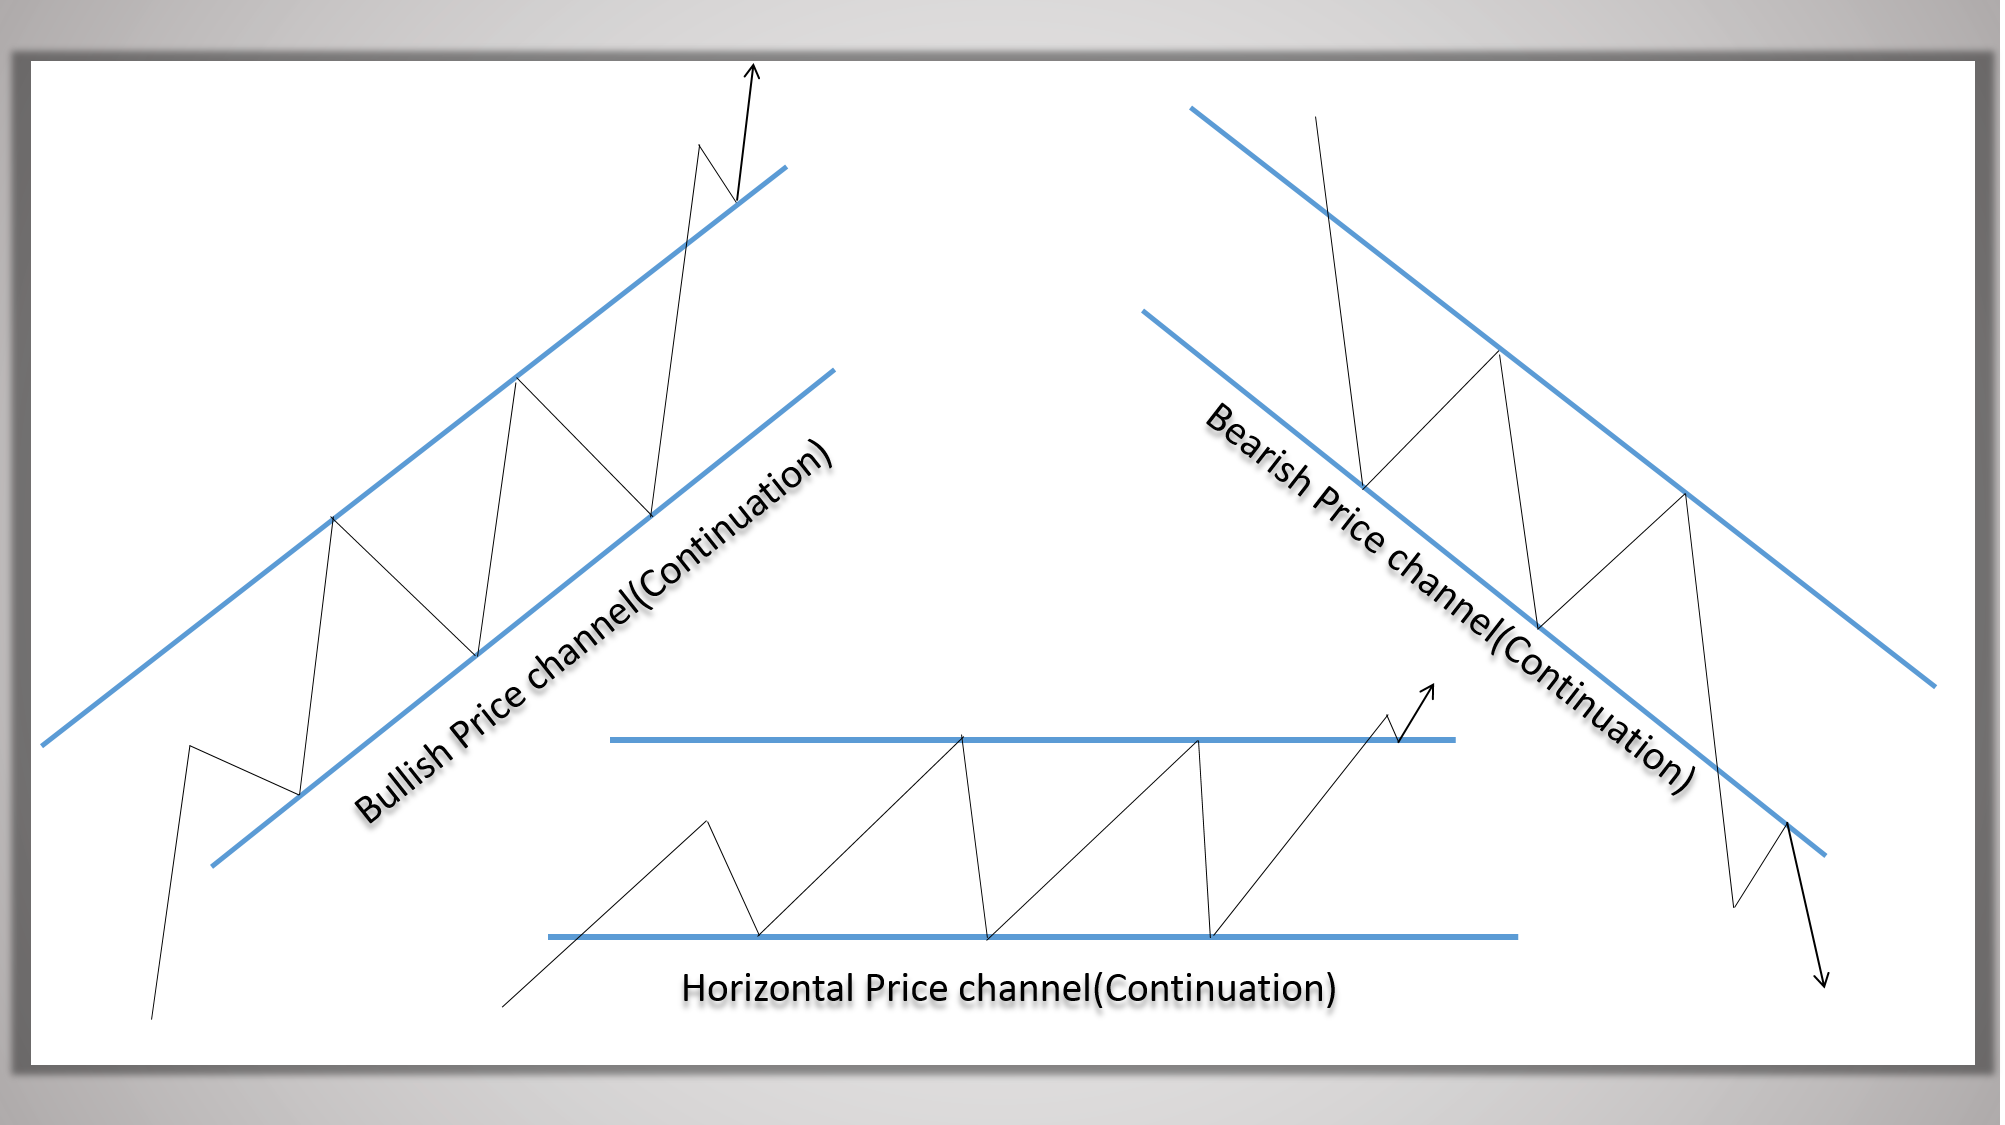
There are three types of Price channels in the market.
Bullish Price Channel Trading Pattern:
A bullish price channel is a continuation pattern which has a positive slope. You can keep taking long positions as long as it remains within the upper and lower channel line. In case it breaks the lower channel line, you can exit your long position and can simultaneously build a short position. However, instead of taking the entire short here, you should rather wait for a pullback where you can take your remaining position.
Learn to trade with Stock Market Made Easy by Market Experts
Bearish Price channel Trading Pattern:
As long as price follows the down-trending channel and trades within it, the bear market continues. Failure happens when the price breaks the resistance line and makes a new higher high.
Horizontal Channel Trading Pattern:
This pattern can be drawn when the price does not follow any particular upside or downside trend. If the price trades in a range-bound zone or in a consolidated zone, this price channel can be applied.
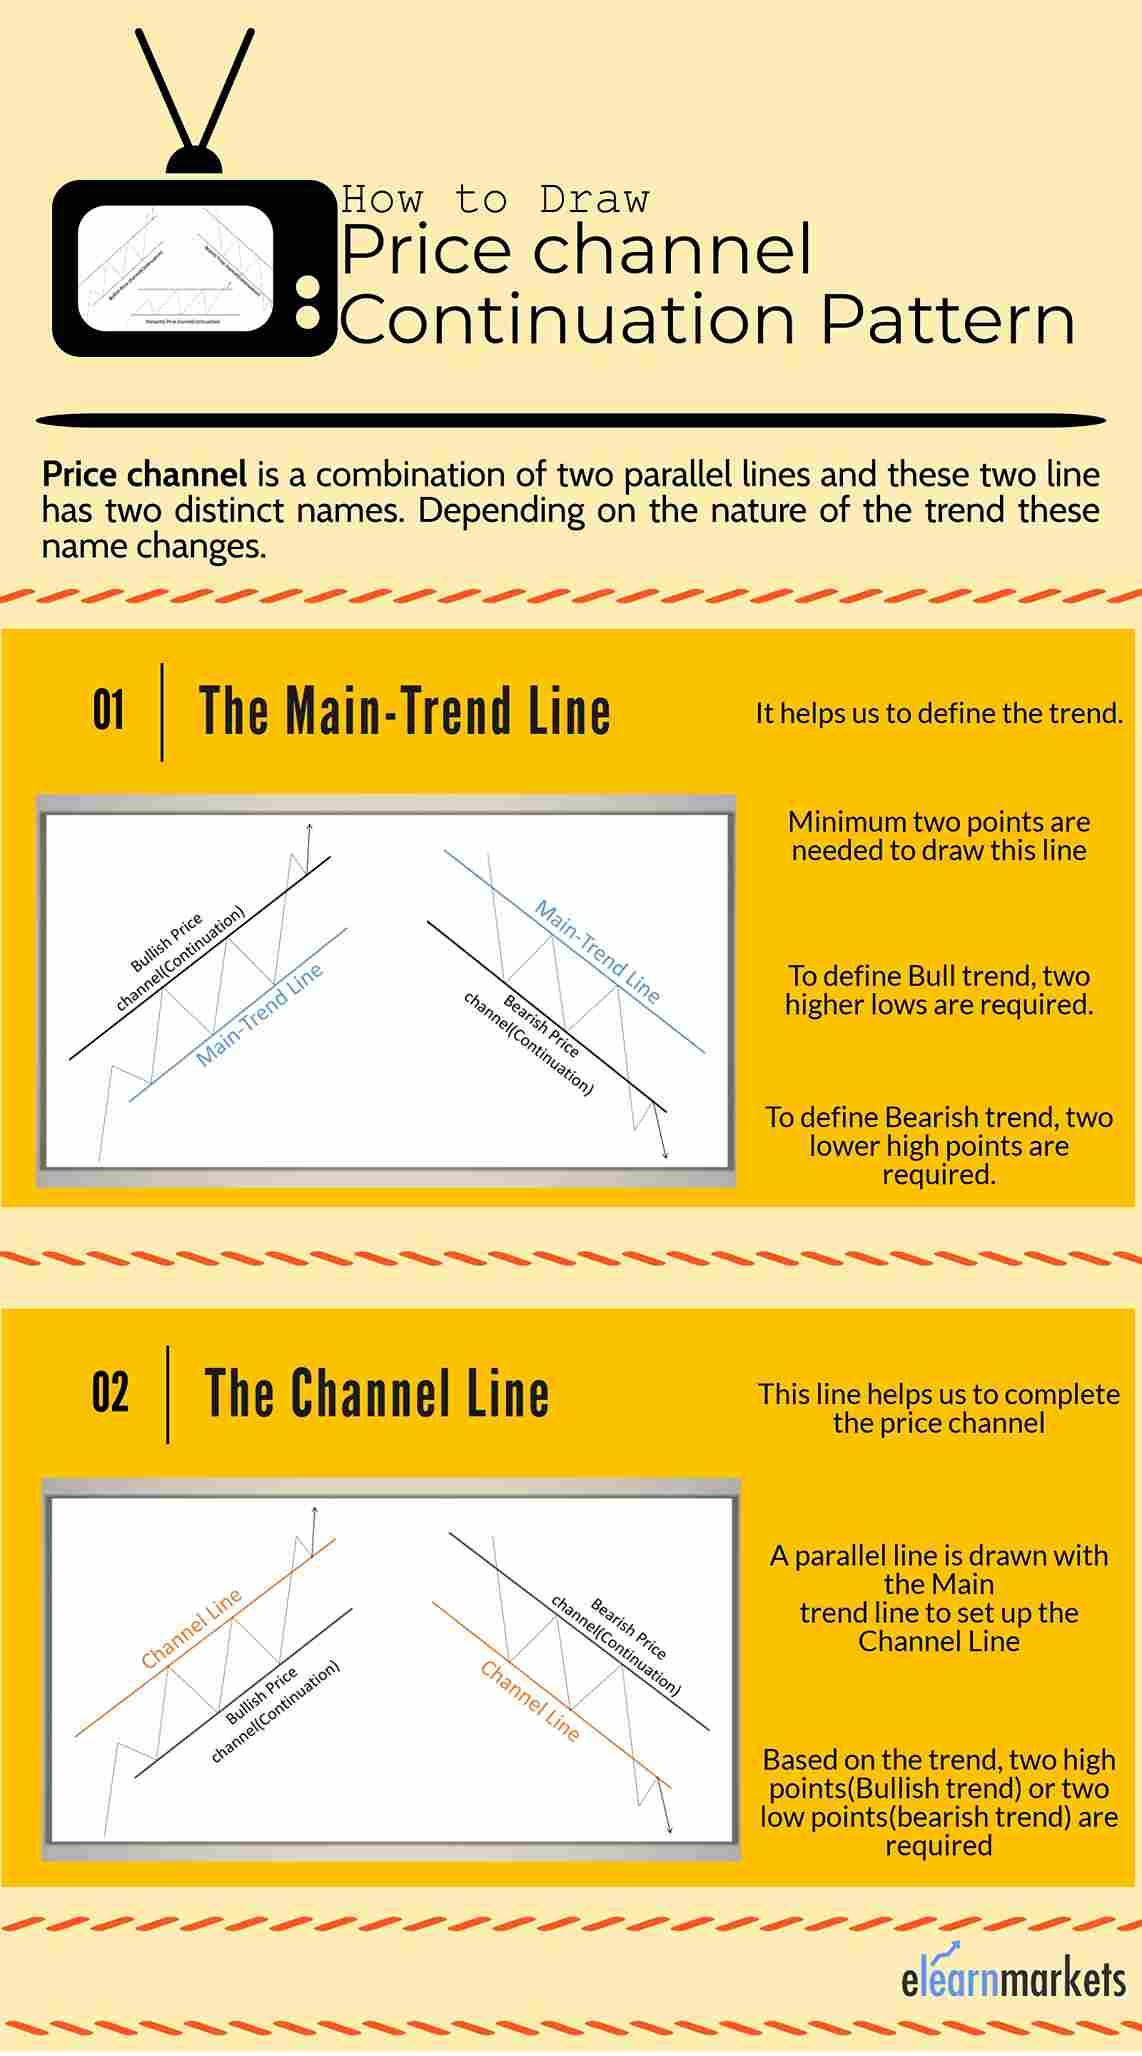
How to Identify the price channel continuation pattern?
Till now we have comprehended what is Price channels is and different types of Price Channel. But how to identify it in a chart?
Well, identifying a Price channel is not a troublesome job. Because of the simplicity of this pattern, it can be easily identified from the chart. We simply require a specific trend and at least two points, which can be associated with a line.
After we complete the identification of the Main Trendline, it is just a matter of a second to draw the Channel line parallel to the main trend line. But, the Channel line needs two highs or lows. A Bull price channel requires two reactive high points and in the case of a bear price channel pattern, two reactive low points are required. The pattern will become stronger with the existence of more points.
For a Bullish Price channel, the upper line (resistance line) of the channel will be designated as the channel line and the lower line (support line) will be called the main trend line and vice versa in case of bearish Price Continuation pattern channel. The upper line turns into the Main trend line while the support line or the lower line of the channel becomes the channel line.
Also Read: A complete overview on trend and theory of retracement
Trading Price channel:
We have seen that the price channel continuation pattern has a Support and Resistance line and it is very much obvious that the price will face resistance at a resistance level and will get support from a support level. Traders generally buy when the price trades at its support level and sell it when the price enters or touches its resistance level. Similarly, in the case of selling short, traders sell at the resistance level and buy at the support zone.
This pattern is one of the easiest patterns to trade. Anyone who has very little knowledge of technical analysis can trade this pattern. Because of the geometrical simplicity traders love to trade it and also it is very easy to spot on the chart. Support and Resistance are the key factors while trading this pattern. Let’s discuss this with the following example.
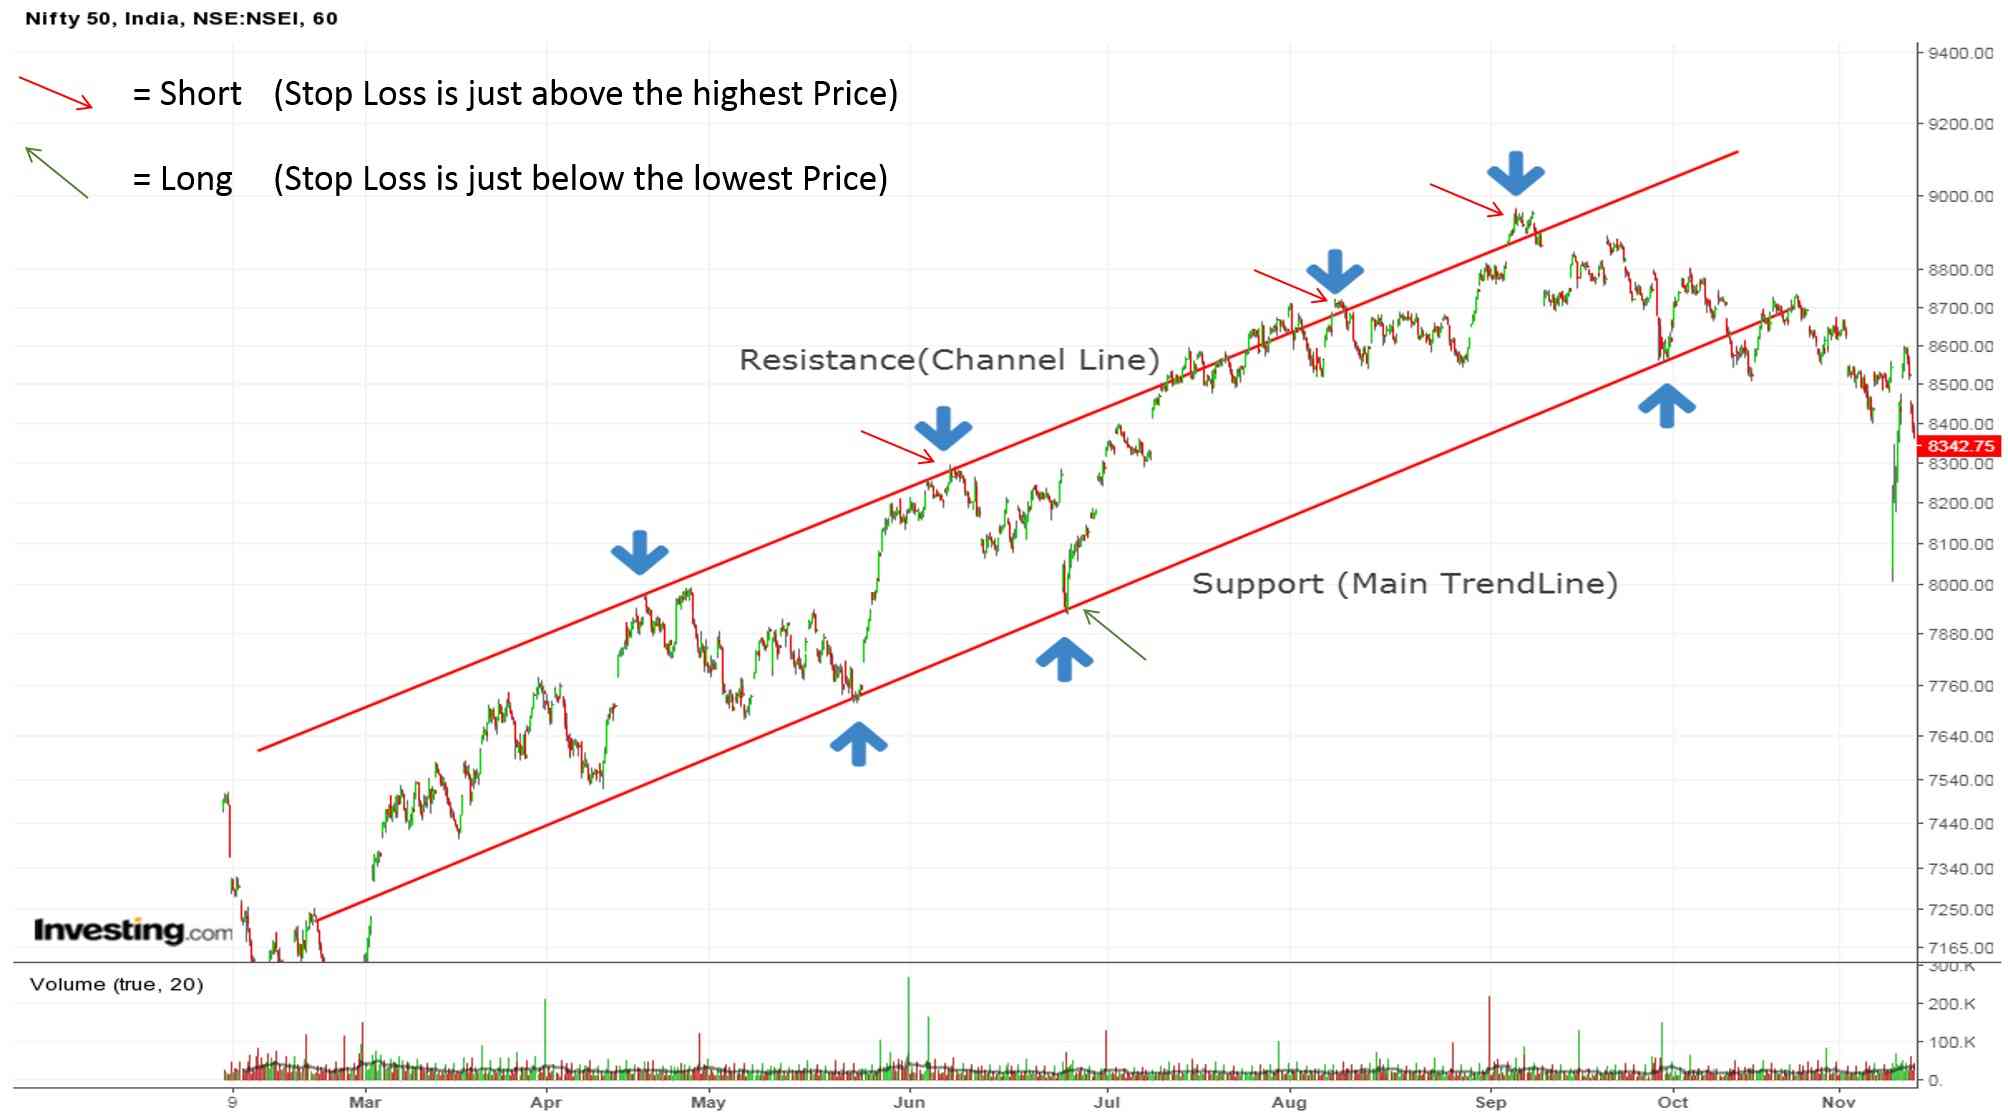
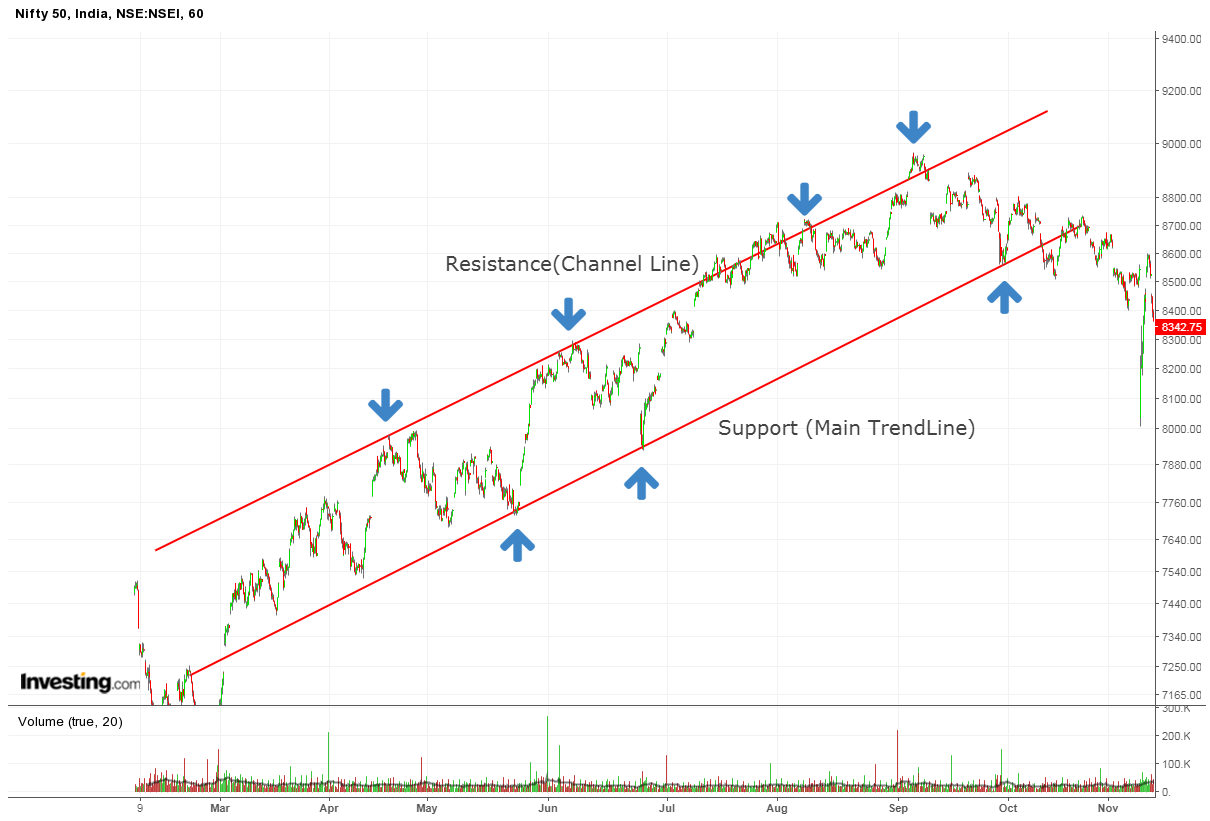
We can spot a price channel in the above 1Hour chart of Nifty 50. During this period the index was trading at near its 8000 level. After mid-June, the Main channel line started taking shape. A trader can go short when the price is unable to cross the level of 8300 level. From the above chart, we can see that price nearly corrected 500 points in that time period and took support from 7900 level. We can take the long position when the price begins to rise again.
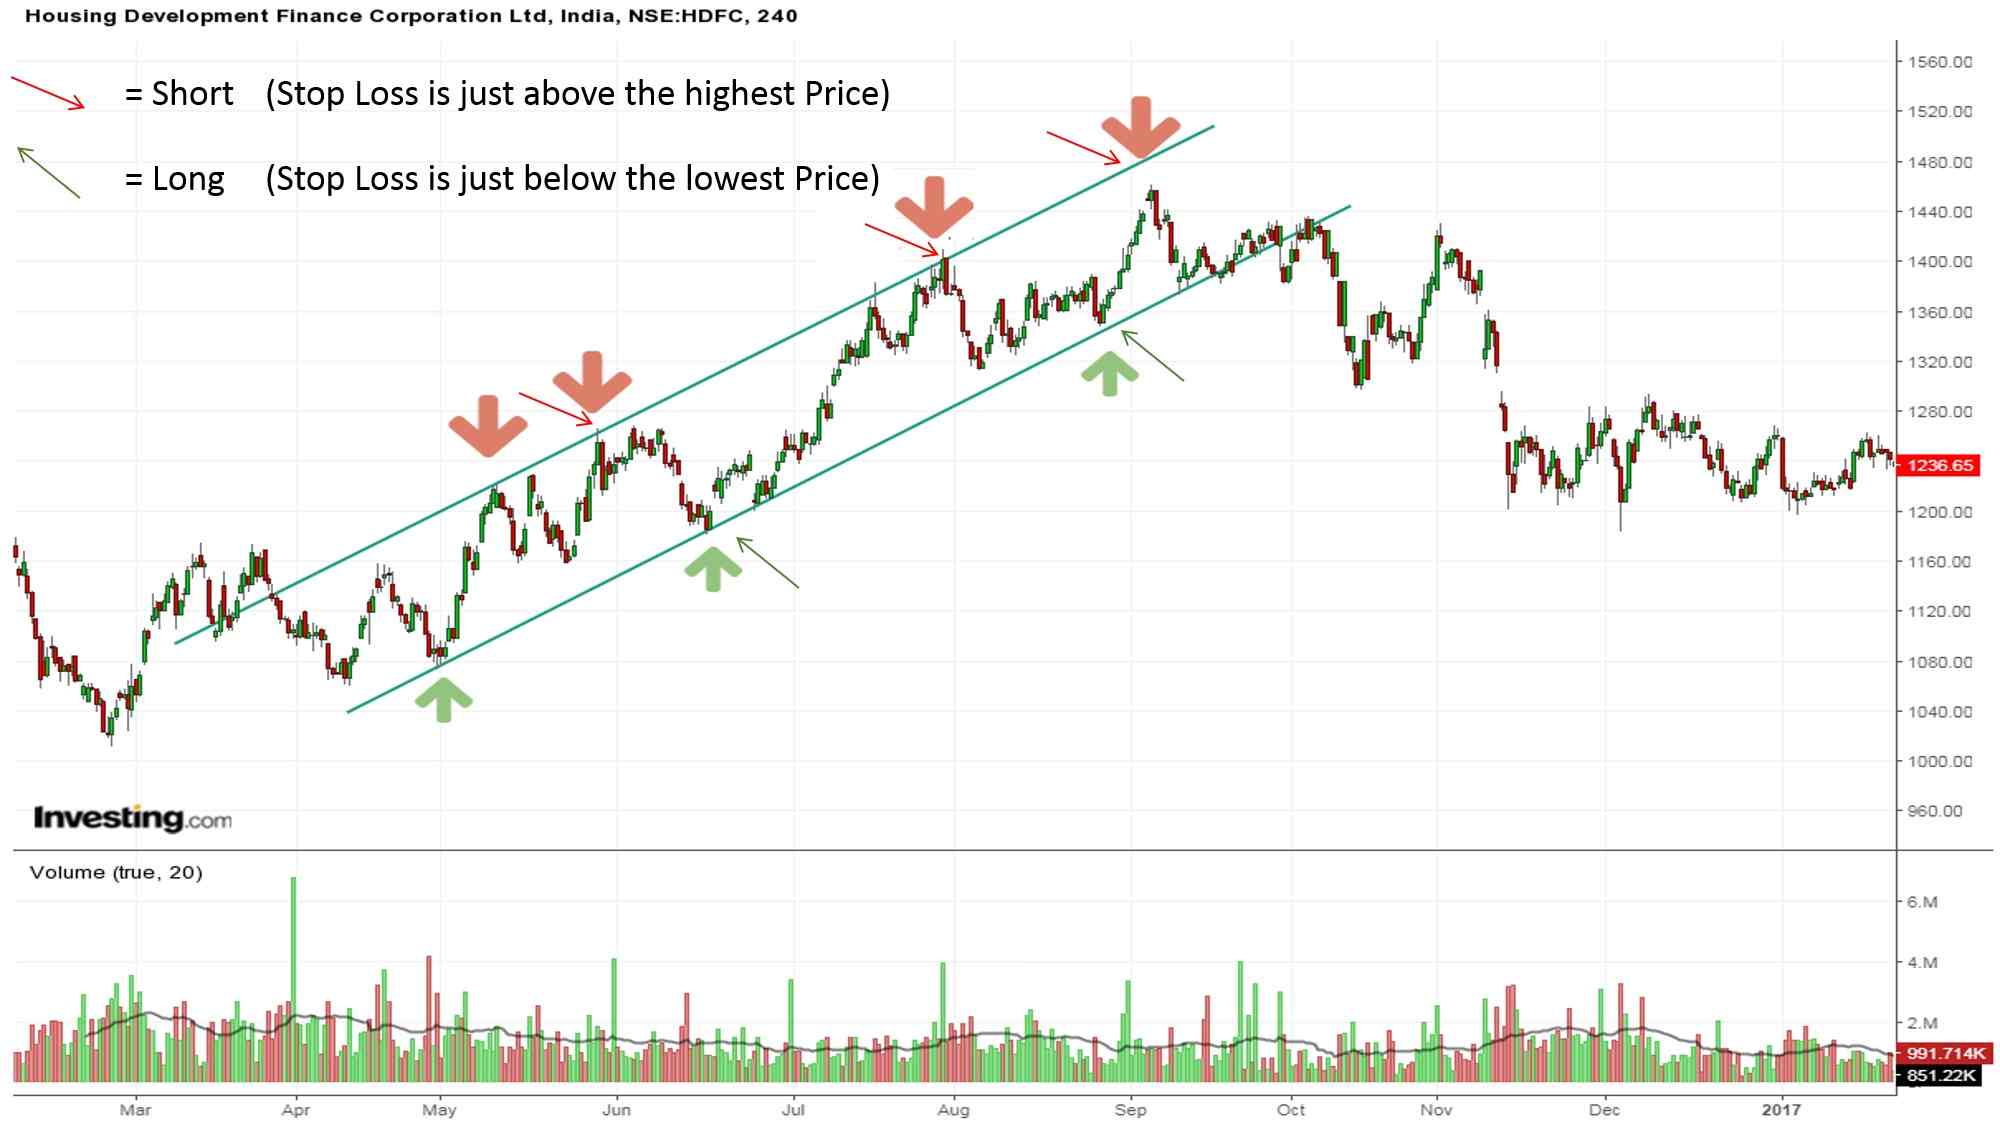
This is the four hours chart of HDFC Ltd. We can see that how wonderfully price followed the channel. When the price begins to fall back after facing the resistance from the 1280 level, we can enter into a short trade from that level. We can make almost 4 trades from the above chart after we get the affirmation of the pattern.
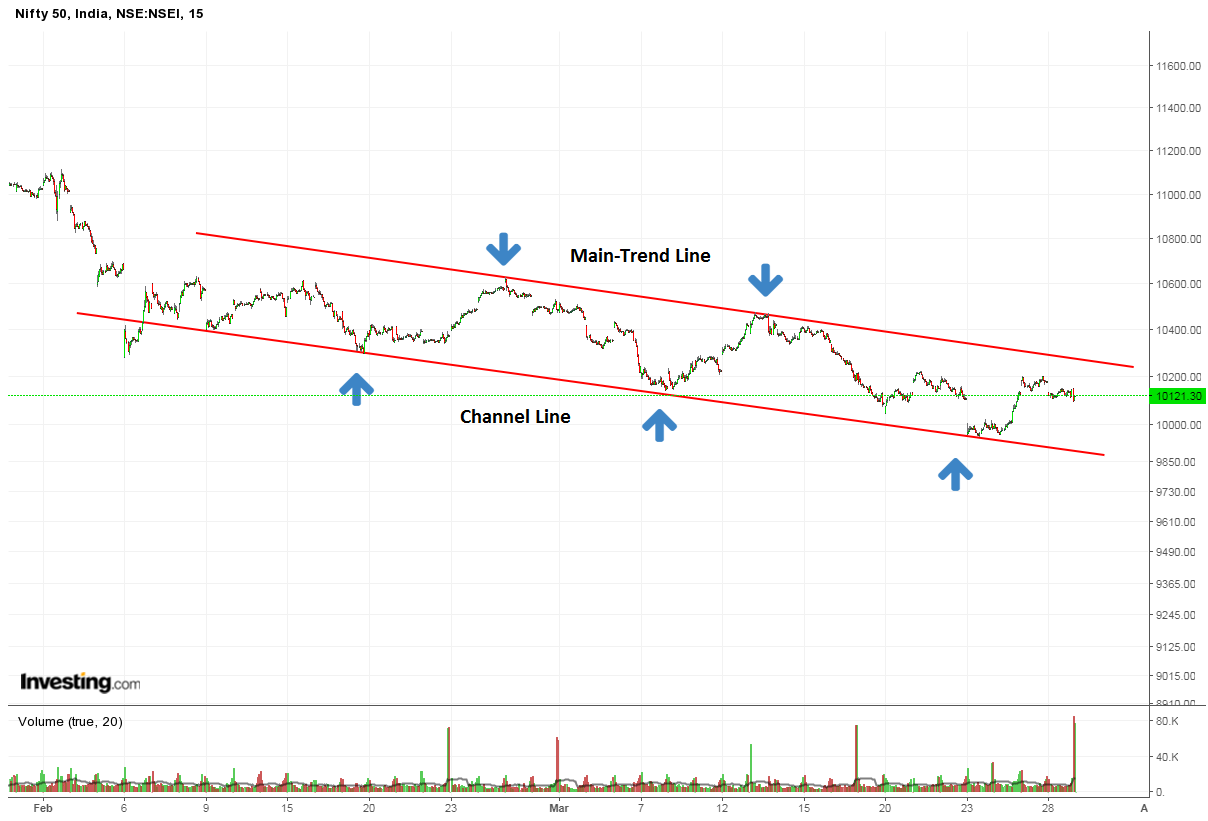
The Bear Trades:
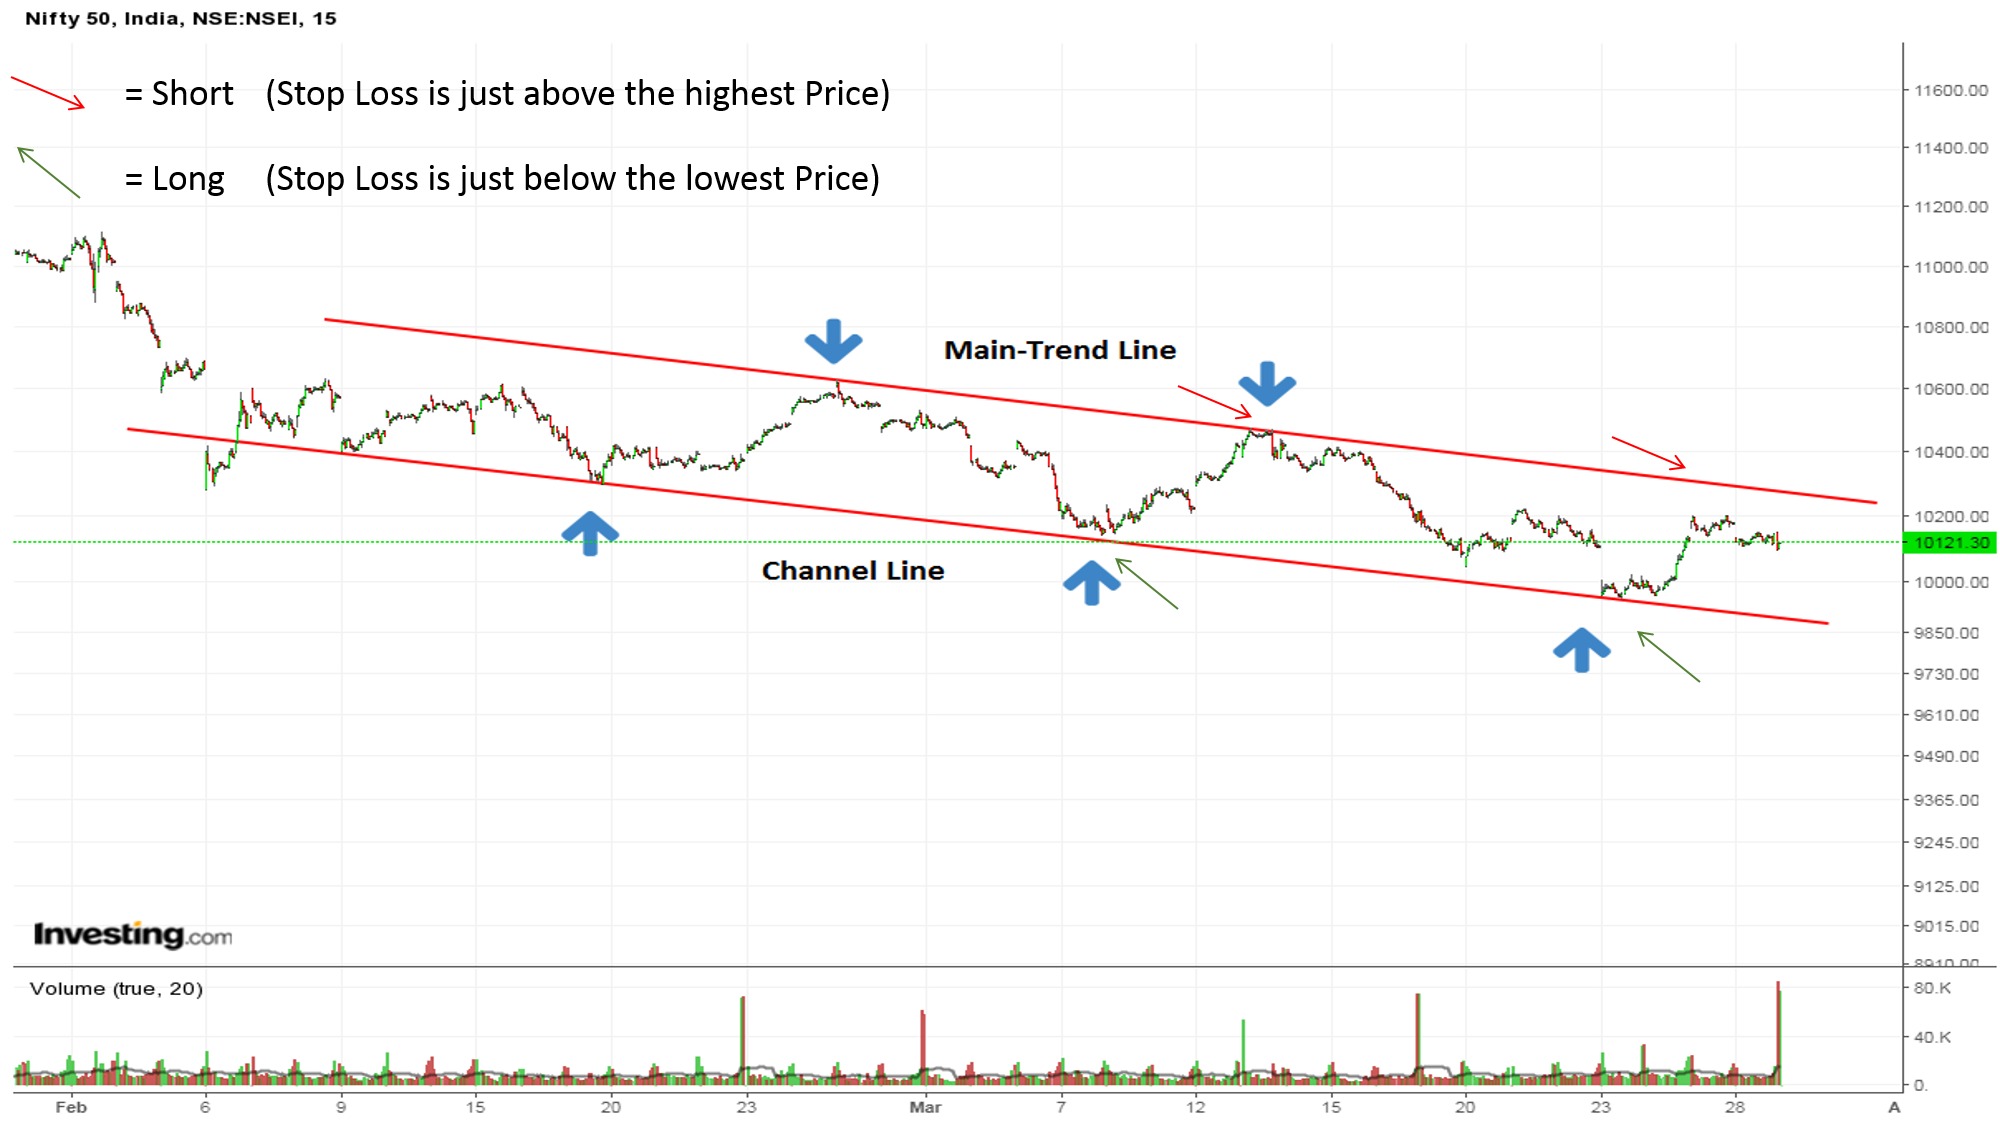
In the above 15 minutes’ chart of Nifty 50, a Bearish Price Channel Pattern has been spotted. This is the most recent chart of Nifty 50 and it is clearly visible that how the price maintains and respects the Main-Trend Line(Resistance) and Channel Line(Support).

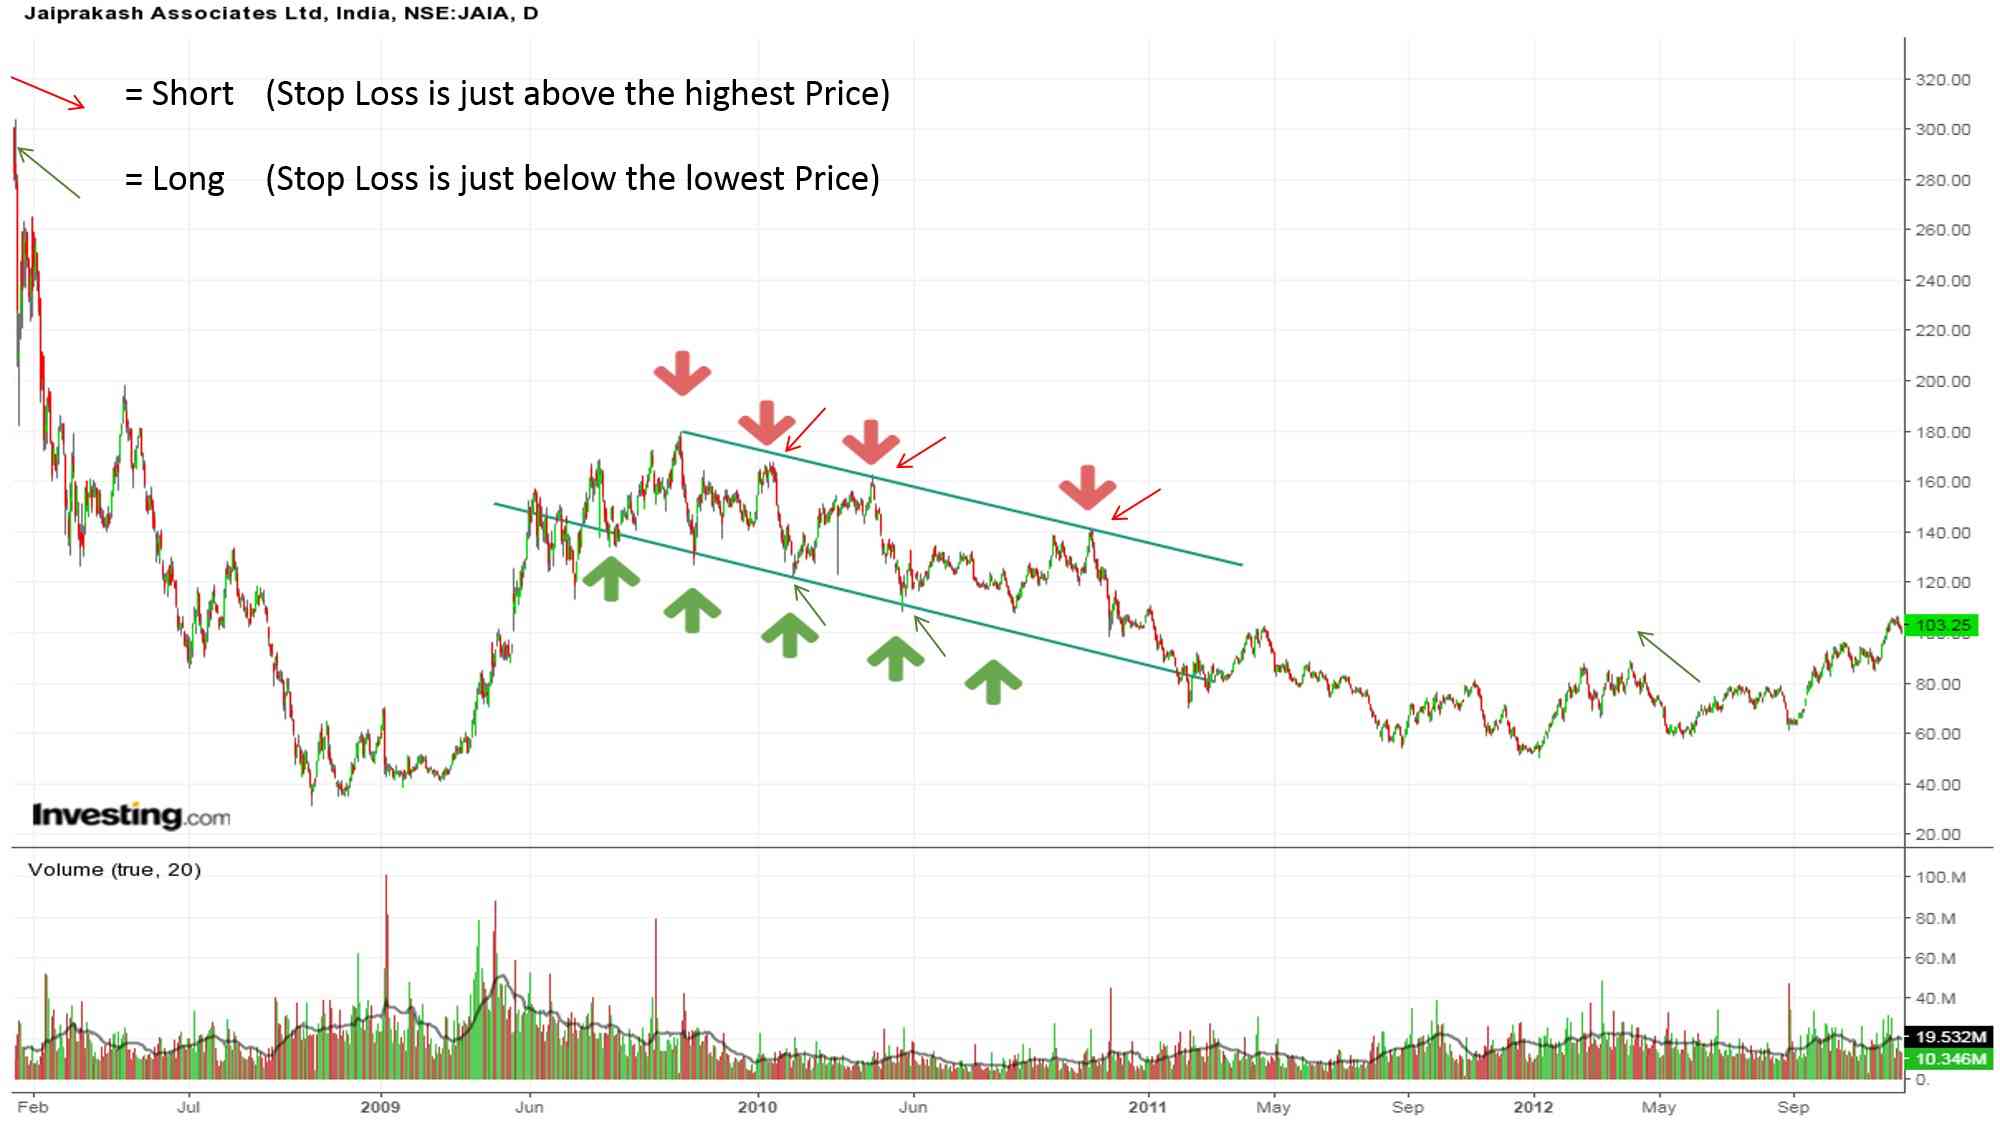
Another Bearish Price Channel has been spotted on the daily chart of Jaiprakash Associates. We get about three short trades and three long trades all throughout that 1year time span.
Horizontal price channel trades:
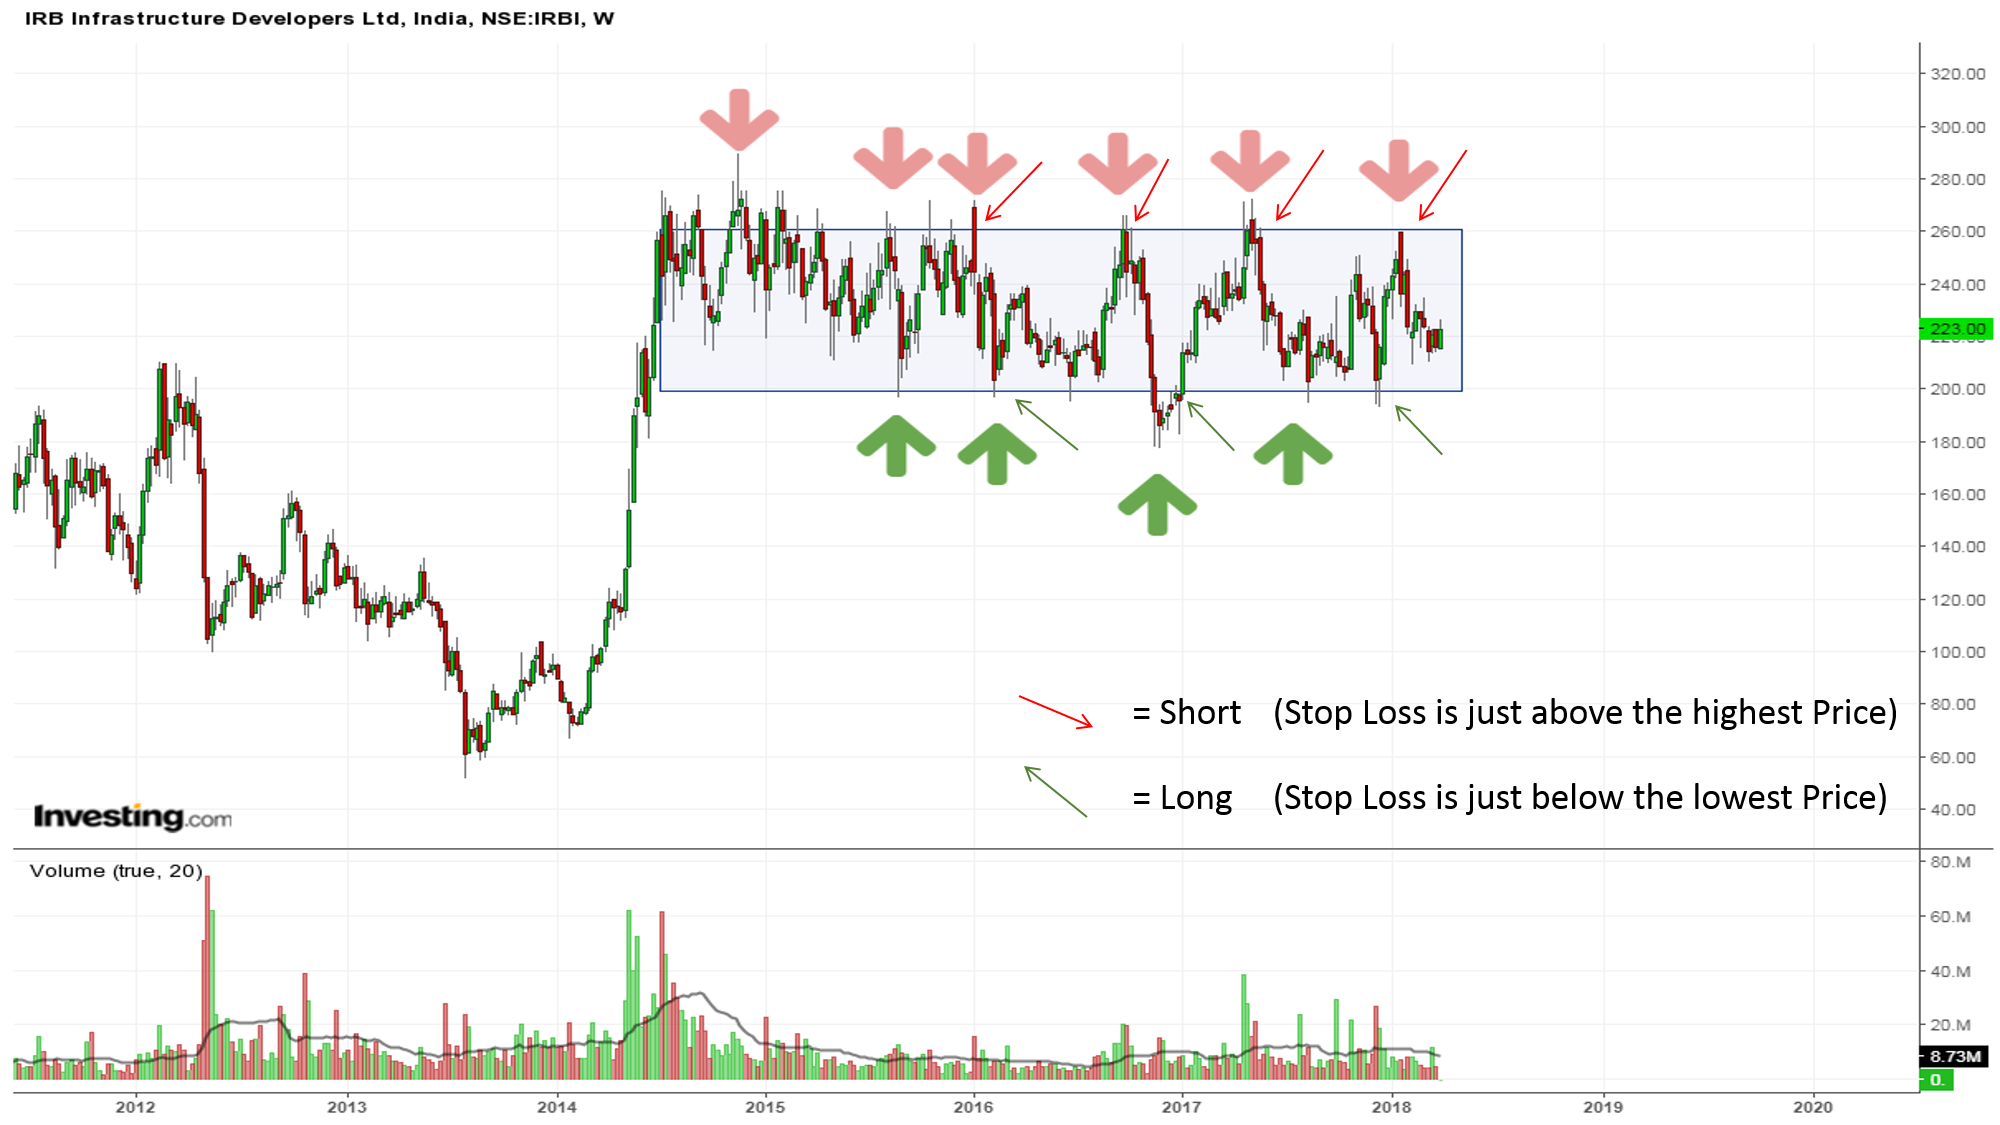
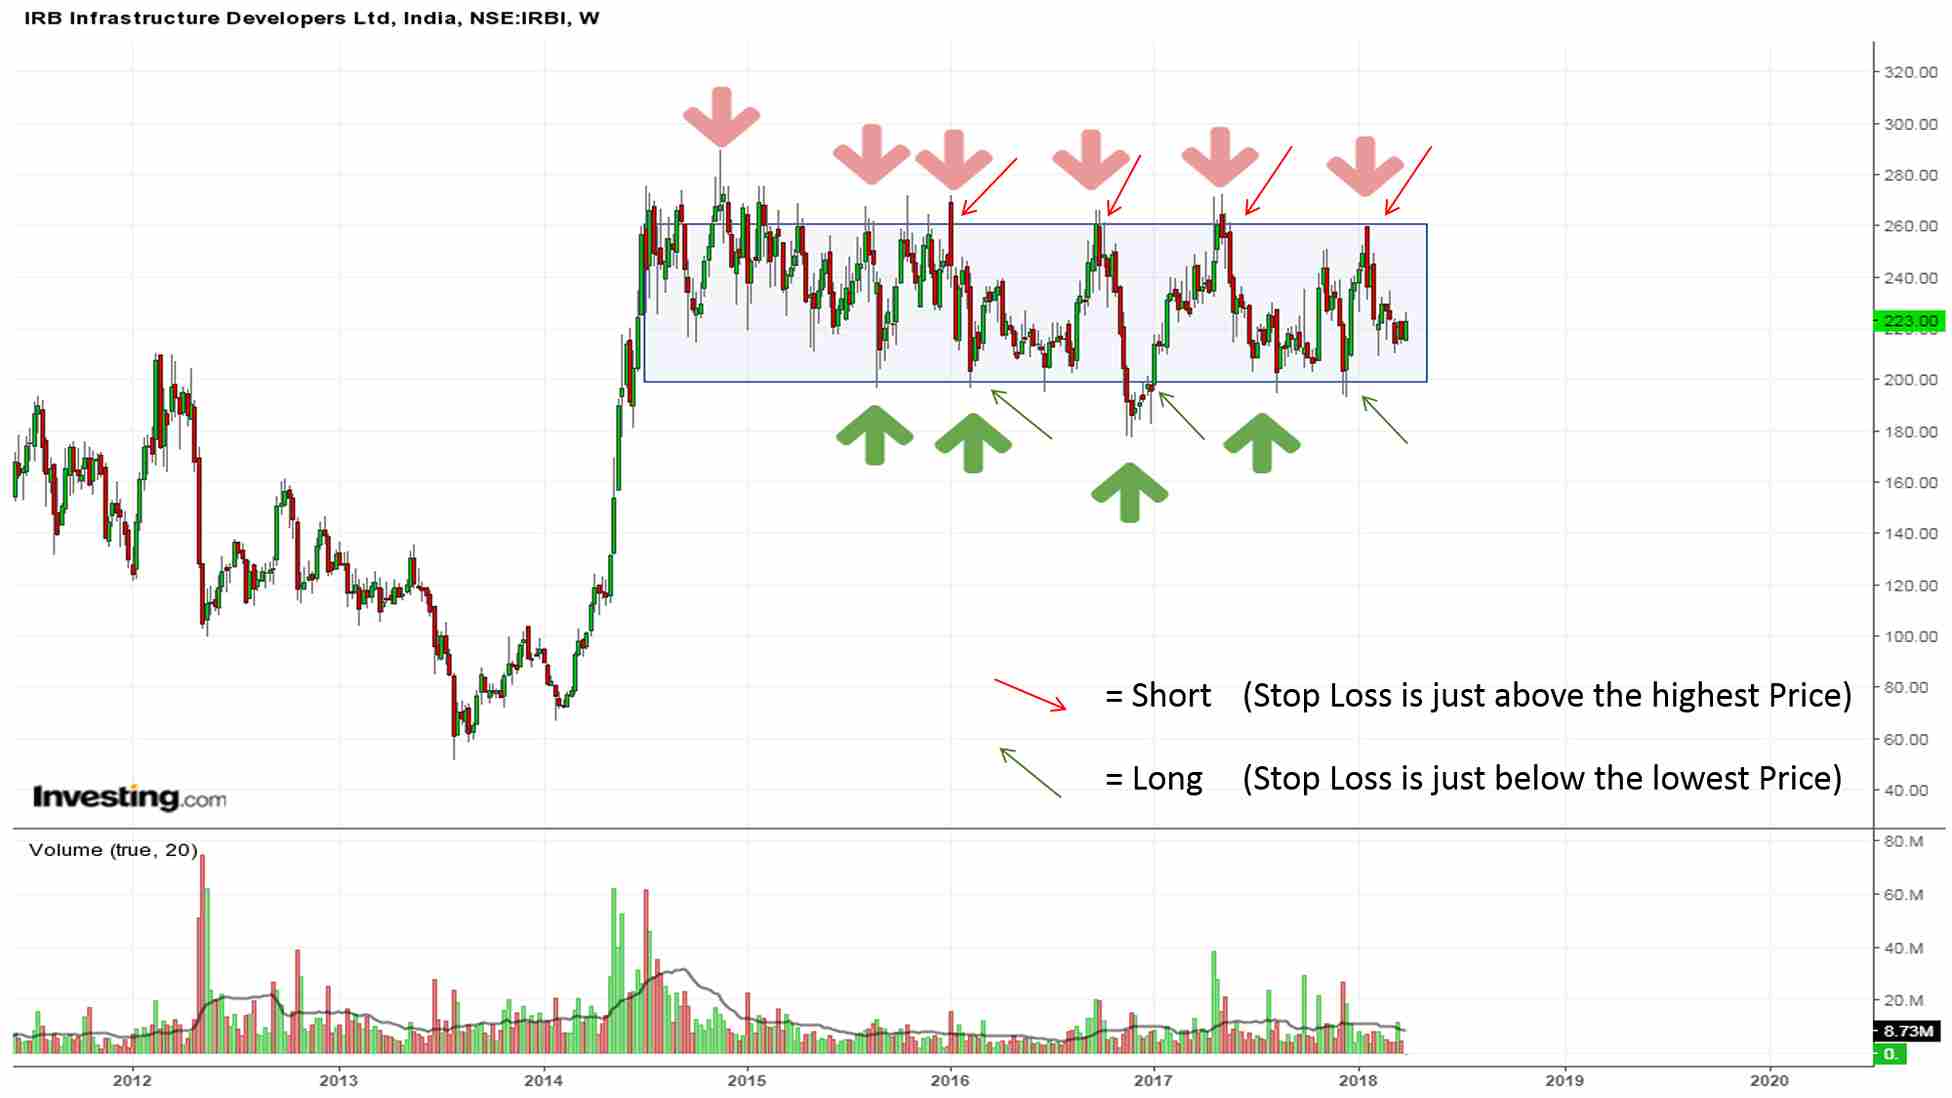
This is the weekly chart of IRB Infrastructure. For the last four years, the stock has been trading in a range-bound zone. See the Green and Red arrows, indicating how many trades it has generated throughout these 4 years. Is it not amazing!
How to predict early Breakouts?
Now we have understood that price has a tendency to respect and maintain its resistance and support line while trading through a price channel pattern. But whenever the price fails to touch its next resistance level (in case of the bull market)or its support level(in case of the bear market), then this could be a sign of an early breakout.
Price action is the key factor while trading the price channel continuation pattern. We know that for any particular trend, either the price has to make higher highs and higher lows (bull market) or lower highs and lower lows (bear market). Break out takes place when the price diverts from its price channel and starts trading outside of the pattern.
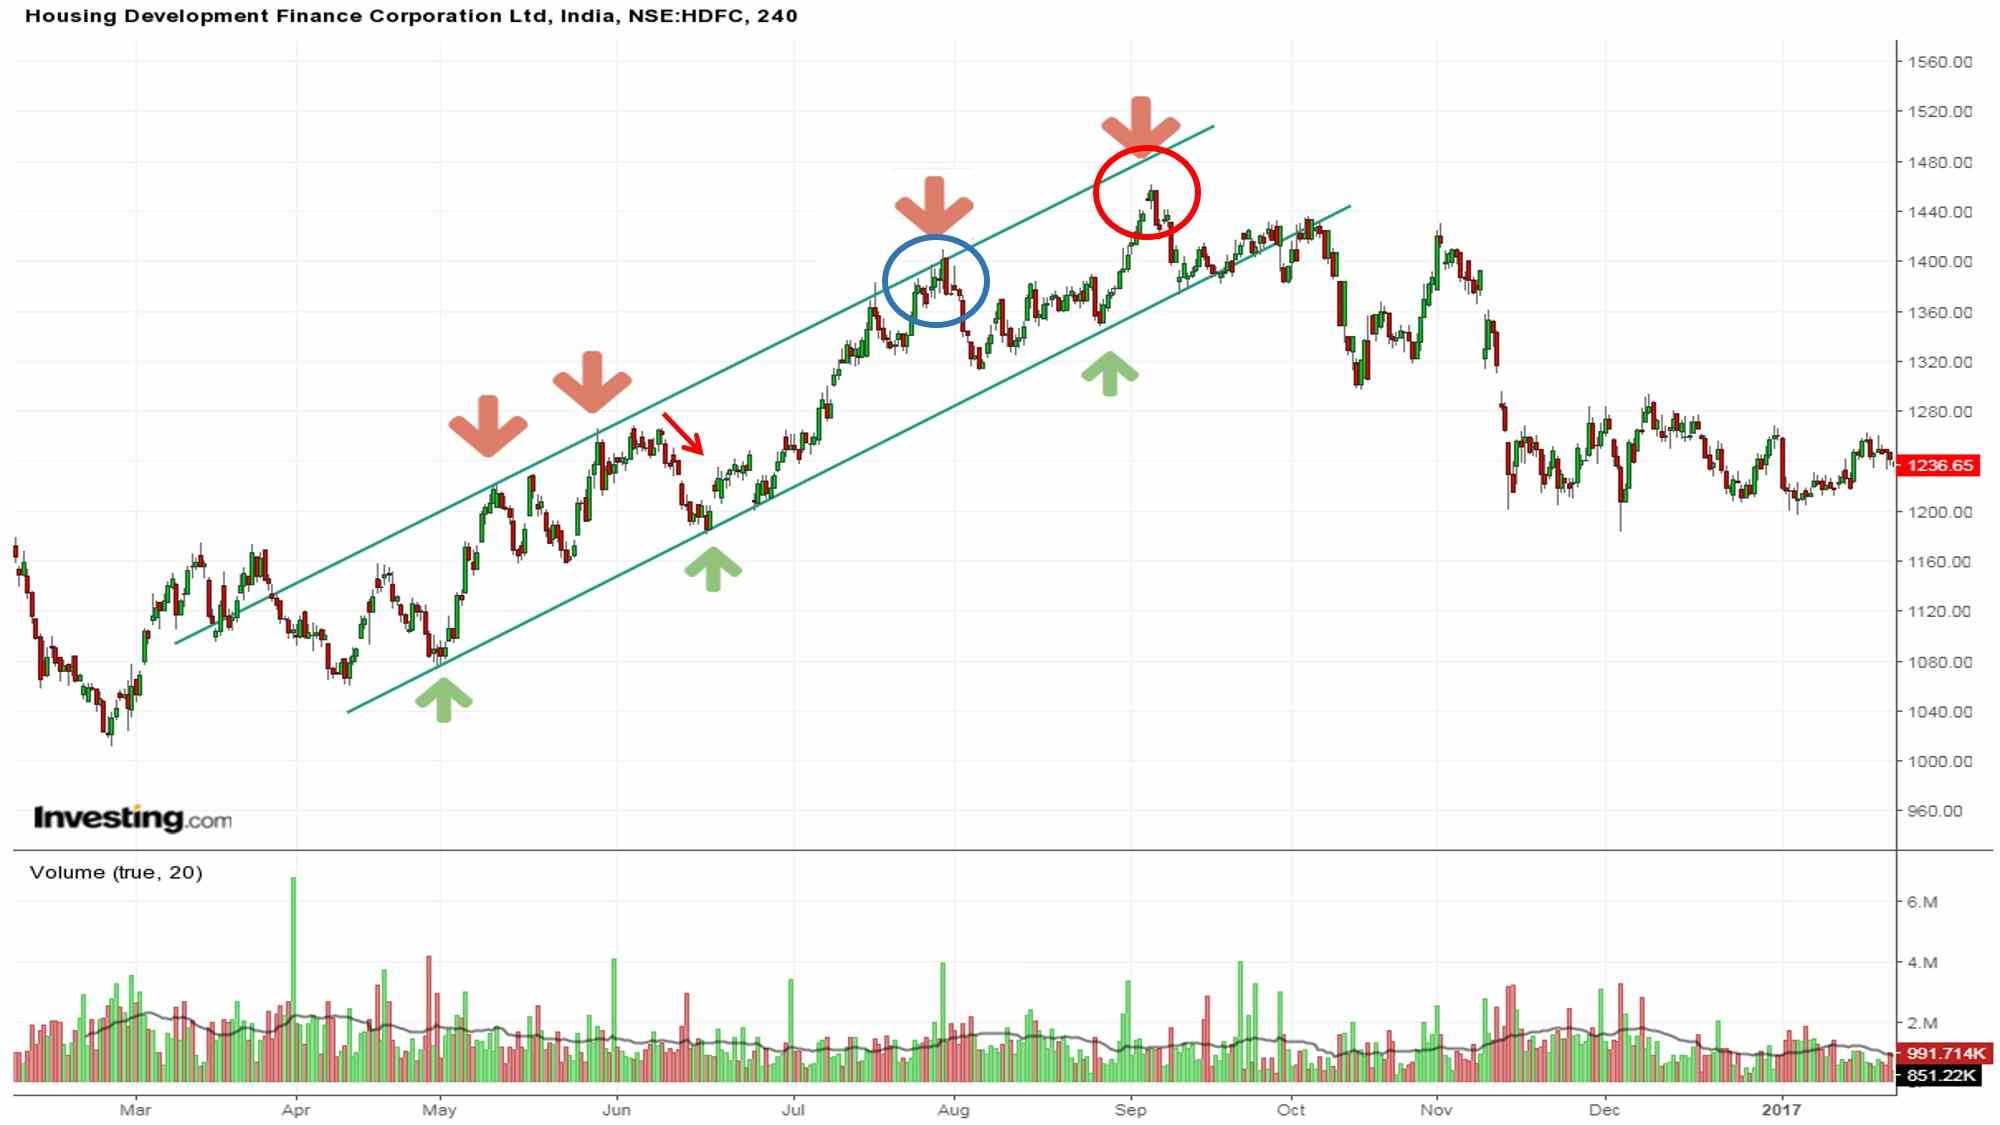
To demonstrate early breakout, we can take the help of HDFC Ltd as an example. We can see that just before June the price started taking shape. From that point onward, the downtrend comes (see the Red Arrow) and we get a trace of this price channel. It is unmistakably noticeable that each time the price respected its Support and resistance line while trading through the channel. But, at the last swing, it fails to touch the resistance line (red circle). This is an indication of an early breakout.
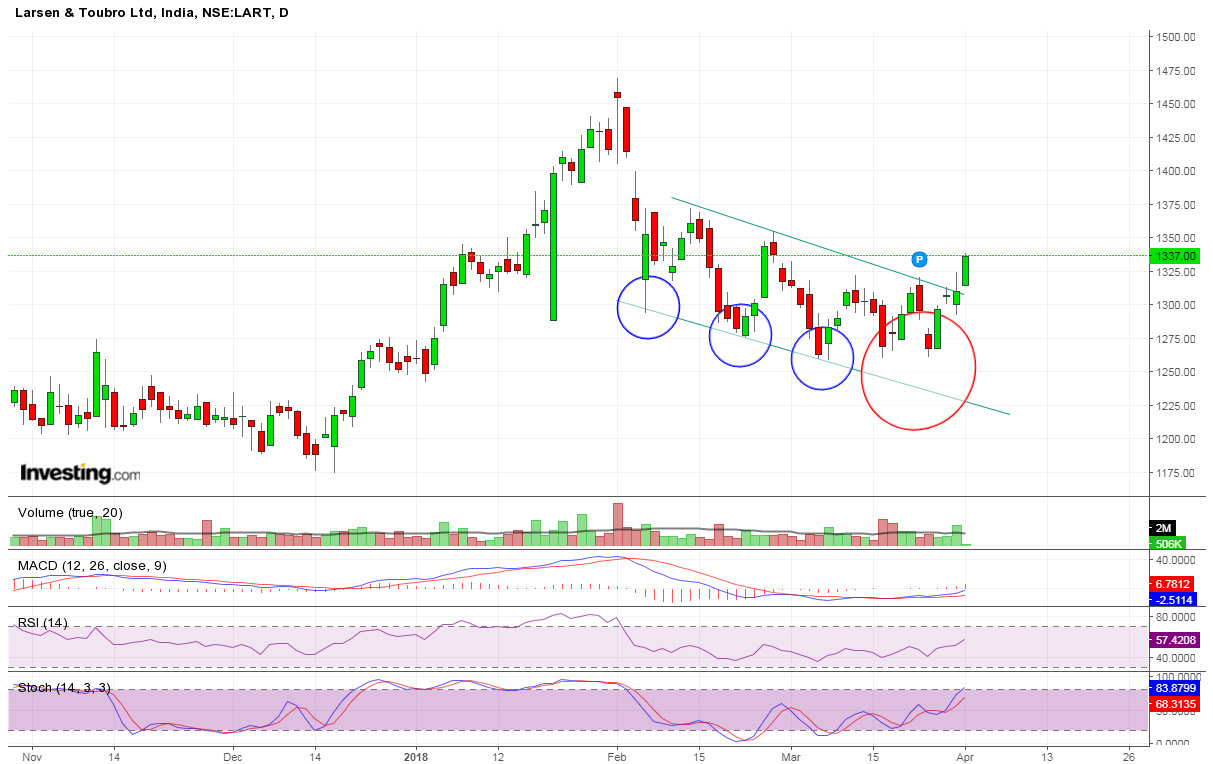
This is a very recent one-day chart of Larsen and Toubro Ltd. Each time price touched its support line (Blue circles) while trading through this price channel. But, in the case of the last swing price neglects the support line (red circle) and give the breakout
It isn’t essential that each time price will give us an indication or sign before giving a breakout. But, if we are able to spot them at the correct time. Then we can make a good trade out of it.
Bottom line:
The best part of the Price channel continuation pattern is that it can be used in any kind of market condition; however, a specific trend has to be there.
Trading the Price Continuation Pattern by only observing the chart may not be helpful. If price action is combined with price pattern it works much better. Sometimes trader uses a logarithmic price scale rather than using linear price scale (because they believe it works more accurately).
As per our choice, we can use any kind of price scale. Using oscillators and indicators also helps us to read the chart better and to get better entry and exit decisions.
In order to get the latest updates on Financial Markets visit https://stockedge.com.


Dear sir
Your Efforts to help us is very good and respectable.
I want to learn more.
Please guide me.
Hi,
We are glad that you liked our post, please refer to our blog on Basic Toolkit for Stock Market Beginners
Thank you for Reading!