“The trend is your friend until the end when it bends.” How many of you have heard this quote? Those who already have, then we are sure that they must already have heard about swing trading too, and those who haven’t, don’t worry! We will decode it for you.
For starters, swing trading is a trading style that helps us capture short to medium-term gains for a few weeks in any stock or financial instrument. Swing traders usually use technical analysis for picking up stocks for swing trading!
But wait! Swing trading shouldn’t be confused with day trading. The main difference between day trading and swing trading is the holding time. Yes! The positions in day trading are closed within the day, whereas the works in swing trading can be carried forward and held for a few weeks to a month.
So, let’s begin today’s blog by understanding what is swing trading-
Table of Contents
What is Swing Trading?
Swing trading is a trading method used by traders who make gains by trading in the trend’s direction. Here, traders make a profit by trading along with the price movements of an asset usually over a few days and weeks.
A swing low is when the price makes a low that is immediately followed by two consecutive higher lows. On the other hand, a swing high is when the price makes a high followed by two consecutive lower highs.
The swing traders analyze market trends by using technical analysis tools such as chart patterns or candlestick patterns, trends, and potential trend reversals in a short timeframe.
One should note that it is different from day trading, as day trading refers to buying and selling of the stocks on the same day, whereas swing trading involves holding the trading position for a few days to a few weeks.
What is the difference between Day Trading and Swing Trading?
Swing trading and day trading may seem the same, but there are major differences between these two trading strategies.
Firstly, the time frames to hold trade are different. Day traders usually square off their trades within minutes or hours whereas Swing traders hold their positions over days or weeks.
Secondly, day trading involves attention as they are constantly searching for new trading opportunities throughout the day.
Whereas swing traders have a few transactions some days so they can periodically monitor their trades.
Thirdly, Day trading is usually done by analyzing price actions and technical indicators whereas swing trading can be done using both technical and fundamental analysis.
Having understood what swing trading means, we will discuss the five main factors that one should consider for swing trading:
What are the Parameters to consider for Swing trading?
Below are some of the parameters to consider for swing trading:
1. Breakouts
As discussed above, swing trading refers to trading with the trend. Thus, the breakout from a range, chart pattern, important resistance and support zones, or reversal candlestick patterns are some technical tools that swing traders should pay attention to.
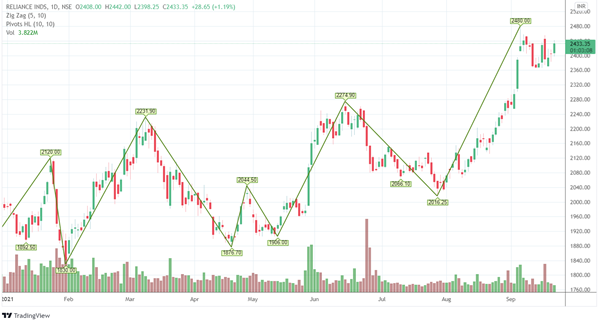
For example, from the weekly chart below of Tata Motors Ltd, one can see a double Bottom formation after a downtrend. Double Bottom is a bullish reversal chart pattern that indicates the stock may reverse to up.
We can see from the above chart that after the breakout from the double bottom chart formation, traders can enter the trade for swing trading and continue until the price objective of the pattern reaches, or the trend ends. However, one should note that the traders should only enter the trader after the breakout, which is confirmed by the volume as shown in the above chart. Thus, swing traders should look out for the breakouts in the stocks for entering a position in the same.
But why volume is so crucial for selecting stocks for swing trading. Well, let us discuss this:
2. Volume
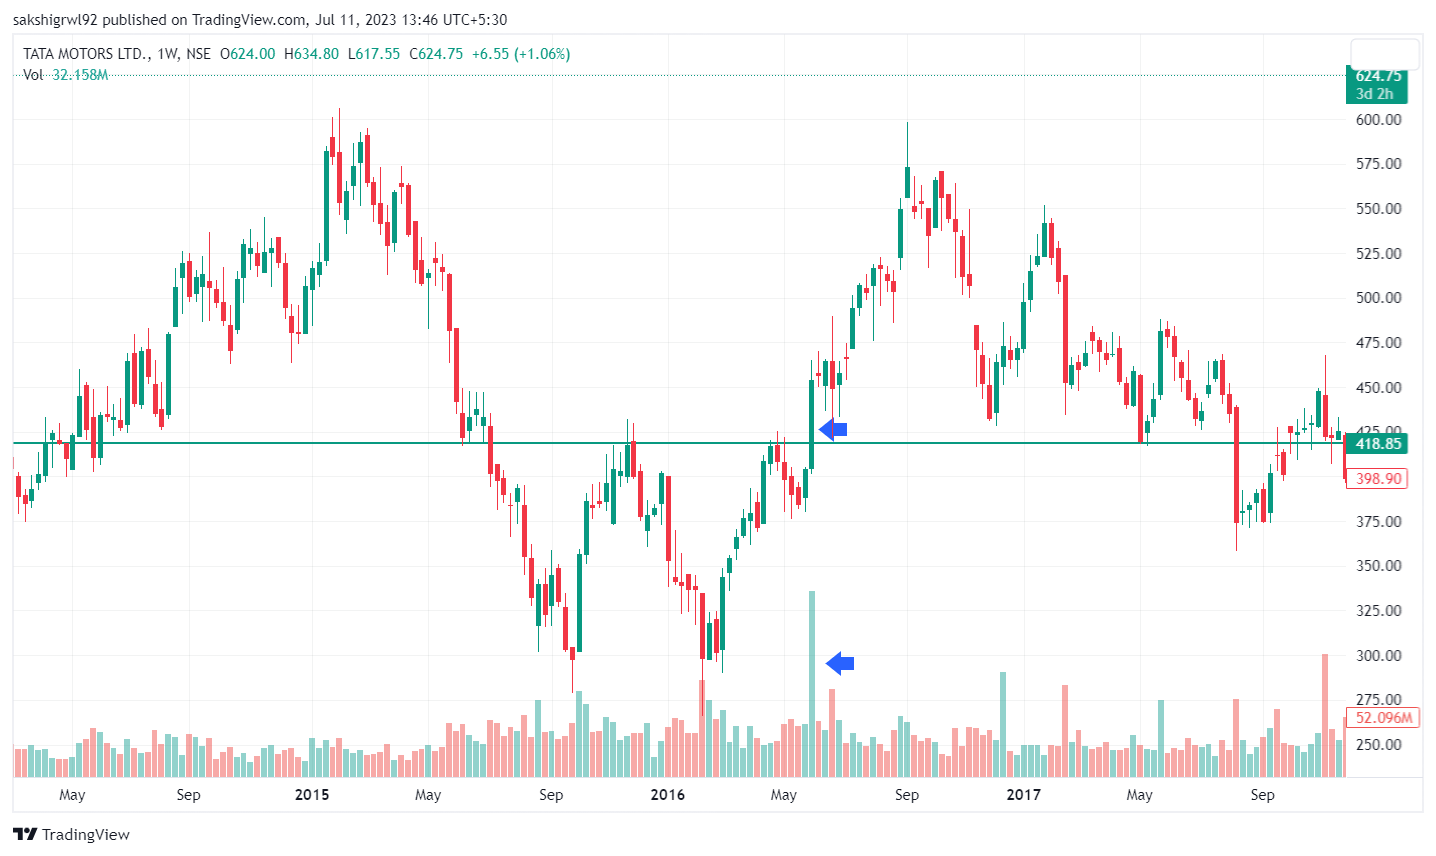
Volume is an essential tool for swing traders as it helps them analyze the strength of a new trend. The main reason behind this is that a trend with a high volume will be stronger than one with a weak volume. In addition, more traders buying or selling gives a better basis for the price action.
The above chart shows that volume is mainly helpful as a part of a breakout strategy. However, breakouts tend to follow a period of consolidation or a chart pattern usually accompanied by low volume; volume spikes when the breakout takes place. Traders can also use volume indicators for analyzing the volume in the stock.
3. Liquidity
One of the most basic rules for swing trading is that traders should only trade liquid stocks. Of course, the daily minimum you select is arbitrary, but the most helpful example is 500,000 shares per day.

This is because one can exit high liquidity stocks quickly and with less risk of a loss from the bid-ask spread. More liquid stocks generally show lower bid-ask spreads. One should note that recognizing a bad trade or potential loss requires discipline that is one of the main tents of swing trading. Thus, swing traders can quickly exit a trade when stocks are liquid.
4. Relative Strength
One should select stocks that are relatively stronger than the sector or the index for swing trading. This measure helps us identify both the strongest and the weakest securities or any asset classes within the financial market. Usually, the stocks which display strong or weak RS over a given period tend to continue going forward.
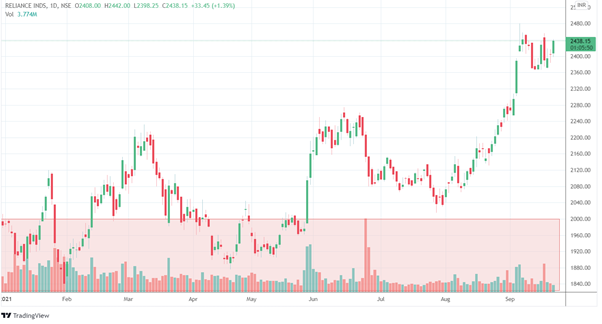
5. Volatility
Volatility is one of the major factors in selecting stocks for swing trading. Volatility helps us to measure how much the stock price will move. Traders can use volatility indicators such as Bollinger bands or ATR to gauge how volatile the stock is. Swing traders should select stocks for trading that are volatile. Large moves are generated by volatile stocks and give us a reasonable window for stops and profits.
By now you must have understood what is swing trading all about, now let us discuss the 5 Most Used Swing Trading Indicators that are used by swing traders for identifying swing trading opportunities:
What are Swing Trading Indicators?
Now let us discuss 5 swing trading indicators that can be used for swing trading–
1. Moving Averages
Moving averages are simply the average of the stock prices over a given period and smoothen out any erratic short-term spikes.
They are referred to as the lagging indicators as they don’t look back over past price action. Thus, Moving Averages are mainly used for confirming trends and used in swing trading.
Moving Averages can be categorized into short-, medium- or long-term, based on the number of the periods such as 50- or 200-days moving average. Moving Averages are mainly of two types–
Simple moving averages, which take all the closing prices of a specific period and average them out, and Exponential moving averages that give more weightage to the price which is closer to the current date.
Having discussed the basics of moving average, let’s see the use of this indicator in swing trading-
Swing traders use moving averages when a market’s short-term Moving Average crosses a longer-term Moving Average indicating that a change in momentum is taking place. When a faster Moving Average crosses a slower Moving Average from below then it indicates a bull move. When a faster Moving Average crosses a slower one from above, then the momentum may be reversing to a bearish move.
2. Volume
Volume is an important indicator in swing trading as it tells us about the strength of the ongoing trend. Usually, a trend with high volume is stronger than one with a weak volume. As more traders buy or sell, it forms a better basis for the price action.
Volume is crucial when there is a breakout in the trend. Generally, breakouts follow a period of consolidation accompanied by low volume. So, when the breakout occurs the volume spikes.
There are different types of volume indicators that signal whether the volume is rising or falling in the stock.
3. Relative Strength Index
Momentum Indicators are popular among swing traders and especially Relative Strength Index, which shows whether the stock’s prices are in the overbought or the oversold zone.
Usually, when the prices are above the 70 level, then we considered it in the overbought zone, on the other hand when the prices are below the 30 levels, it is considered to be an oversold zone.

When the prices are in the overbought zone, it usually indicates the prices may reverse to the downtrend, and when the prices are in the oversold zone, it usually indicates the prices may reverse to an uptrend.
Thus, this indicator can be used in swing trading, as it tells us when the trend is going to reverse.
4. Stochastic Oscillator
The stochastic oscillator is another type of momentum indicator that works almost similarly to the RSI. This indicator compares the closing price of a stock to the range of its prices over a particular period.
Like the RSI, the stochastic oscillator also shows the overbought and oversold zone. In this case, 80 is usually considered as overbought while under 20 is oversold. However, it comprises 2 lines, unlike RSI. One shows the current value of the oscillator whereas the other shows a three-day MA.
5. Ease of Movement
Ease of movement is a momentum indicator that indicated the relationship between the rate of change in an asset’s price with its volume and can be used as a swing trading indicator. It is usually used in the daily chart and larger timeframes.
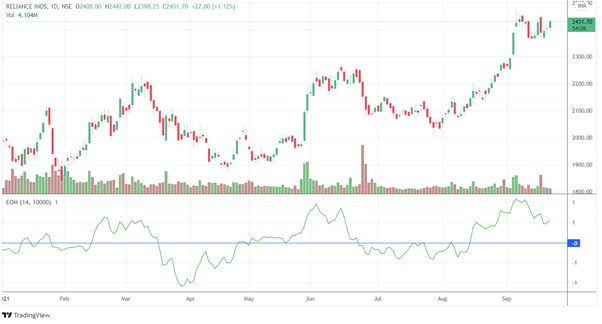
This indicator is plotted on a chart with zero as the baseline. So, when it rises above zero, then it’s indicating that the market’s price is advancing with relative ease and when there is a further EOM rise, the more easily the price will advance. As EOM falls below zero, then it indicates that the market is falling with increasing ease.
We’ve helped you identify the most used swing trading indicators that are used in swing trading and guide us in identifying opportunities for swing trades. Let’s move on to an open secret through this blog. Trust me, you are going to love this!
What are Swing Trading Strategies?
In this type of trading strategy, a trader makes a profit from the move or the swing in the movement of the price in a specific direction.
Before going to the strategies, you should understand the following terms:
- Entry Point: It the point where the traders enter their trade position that can be determined by technical indicators.
- Exit Point: It the point where the traders square off their trade position that can be determined also by technical indicators.
- Stop Loss: Placing a stop loss is very important as it helps the traders to incur fewer losses.
One should also note that these strategies can only be applied to the trending market.
Now let us discuss different technical indicators that can be used to enter or exit swing trading:
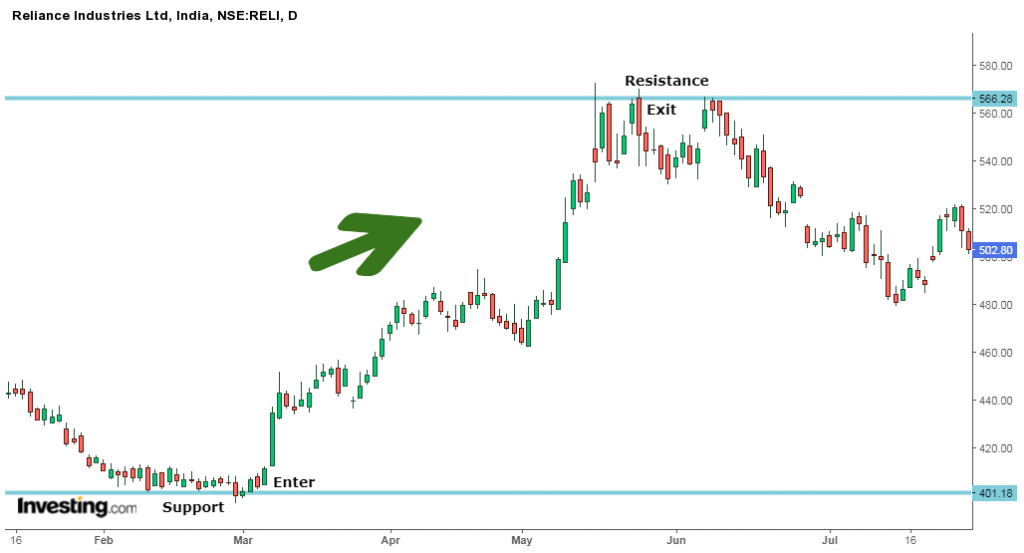
1. Support and Resistance
Support is the region where there is enough buying pressure to make the prices bounce back to an upward direction and it results in a reversal from a downtrend to an uptrend.
A trader can enter a buy position when there is a bounce-back of the prices from the support level.
Similarly, Resistance is the region where there is enough selling pressure to make the prices bounce back to the down direction and it results in a reversal from an uptrend to a downtrend.
A trader can exit a buy position or enter a sell position when there is a bounce-back of the prices from the resistance level.
Below is the daily chart of Reliance Industries Ltd that shows us how Support and Resistance helping us in entering or exiting our swing trade:
2. Moving Average
Swing Traders can use Simple Moving Average (SMA) 10 and 20 for finding the entry and exit points for their swing trading.
When the SMA 10 crosses SMA 20 from below there is a bullish crossover and when the simple moving average 10 crosses SMA 20 from above there is a bearish crossover.

When there is a bullish crossover, a swing trader can enter a buy position and when there is bearish crossover trader can exit the position as shown in the below chart of Infosys Ltd:
3. MACD Crossovers
MACD Crossovers is one of the most popular indicators that is used for determining the trend direction and reversals.
The MACD consists of two moving averages which are the MACD line and the signal line. The buy and sell signals are generated when these two lines cross each other.
When the MACD falls below the signal line, it is a bearish signal which indicates that it may be time to sell.
Similarly, when the MACD rises above the signal line, the indicator gives a bullish signal, which suggests that the price of the asset is likely to experience upward momentum.
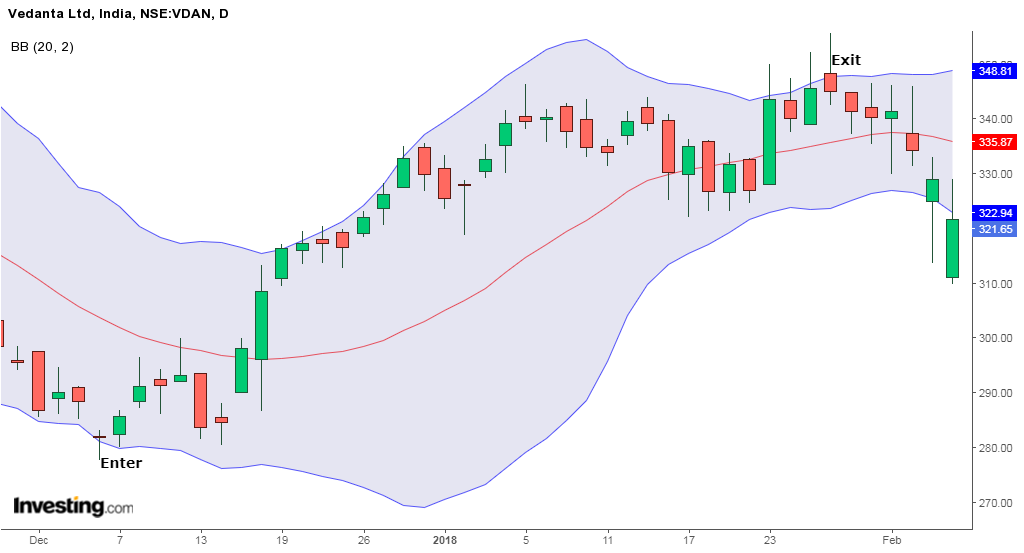
4. Bollinger Bands
Swing trading with the help of Bollinger bands is one of the most popular techniques.
One can use this indicator to find out trades for swing trading in the following ways:
- One should wait for the prices to touch the lower band.
- Candlesticks can also be analyzed to enter the buy position once it touches the lower band.
- Further trend confirmation is made when the prices pass the middle band.
- Exit your position when the prices touch the upper band and reverse into a downtrend.
Below is the example of daily chart of Vedanta Ltd. that will help you to understand the above points:
5. Fibonacci Retracement
The Fibonacci retracement pattern can also be used for identifying support and resistance levels, as well as the reversal levels.
Fibonacci ratios such as 23.6%, 38.2%, and 61.8% can be used as potential reversal levels.
A swing trader can enter a sell position if the price in a downtrend retraces to and bounces off the 61.8% retracement level that acts as a resistance level.
They can exit the sell position when the price moves down and bounces off the 23.6% Fibonacci line that acts as a support level.
In addition to these technical analysis indicators as discussed above, one should also know fundamental analysis as well.
Remember to place stop loss in your swing trades as it will help you to reduce your losses if the trades do not go in your favor.
How to use StockEdge Strategies to find stocks for Swing Trading?
In StockEdge, there are ready-made bullish as well as bearish swing trading strategies as shown below:
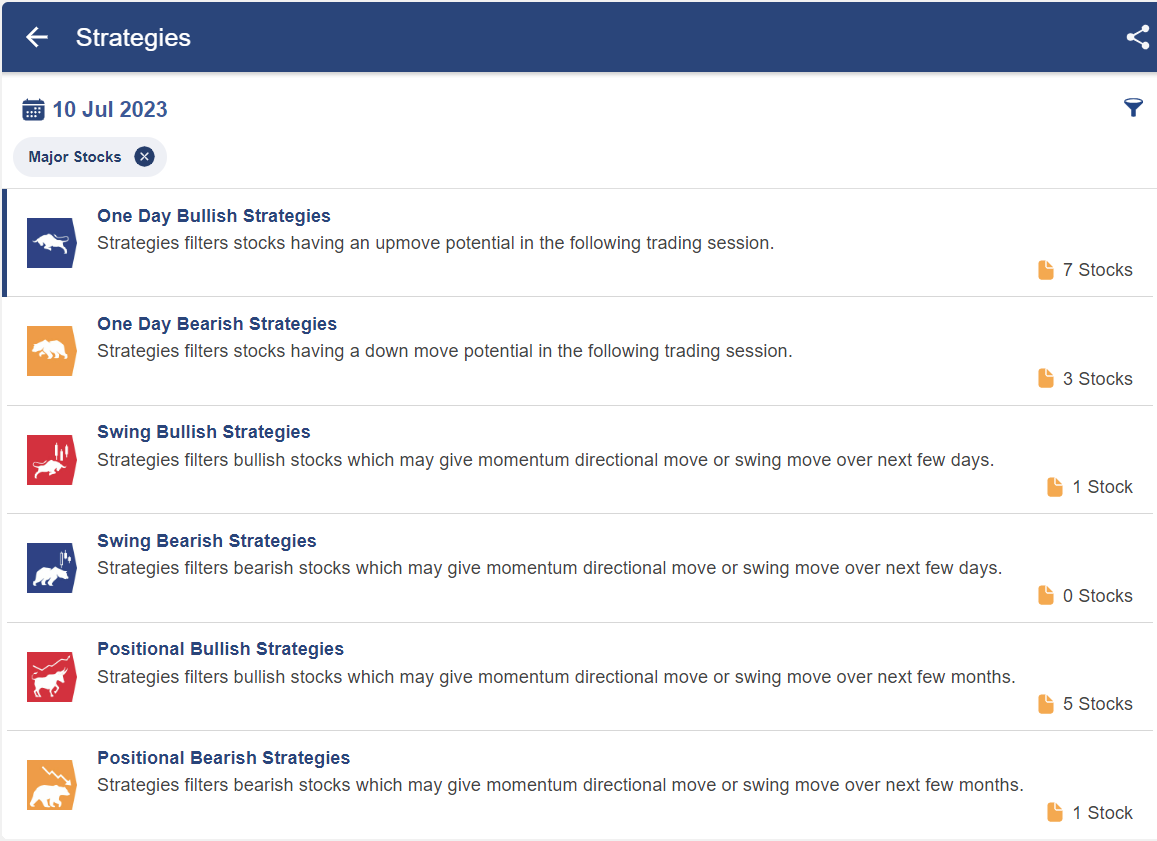
After clicking on any of the bullish or bearish strategies, traders will get a list of strategies that they can use for entering a position for swing trading:
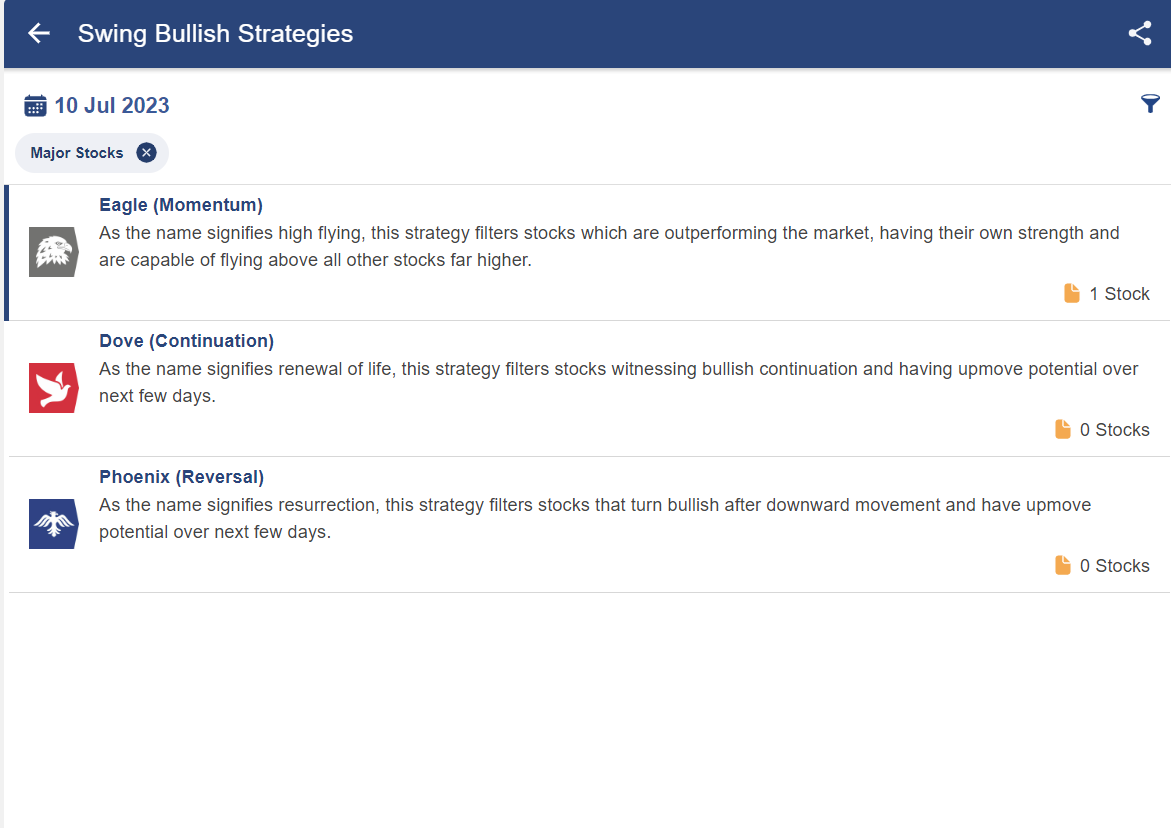
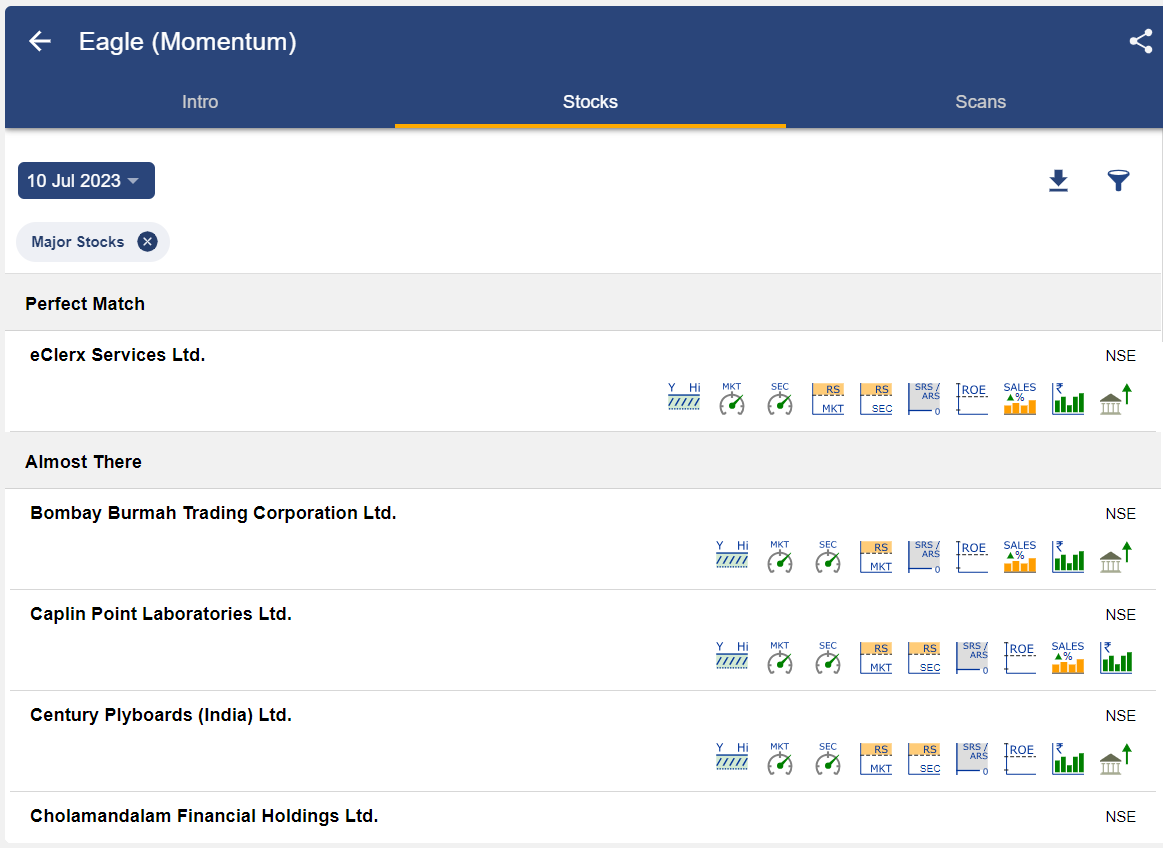
After clicking on any of the above strategies, traders will get a list of stocks as shown below:
You can also do Masterclass on Advanced Technical Strategies
Bottomline
Swing trading is perfect for those traders who don’t have the time to sit on the trading screen throughout a day’s trading session. They can combine swing trading with their 9-5 job or any other business so that they can generate a separate source of a consistent cash flow for themselves. With a good strategy and proper risk management, one can expect to make good returns from swing trading.
Also, with swing trading, one doesn’t need to put one’s capital in a bad stock for a long time, unlike in a long-term investment. One can simply book a loss and move their capital to another stock if that trade goes wrong. Always remember while engaging in swing trading– “The Trend is your friend”.
Frequently Asked Questions (FAQs)
Is swing trading still profitable?
There have been estimates that as many as 90% of swing traders lose money or break even when trading the stock market. This means that 10% of swing traders actually make a profit over the course of a year or the average swing trading success rate.
Is swing trading effective?
Swing trading is profitable, and you can undoubtedly outperform the market over an extended period of time. To do this, though, you’ll need a solid trading plan and the resolve to stick with it through the ups and downs.
Is swing trading better for beginners?
Swing trading is frequently seen to be better for novices than scalping or day trading. Swing trading demands less trading knowledge and skill. Additionally, swing trading typically takes less time because it doesn’t require a trader to actively scan positions.
Is swing trading safer?
Even while swing trading is subject to gaps over the weekend and on holidays, it is generally thought to be less dangerous than day trading. Swing trading is safer for a variety of reasons, including the flexibility to trade part-time, lower trading expenses, and others.


Thanks for sharing Article.
Hi,
We really appreciated that you liked our blog! Thank you for your feedback!
Keep Reading!
Great content thank u, want some thing on open interest, volatity and deliver for f&o for intraday strategy. Great fan of Vivek sir and really appreciate his work. Hats off to stock edge team and eleanmarket .
Hi,
We really appreciated that you liked our blog! Thank you for your feedback!
Keep Reading!
good article useful for employers
Hi,
We really appreciated that you liked our blog! Thank you for your feedback!
Keep Reading!
Useful articles. Keep sharing these type of knowledgeable advices.
Hi,
We really appreciated that you liked our blog! Thank you for your feedback!
Keep Reading!
xlent, helps very much to spread the Education. More Information Required to use your App.
Hi,
We really appreciated that you liked our blog! Thank you for your feedback!
Keep Reading!
got lot of knowledge of Technical Analysis.
Hi,
Thank you for Reading our blog!!
You can also join our course on Technical Analysis to gain more insights on this subject