Elearnmarkets - Financial Market Learning
  • Categories
    • Basic Finance
    • Derivatives
      • Futures
      • Options
    • Financial Planning
    • Fundamental Analysis
    • Technical Analysis
    • Marketshala
    • Miscellaneous
  • Language
    • English
    • Hindi
    • Bengali
No Result
View All Result
  • Courses
  • Webinars
  • Stories
Elearnmarkets - Learn Stock Market, trading, investing for Free
No Result
View All Result
Home Technical Analysis
steps to identify gartley pattern

Gartley Pattern – Steps to Identify it with entry rules

Elearnmarkets by Elearnmarkets
August 25, 2023
in Technical Analysis, Charts, Patterns & Indicators
Reading Time: 5 mins read
3
7.5k
VIEWS
Share on FacebookShare on XShare on WhatsApp

There are many forms of trading in the stock market amongst which Harmonic patterns have altogether a different approach to trading. Gartley pattern was developed by H.M. Gartley which was written in his book- “Profits in the Stock Market”.

This pattern has also been widely accepted amongst the trader’s community due to its high success rate and good risk-reward ratio attached to it.

Table of Contents
What is Gartley Pattern?
Examples of Gartley Pattern with entry rules
Target and Stoploss
Key Takeaways

What is Gartley Pattern?

Gartley pattern is one of the most commonly used harmonic patterns and can be used in various timeframes.

This may act both as a continuation pattern, which helps in predicting whether the price will resume its original trend post retracement or as a reversal pattern based on its prior move and accordingly it can be used to access a bearish or a bullish move.

The pattern appears quite frequently in a chart and thus it gives a quite useful form of analysis.

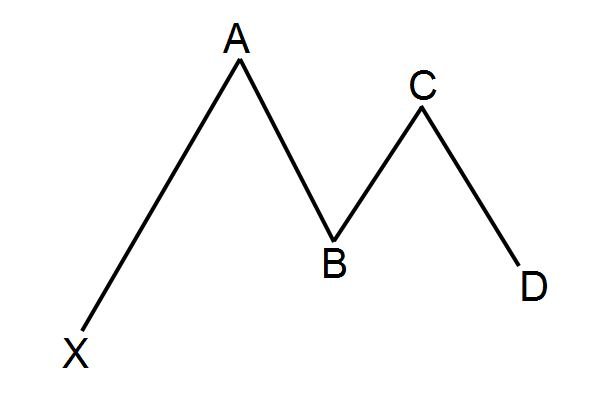
The gartley pattern is a 5-point structure that was originated and outlined by HM Gartley and later further detailed by Scott Carney.

The pattern has a specific Fibonacci value for each point in the structure except for point D which is not a point but rather a zone from where the price is likely to reverse, popularly known as Potential Reversal Zone (PRZ).

RelatedPosts

Beginner's Guide to Trading Penny Stocks 1

Beginner’s Guide to Trading Penny Stocks

September 26, 2023
77
5 Important Volatility Indicators that Traders should know 2

5 Important Volatility Indicators that Traders should know

September 19, 2023
58.1k
Top 5 Momentum Indicators that Analyses Trend Strength 3

Top 5 Momentum Indicators that Analyses Trend Strength

September 7, 2023
93.6k
Gartley pattern

Examples of Gartley Pattern with Entry rules

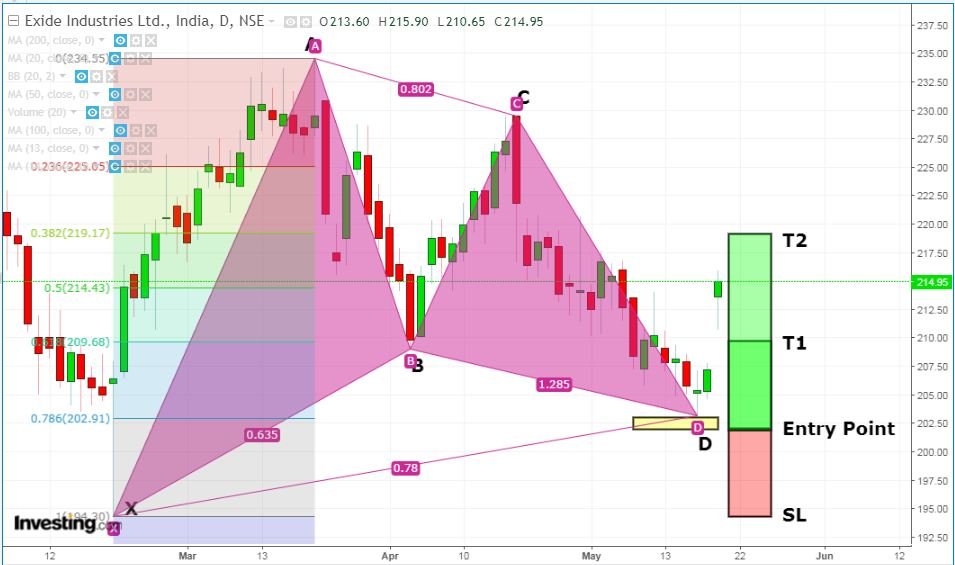
Example 1: Exide Industries (Reversal pattern)

Gartley pattern example - Exide Industries Ltd.

The above is an example of reversal using Gartley pattern in the daily chart of Exide Industries. The above pattern is drawn using XABCD tool in Investing.com.

However, in order to qualify as a Gartley pattern, the following rules should be qualified:

  • Point B retracement of the original XA leg should lie between 0.618 and 0.786 level. In the above example, 0.618 level comes at 209.68 and Point B comes at 209; so it qualifies the above rule.
retracement example - Exide Industries Ltd.
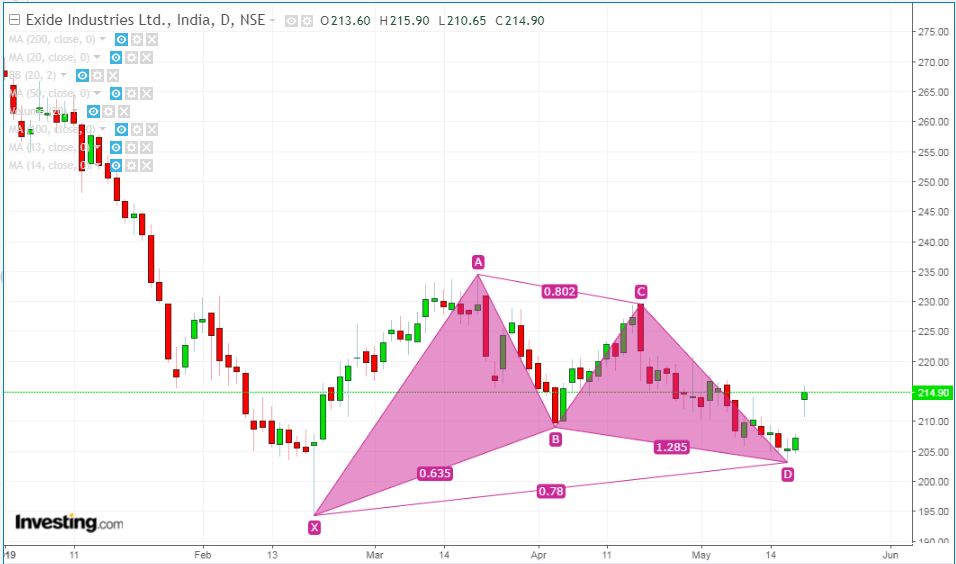
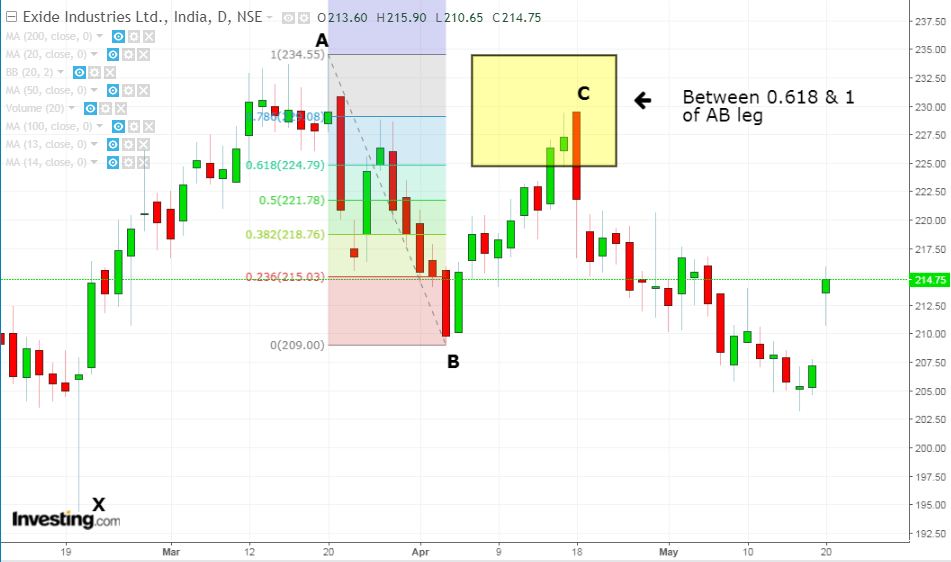
  • Point C should lie between 0.618 and 1 of the retracement of AB leg but should not cross Point A. As shown in the below example, Point C lie between the above-mentioned levels.
retracement - Exide Industries Ltd.
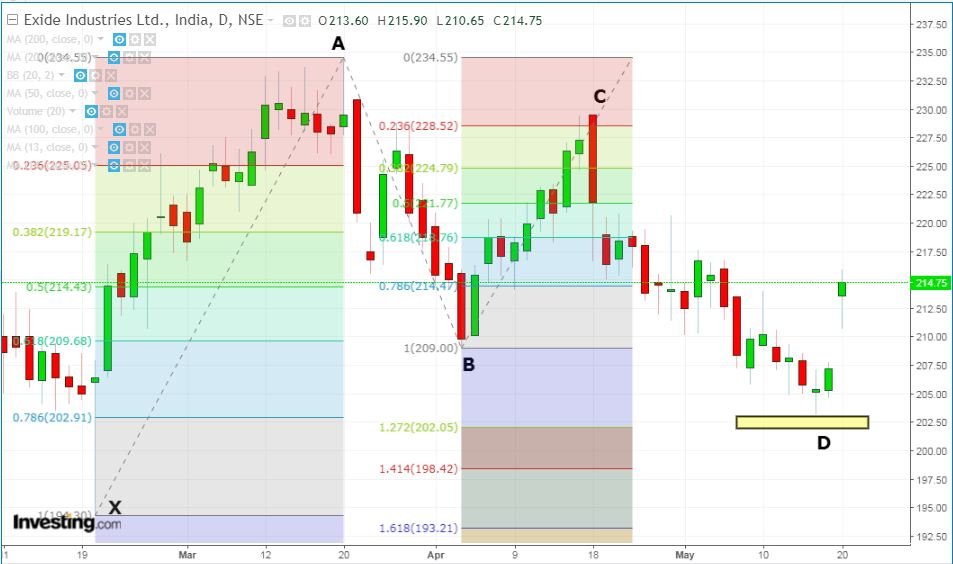
  • D is not a point but rather a zone from where the price is likely to reverse, popularly known as Potential Reversal Zone (PRZ), which is arrived after satisfying the below two parameters:

a. 0.786 retracements of the primary XA leg

b. AB projection is either 1.27 or 1.618.

As seen in the below example, 0.786 comes at 202.9 and 1.272 comes at 202, thus PRZ comes at 202-202.9 which is an entry zone. Ideally, this zone should not be more than 1% in order to qualify as a valid entry point.

exide 4

Target and Stoploss

After taking an entry at point D in the PRZ zone, the first target comes at 0.618 and the next target at 0.382. Stop loss is usually placed below point X as shown in the below figure. Closer is point D to point X, better is the risk-reward ratio.

As seen in the below example, the stock already achieved the first target with a gap up and is quite closer to achieving the second target which will be unfolded in the coming period.

Gartley pattern - Target and stoploss

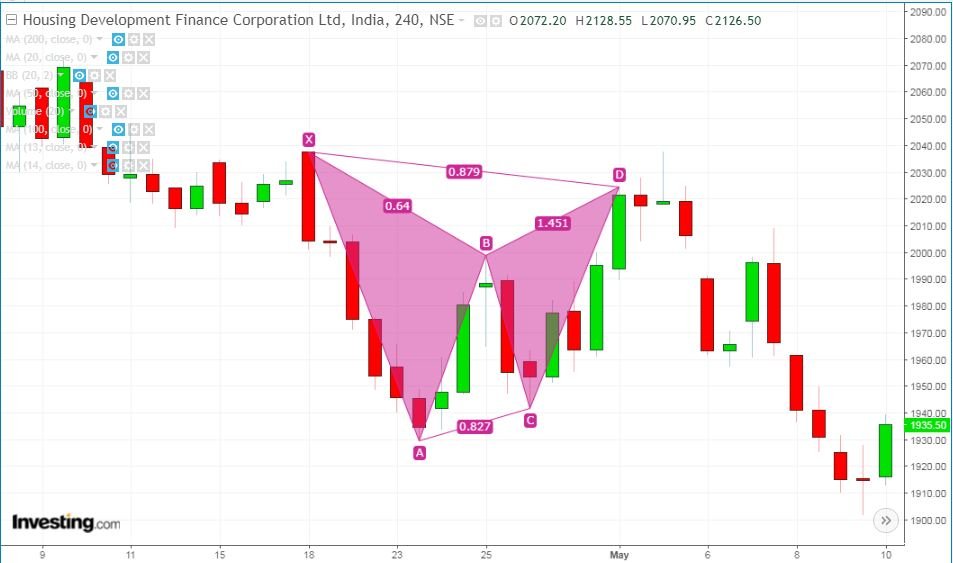
Example 1: HDFC (Continuation pattern)

The next example of the Gartley pattern (as continuation pattern) is in 4 hourly charts of HDFC ltd which was formed between 18th April and 2nd May 2019. The PRZ, in this case, comes at 2014.5-2017.5 and without hitting the stop loss, the stock continued the selloff in the direction of the original trend and successfully achieved all targets.

hdfc

Key takeaways

  • For traders who are planning to start with Harmonic trading, Gartley is quite simple and easy to understand the pattern.
  • The best part of using this pattern is due to the good risk-reward ratio and also it appears quite frequently in charts. So if you stick to the guidelines discussed in the article and follow the money management, you are sure to make profitable trades.

Learn more about such patterns from our harmonic trading course now!

Tags: englishGartley patterntechnical analysis reversalstechnical indicators
Share6TweetSend
Get Kotak Offer Get Kotak Offer Get Kotak Offer
Previous Post

Strategic Asset Allocation – Definition, Process and Advantages

Next Post

How to Invest in the Stock Market for Beginners?

Elearnmarkets

Elearnmarkets

Elearnmarkets (ELM) is a complete financial market portal where the market experts have taken the onus to spread financial education. ELM constantly experiments with new education methodologies and technologies to make financial education effective, affordable and accessible to all. You can connect with us on Twitter @elearnmarkets.

Related Posts

Beginner's Guide to Trading Penny Stocks 4
Technical Analysis

Beginner’s Guide to Trading Penny Stocks

September 26, 2023
77
5 Important Volatility Indicators that Traders should know 5
Technical Analysis

5 Important Volatility Indicators that Traders should know

September 19, 2023
58.1k
Top 5 Momentum Indicators that Analyses Trend Strength 6
Technical Analysis

Top 5 Momentum Indicators that Analyses Trend Strength

September 7, 2023
93.6k
5 important roles of Relative Strength Index (RSI) 7
Technical Analysis

5 important roles of Relative Strength Index (RSI)

September 11, 2023
41.5k

Comments 3

  1. Alwin Mbunda says:
    4 years ago

    This so nice,I have learnt something it’s now time I practice.. thank you.

    Reply
  2. mobile legends hack says:
    4 years ago

    Everyone loves what you guys are up too. This type of clever
    work and exposure! Keep up the very good works guys I’ve added you guys to my own blogroll.

    Reply
  3. froleprotrem says:
    4 years ago

    Hiya, I’m really glad I’ve found this info. Nowadays bloggers publish only about gossips and internet and this is actually irritating. A good web site with interesting content, that is what I need. Thank you for keeping this site, I will be visiting it. Do you do newsletters? Cant find it.

    Reply

Leave a Reply Cancel reply

Your email address will not be published. Required fields are marked *

Elearnmarkets Logo

Follow Us

Facebook-f Twitter Instagram Linkedin-in Youtube Telegram

Register on Elearnmarkets

Continue your financial learning by creating your own account on Elearnmarkets.com

Register Free Account

Download App

Playstore logo
Download on app store

Categories

  • Basic Finance
  • Derivatives
  • Financial Planning
  • Fundamental Analysis
  • Technical Analysis
  • Marketshala
  • Miscellaneous

Popular On Elearnmarkets

  • Market Superheroes:
  • Vivek Bajaj
  • Chetan Panchamia
  • Ashish Kyal
  • Premal Parekh
  • Abhijit Paul
  • Jegan
  • Sivakumar Jayachadran
  • Vishal Malkan
  • Jyoti Budhia
  • Vivek Gadodia
  • Vishal Mehta
  • Piyush Chaudhry
  • Santosh Pasi
  • Gomathi Shankar
  • Market Superheroes:
  • Vivek Bajaj
  • Chetan Panchamia
  • Ashish Kyal
  • Premal Parekh
  • Abhijit Paul
  • Jegan
  • Sivakumar Jayachadran
  • Vishal Malkan
  • Jyoti Budhia
  • Vivek Gadodia
  • Vishal Mehta
  • Piyush Chaudhry
  • Santosh Pasi
  • Gomathi Shankar
  • Courses:​
  • Options Trading
  • Dow Theory
  • Momentum Trading
  • Stock Investing
  • Stock Market for Beginners
  • Harmonic Chart Patterns
  • Algo Trading
  • Elliot Wave Theory
  • Advanced Excel
  • Cryptocurrency
  • NSE Certification Course
  • Courses:​
  • Options Trading
  • Dow Theory
  • Momentum Trading
  • Stock Investing
  • Stock Market for Beginners
  • Harmonic Chart Patterns
  • Algo Trading
  • Elliot Wave Theory
  • Advanced Excel
  • Cryptocurrency
  • NSE Certification Course
  • Webinars:
  • Bank Nifty Scalping
  • Intraday Trading Strategies
  • Options Trading Strategies
  • Options selling
  • Price Action
  • Relative Strength
  • Tax Planning
  • Options Buying
  • Growth Stocks
  • Portfolio Management
  • Relative Strength Index
  • Risk Management
  • Renko Charts
  • Crude Oil
  • Traders Psychology
  • Moving Average
  • Multibagger Stocks
  • Free Learning Modules:
  • Intraday Trading
  • Options Scalping
  • Swing Trading
  • Financial Modelling
  • RSI Indicator
  • Bollinger Bands
  • Pricing of Futures
  • Personal Finance
  • Initial Public Offerings (IPO)
  • Value Investing
  • Technical Indicators
  • Candlesticks
  • Chart Patterns
  • Option Greeks
  • ELSS Funds
  • Banking and Insurance
  • Real Estate
  • Gold
  • Book Summaries:
  • Rich Dad Poor Dad
  • Psychology of Money
  • The Intelligent Investor
  • The Richest Man in Babylon
  • Think and Trade Like a Champion
  • Value Investing and Behavioural Finance
  • Trading in the Zone
  • Learn to Earn
  • Book Summaries:
  • Rich Dad Poor Dad
  • Psychology of Money
  • The Intelligent Investor
  • The Richest Man in Babylon
  • Think and Trade Like a Champion
  • Value Investing and Behavioural Finance
  • Trading in the Zone
  • Learn to Earn
  • Tools:
  • CAGR Calculator
  • SIP Calculator
  • eLearnOptions
  • Future Value Calculator
  • Present Value Calculator
  • Atal Pension Yojana
  • Cost of Delay Calculator
  • Become a Crorepati
  • Tools:
  • CAGR Calculator
  • SIP Calculator
  • eLearnOptions
  • Future Value Calculator
  • Present Value Calculator
  • Atal Pension Yojana
  • Cost of Delay Calculator
  • Become a Crorepati

© 2023 Elearnmarkets. All Rights Reserved

  • Visit Elearnmarkets
  • Courses
  • Webinars
  • Financial Guides
  • Get Free Counselling
  • Visit Elearnmarkets
  • Courses
  • Webinars
  • Financial Guides
  • Get Free Counselling

Get Elearnmarkets App

No Result
View All Result
  • Article Categories
    • Basic Finance
    • Derivatives
    • Financial Planning
    • Fundamental Analysis
    • Technical Analysis
    • Marketshala
    • Miscellaneous
  • Language
    • Hindi
    • Bengali
    • English
  • Courses
  • Webinars
  • Stories

© 2020 Elearnmarkets All Rights Reserved

A Handbook of Technical Analysis
To start your trading journey as a seasoned technical analyst
Download Now
View Details
View Course Details
Guidebook On Chart Patterns
Take Your Trading To The Next Level With Strategies Shared In This Ebook
Download Now