Elearnmarkets - Financial Market Learning
  • Categories
    • Basic Finance
    • Derivatives
      • Futures
      • Options
    • Financial Planning
    • Fundamental Analysis
    • Technical Analysis
    • Marketshala
    • Miscellaneous
  • Language
    • English
    • Hindi
    • Bengali
No Result
View All Result
  • Courses
  • Webinars
  • Stories
Elearnmarkets - Learn Stock Market, trading, investing for Free
No Result
View All Result
Home Technical Analysis
A Guide to Risk Reward Ratio  1

A Guide to Risk Reward Ratio 

Elearnmarkets by Elearnmarkets
August 3, 2023
in Technical Analysis
Reading Time: 6 mins read
0
1.5k
VIEWS
Share on FacebookShare on XShare on WhatsApp

Investing is risky by nature. While most investors aim to make money off of their investments, there is also a chance that they could end up losing some or all of their money. Investors can compare the potential gains and losses of an investment using the risk-reward ratio.

The risk reward ratio calculates an investment’s probability of profit and loss. 

Simply divide the risk by the reward to obtain the ratio if you can determine the potential risk and reward of a trade. Consider it this way: The profit you can anticipate on investment for every dollar of trade-related risk.

As a result, the risk-reward ratio can quickly reveal whether an investment is worthwhile. This is well-liked by day traders who want to enter and exit the market quickly because it enables them to choose how much to risk to potentially gain.

Table Of Contents
  1. What is the Risk Reward Ratio?
  2. Why is it Important?
  3. How to Calculate Risk Reward Ratio?
  4. What does Risk Reward Ratio tell you?
  5. Example
  6. Pros and Cons of Risk Reward Ratio 
  7. Watch our video on Risk Reward Ratio
  8. Bottomline 

What is the Risk Reward Ratio?

The risk reward ratio shows how much an investor might gain from an investment for every dollar they risk. The expected returns of an investment and the level of risk required to earn those returns are often compared using risk-reward ratios.

 It is frequently preferable to have a lower risk return ratio because it indicates a lower risk for a similar potential gain.

Why is it Important?

Investors can determine whether a potential investment is worthwhile by using the risk return ratio. In contrast, a low ratio indicates the opposite, that the potential reward is smaller than the potential risk. Investors can make better investment decisions and manage risk skillfully by being aware of the risk return ratio.

How to Calculate Risk Reward Ratio?

You must divide the amount you stand to lose (the risk) by the amount you stand to gain (the reward) if your investment performs as anticipated in order to arrive at the risk/return ratio, also referred to as the risk-reward ratio.

The risk reward ratio’s formula is-

Risk Reward Ratio = Potential Loss / Potential Gain

What does Risk Reward Ratio tell you?

Investors can reduce their likelihood of losing money on trades by using the risk reward ratio. Even if a trader makes some money, if their win rate is less than 50%, they will eventually lose money. 

RelatedPosts

5 Important Volatility Indicators that Traders should know 2

5 Important Volatility Indicators that Traders should know

September 19, 2023
57.7k
Top 5 Momentum Indicators that Analyses Trend Strength 3

Top 5 Momentum Indicators that Analyses Trend Strength

September 7, 2023
93k
5 important roles of Relative Strength Index (RSI) 4

5 important roles of Relative Strength Index (RSI)

September 11, 2023
41.2k

The difference between a trade entry point to a stop-loss and a sell or take-profit order is measured by the risk reward ratio. These two can be compared to determine the ratio of reward to risk or profit to loss.

When trading individual stocks, investors frequently use stop-loss orders to help limit losses and actively manage their investments with a risk/reward focus.

 A stop-loss order is a trading trigger put on a stock that, if it drops below a predetermined low, automatically sells the stock from a portfolio. Through this, investors can set stop-loss orders automatically

Example

Think of this illustration: A trader places a stop-loss order at Rs. 15 and buys 100 shares of XYZ Company at Rs. 20 to limit losses to Rs. 500. 

Assume that this trader thinks XYZ’s price will rise to Rs. 30 in the upcoming few months. In this instance, the trader is willing to take an Rs. 5 per share risk in exchange for an anticipated Rs. 10 per share profit when the position is closed. 

The trader would be said to have a 1:2 risk/reward ratio on that specific trade since they stand to make twice what they have risked. Similar strategies can be used with derivatives contracts like puts, which grant their owners the right to sell the underlying asset at a predetermined price.

The stop-loss order can be changed in order to change the risk reward ratio if an investor prefers to aim for a 1:5 risk reward ratio for a specific investment (five units of expected return for each additional unit of risk). However, it’s crucial to realize that by doing so, the investor has altered the likelihood that their trade will be successful.

Watch our webinar on  Principles of Risk & Money Management in Professional Trading

Pros and Cons of Risk Reward Ratio 

Pros and cons of risk reward ratio

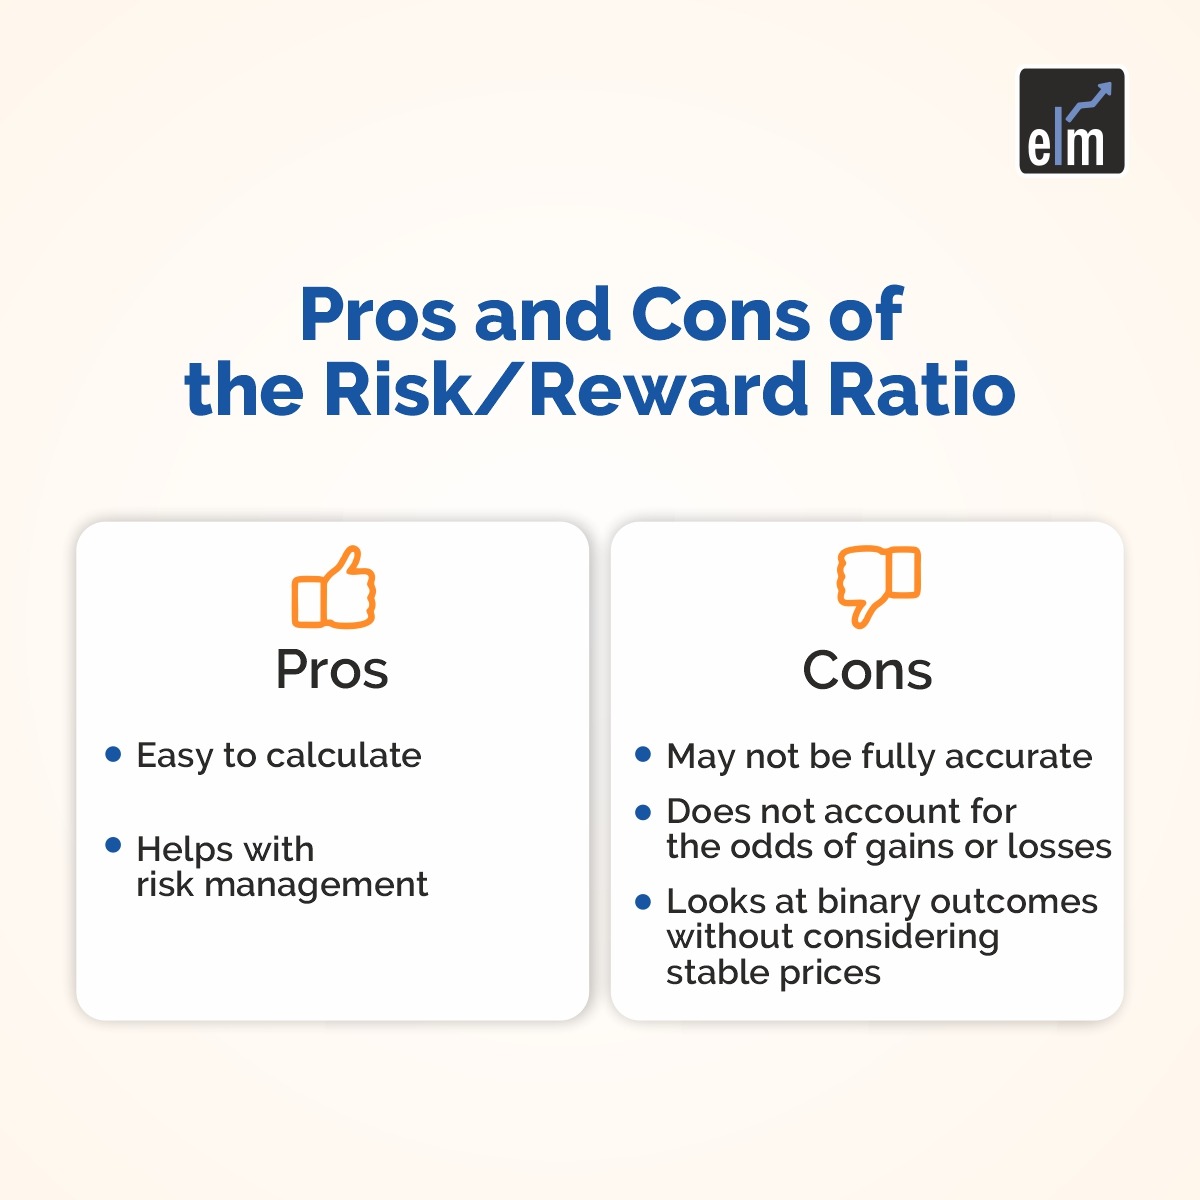
Below are the benefits of Risk Reward Ratio:

  • Simple to calculate- Investors can easily use the risk/reward ratio to make decisions on the spot because it has a very straightforward formula.
  • Assists in risk management– An investor has more information to choose whether to make a trade after the ratio describes the risk of an investment.

Below are the disadvantages-

  • Possibly not entirely accurate – The investor’s stop-losses and potential profits are used to calculate risk/reward ratios. A security’s price may increase or decrease too quickly for an investor to sell it at the desired price, so the actual gain or loss may be greater than the potential gain or loss.
  • Ignores the likelihood of gains or losses: The risk/reward ratio only takes into account the potential gains and losses that an investment could incur. The calculation does not allow for the likelihood of either outcome to be taken into account.
  • The ratio ignores stable prices in favor of binary outcomes: Prices for securities can go up or down, but they can also remain stable. This possibility is not taken into consideration by risk/reward ratios, which is a disadvantage for day traders who want to

You can also do our course on Masterclass on Short-term Momentum Trading

Watch our video on Risk Reward Ratio

Bottomline 

The risk-reward ratio calculates the likelihood that an investment or project will generate more money than it will cost. Generally, a higher risk-reward ratio is preferred because it offers the chance of a higher return on investment without taking excessive risks. An excessive ratio suggests that an investment may be too risky.

We hope you found this blog informative and use the information to its maximum potential in the practical world. Also, show some love by sharing this blog with your family and friends and helping us spread financial literacy.

Happy Investing!

To get the latest updates about Financial Markets, visit StockEdge

Tags: basicenglishrisk managementrisk reward ratiostock markettechnical analysis
ShareTweetSend
Get Kotak Offer Get Kotak Offer Get Kotak Offer
Previous Post

5 Powerful Techniques to Lock in Profits by Using Trailing Stop Loss

Next Post

6 Risk Management Tools for Forex Trading

Elearnmarkets

Elearnmarkets

Elearnmarkets (ELM) is a complete financial market portal where the market experts have taken the onus to spread financial education. ELM constantly experiments with new education methodologies and technologies to make financial education effective, affordable and accessible to all. You can connect with us on Twitter @elearnmarkets.

Related Posts

5 Important Volatility Indicators that Traders should know 5
Technical Analysis

5 Important Volatility Indicators that Traders should know

September 19, 2023
57.7k
Top 5 Momentum Indicators that Analyses Trend Strength 6
Technical Analysis

Top 5 Momentum Indicators that Analyses Trend Strength

September 7, 2023
93k
5 important roles of Relative Strength Index (RSI) 7
Technical Analysis

5 important roles of Relative Strength Index (RSI)

September 11, 2023
41.2k
NR4 and NR7 Trading Strategy Setup 8
Technical Analysis

NR4 and NR7 Trading Strategy Setup

September 14, 2023
82.3k

Leave a Reply Cancel reply

Your email address will not be published. Required fields are marked *

Elearnmarkets Logo

Follow Us

Facebook-f Twitter Instagram Linkedin-in Youtube Telegram

Register on Elearnmarkets

Continue your financial learning by creating your own account on Elearnmarkets.com

Register Free Account

Download App

Playstore logo
Download on app store

Categories

  • Basic Finance
  • Derivatives
  • Financial Planning
  • Fundamental Analysis
  • Technical Analysis
  • Marketshala
  • Miscellaneous

Popular On Elearnmarkets

  • Market Superheroes:
  • Vivek Bajaj
  • Chetan Panchamia
  • Ashish Kyal
  • Premal Parekh
  • Abhijit Paul
  • Jegan
  • Sivakumar Jayachadran
  • Vishal Malkan
  • Jyoti Budhia
  • Vivek Gadodia
  • Vishal Mehta
  • Piyush Chaudhry
  • Santosh Pasi
  • Gomathi Shankar
  • Market Superheroes:
  • Vivek Bajaj
  • Chetan Panchamia
  • Ashish Kyal
  • Premal Parekh
  • Abhijit Paul
  • Jegan
  • Sivakumar Jayachadran
  • Vishal Malkan
  • Jyoti Budhia
  • Vivek Gadodia
  • Vishal Mehta
  • Piyush Chaudhry
  • Santosh Pasi
  • Gomathi Shankar
  • Courses:​
  • Options Trading
  • Dow Theory
  • Momentum Trading
  • Stock Investing
  • Stock Market for Beginners
  • Harmonic Chart Patterns
  • Algo Trading
  • Elliot Wave Theory
  • Advanced Excel
  • Cryptocurrency
  • NSE Certification Course
  • Courses:​
  • Options Trading
  • Dow Theory
  • Momentum Trading
  • Stock Investing
  • Stock Market for Beginners
  • Harmonic Chart Patterns
  • Algo Trading
  • Elliot Wave Theory
  • Advanced Excel
  • Cryptocurrency
  • NSE Certification Course
  • Webinars:
  • Bank Nifty Scalping
  • Intraday Trading Strategies
  • Options Trading Strategies
  • Options selling
  • Price Action
  • Relative Strength
  • Tax Planning
  • Options Buying
  • Growth Stocks
  • Portfolio Management
  • Relative Strength Index
  • Risk Management
  • Renko Charts
  • Crude Oil
  • Traders Psychology
  • Moving Average
  • Multibagger Stocks
  • Free Learning Modules:
  • Intraday Trading
  • Options Scalping
  • Swing Trading
  • Financial Modelling
  • RSI Indicator
  • Bollinger Bands
  • Pricing of Futures
  • Personal Finance
  • Initial Public Offerings (IPO)
  • Value Investing
  • Technical Indicators
  • Candlesticks
  • Chart Patterns
  • Option Greeks
  • ELSS Funds
  • Banking and Insurance
  • Real Estate
  • Gold
  • Book Summaries:
  • Rich Dad Poor Dad
  • Psychology of Money
  • The Intelligent Investor
  • The Richest Man in Babylon
  • Think and Trade Like a Champion
  • Value Investing and Behavioural Finance
  • Trading in the Zone
  • Learn to Earn
  • Book Summaries:
  • Rich Dad Poor Dad
  • Psychology of Money
  • The Intelligent Investor
  • The Richest Man in Babylon
  • Think and Trade Like a Champion
  • Value Investing and Behavioural Finance
  • Trading in the Zone
  • Learn to Earn
  • Tools:
  • CAGR Calculator
  • SIP Calculator
  • eLearnOptions
  • Future Value Calculator
  • Present Value Calculator
  • Atal Pension Yojana
  • Cost of Delay Calculator
  • Become a Crorepati
  • Tools:
  • CAGR Calculator
  • SIP Calculator
  • eLearnOptions
  • Future Value Calculator
  • Present Value Calculator
  • Atal Pension Yojana
  • Cost of Delay Calculator
  • Become a Crorepati

© 2023 Elearnmarkets. All Rights Reserved

  • Visit Elearnmarkets
  • Courses
  • Webinars
  • Financial Guides
  • Get Free Counselling
  • Visit Elearnmarkets
  • Courses
  • Webinars
  • Financial Guides
  • Get Free Counselling

Get Elearnmarkets App

No Result
View All Result
  • Article Categories
    • Basic Finance
    • Derivatives
    • Financial Planning
    • Fundamental Analysis
    • Technical Analysis
    • Marketshala
    • Miscellaneous
  • Language
    • Hindi
    • Bengali
    • English
  • Courses
  • Webinars
  • Stories

© 2020 Elearnmarkets All Rights Reserved

View Course Details