
Key Takeaways
- Chartered Market Technician (CMT), a globally recognized expert in technical analysis and market risk management.
- CMT Level 1, an entry level exam with topics like theory and history, markets and its indicators, chart construction, decision making, statistical and trend analysis and many more.
CMT- A professional technical analyst with the designation of chartered market technician (CMT®) is one who works for the CMT Association (formerly the MTA), a global organization that has been providing credentials to the financial sector for close to 50 years. The CMT is the most prestigious accreditation for practitioners globally and denotes the greatest level of training in the field.
Through a disciplined, systematic approach to market behavior and the law of supply and demand, technical analysis provides the tools to successfully bridge the gap between intrinsic value and market price across all asset classes. By receiving the CMT designation, you may prove that you are an expert in an entire body of knowledge about investment risk in portfolio management, including rules-based trading system design and testing and quantitative approaches to market research.
In this blog, we will discuss more about CMT and the basic understanding of the topics covered in CMT- level 1:
Understanding Chartered Market Technician (CMT)
A candidate must successfully pass three levels of examination, finish the membership application process, and accept the CMT Association’s code of conduct in order to receive the designation of Chartered Market Technician (CMT®).
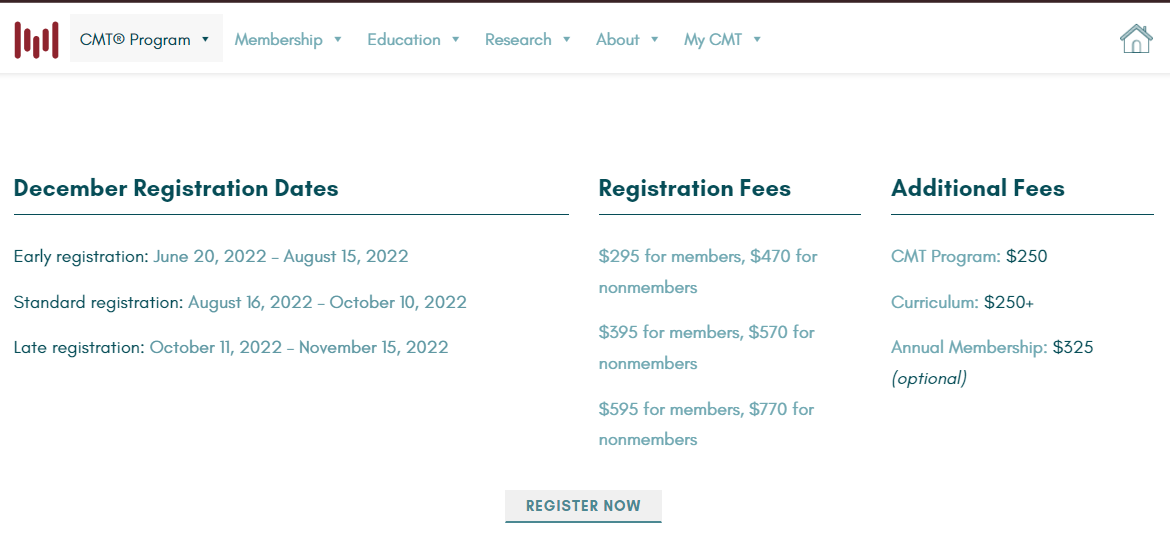
Candidates can sign up for their first exam after registering for the program. Exams for the CMT program‘s three levels are given online or at testing centers using computers. The exam prices for members are different from those for nonmembers, nevertheless.
CMT accreditation is widely regarded as the global gold standard in technical analysis among professionals in the field.
Candidates must secure at least three CMT Member references who can attest to their technical analysis knowledge, skill, and ability in addition to meeting the above requirements (passing three examination levels, completing the membership application process, and accepting the CMT Association’s code of ethics).
CMT Exams
The CMT Program’s aim is to advance a candidate’s professional knowledge with regard to the study and use of technical analysis. It is a self-study for the CMT Program.
CMT Level-1
The CMT Level I test gauges fundamental, entry-level technical analysis knowledge and proficiency. The Level I candidate must be familiar with the basic instruments used by technical analysts.
There is no time limit to pass the succeeding levels once the first one has been successfully completed. According to the CMT website, the Level 1 exam evaluates candidates’ fundamental, entry-level competency and understanding; they must be familiar with the technical analyst’s basic tools.
Topics Covered
Let us discuss the topics covered in CMT Level-1
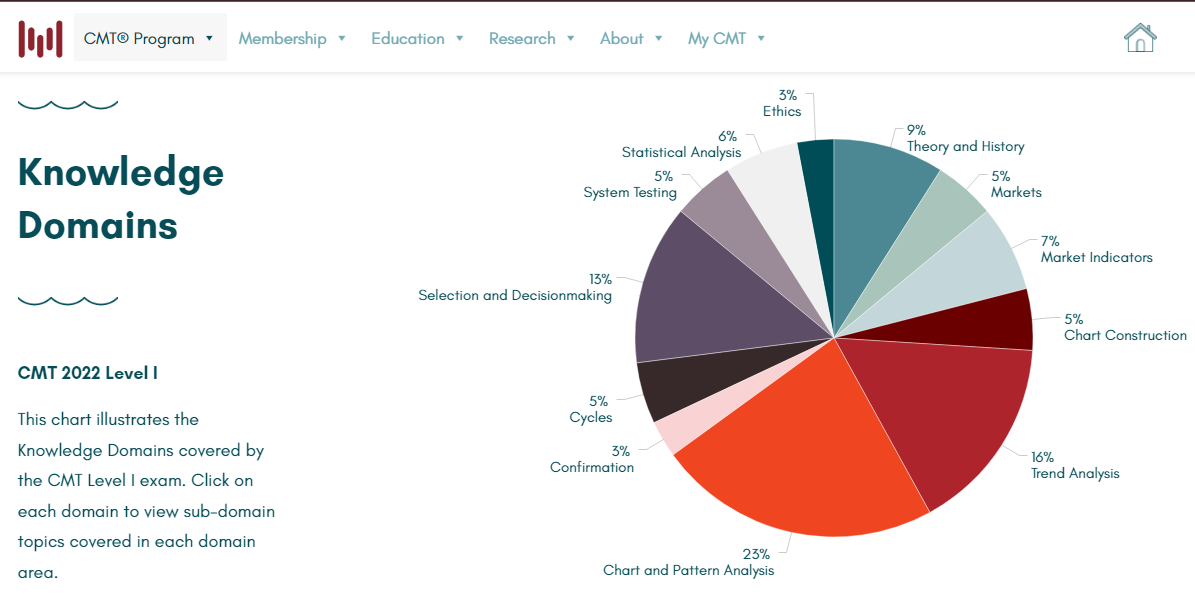
1. Theory and History
This section contains the basic principle of technical analysis, Dow Theory, and the basics of Chart Patterns.
Dow Theory defines the rhythm of the market; he who has the eye to see it and the mind to understand can also learn to play it successfully. Charles Dow(1851-1902) was the father of Technical Analysis and the discoverer of the Dow theory.
The theory lays down the guidelines to understand how the market moves. It is the foundation on which the monument of Technical Analysis stands today.
2. Markets
This section focuses on different tradable assets like bonds, commodities, currencies, options trading, etc.
When trading stocks, there are two ways to make money: take a long or short position on a specific stock. If you expected the value of a particular stock to rise, you would take a long position by purchasing it to sell it later at a higher price.
If you expected a particular stock’s value to fall, you would take a short position by short-selling it and hoping to repurchase it later at a lower price. There is more flexibility in how trades can be executed in options trading, as well as many more ways to profit.
It should be noted that options trading is far more complicated than stock trading, and the entire concept of what is involved can be very intimidating to beginners. There is certainly a lot you should learn before you start investing your money.
3. Market Indicators
Technical indicators are mathematical patterns derived from historical data that technical traders and investors use to forecast future price trends and make trading decisions. Using a mathematical formula, it derives data points from past price, volume, and open interest data.
A technical indicator is displayed graphically and compared to the corresponding price chart for analysis. The mechanics of a technical indicator capture the behavior and sometimes the psychology of investors to hint at future price activity trends.
Cycle volumes, momentum readings, volume patterns, price trends, Bollinger Bands, moving averages, Elliot waves, oscillators, and sentiment indicators are technical indicators used in technical analysis to forecast future price movements.
4. Chart Construction
This section focuses on different types of charts, such as Bar Charts, Candlestick Charts, Point & Figure Charts, Volume Charts, Range Charts, and so on.
Bar Patterns are short-term patterns that are useful for timing our trades and finding logical stop-loss points. The bar patterns are similar to the candlesticks patterns, and every price action trader should know the same.
One should note that the bar patterns play an important role when they appear at a strong uptrend or downtrend i.e., near the end of the trend. Like candlestick patterns, bar patterns are also short-term patterns, and they can indicate a reversal of the prices of the stock to another direction.
Bar patterns can be used in any timeframe, say 5 minutes, 15 minutes, hourly, daily, weekly, monthly, and so on. The larger the timeframe, the greater is the importance of bar patterns in terms of the magnitude of the upcoming move.
5. Trend Analysis
Trend analysis helps in predicting a trend, whether the market is in a bull or bearish run, and it also suggests whether a trend reversal is going to take place, like from a bull-to-bear market.
Trend analysis helps traders to make a profit when they trade along with the trend and not against it. It helps traders to understand the ongoing price direction in the market during a particular period. Trends can be up or down based on the bullish and bearish market sentiments, respectively. One should note that the longer the trend, the more reliable it is.
Traders can also analyze whether a trend in one sector could result in the same trend in the sector.
6. Chart and Pattern Analysis
Identifying patterns is one of the biggest tasks for any trader in the stock market. This is where candlestick patterns and chart patterns can be beneficial.
Therefore knowing the difference between these two types of technical tools is important for trading using Technical analysis. Candlestick charts are technical tools that pack data for multiple time frames into single price bars. Whereas chart patterns are the building blocks of technical analysis. They repeat themselves in the market time and are relatively easy to spot.
7. Cycles
Technical analysis’ Elliott Wave theory is used to explain price changes in the stock market. Ralph Nelson Elliott created the hypothesis after observing and identifying recurrent, fractal wave patterns. Consumer behavior and stock price movements both exhibit waves.
The theory holds as these are recurring patterns, the movements of the stock prices can be easily predicted. Investors can get an insight into ongoing trend dynamics when observing these waves, which also helps in deeply analyzing the price movements.

8. Selection and Decision making
This section mainly focuses on Relative Strength as a criterion for an investment decision. Relative Strength is a momentum strategy that helps us identify strong stocks for trading compared to the Index. With the help of Relative Strength, traders will look for those companies which have outperformed their peers or the Index either by rising more or falling less as compared to the peers’ or Index.
Relative Strength helps us predict that the trends currently displayed by the stocks will continue long enough and we can realize a positive return. However, traders should note it is different from the Relative Strength Index.
You can also do our course on TRADING MENTORSHIP PROGRAM
9. System Testing
This section focuses on the model-building process, objective rules, and their evaluation, and also on backtesting the system.
10. Statistical Analysis
This section introduces CMT Candidates to the world of statistics, such as Descriptive Statistics and Probability, which are used in trading in the stock market.
11. Ethics
Candidates are urged to read the Standards of Practice Handbook as they get ready for the CMT tests. The Standards of Practice Handbook “grounds the concepts contained in the Code and Standards for practical usage,” according to the CFA Institute. This manual can help you navigate any ethical conundrums that may arise in your day-to-day professional life. Candidates can develop a thorough study plan and get ready for professional practice by reading the Handbook.
Bottom Line
We hope you found this blog informative and use it to its maximum potential in the practical world. Also, show some love by sharing this blog with your family and friends and helping us in our mission of spreading financial literacy.
Happy Investing!


