- What is the Bollinger Bands Indicator?
- Importance of Bollinger Bands Indicator
- Bollinger Bands Formula
- Components of Bollinger Bands
- How do Bollinger Bands work?
- Strategies for Utilising Bollinger Bands
- Bollinger Band %B Indicator Strategy
- Bollinger Bands RSI Strategy
- Combining Bollinger Bands with Other Indicators
- Limitation of Bollinger Bands
- Bottomline
Hindi: आप इस लेख को हिंदी में भी पढ़ सकते है|
Bollinger Bands- We are creatures of emotion, creatures bristling with prejudices and motivated by pride and vanity. As creatures of emotion, we crave predictability and order. We struggle to find patterns in its absence. But surprisingly, from the mutation of genes to the process called diffusion, randomness is essential to the workings of nature and perhaps even required for human beings to exist at all.
“Everything gives way and nothing stays fixed”– Heraclitus
As today is the first day of the remainder of our lives, so you and I, being a participant in the stock market, should take it seriously. Go on reading, you will be able to relate it soon.
You know Mr. Market also vibrates. Surprised? Yes, there is a term called volatility which is inseparably interrelated to the financial market. If you want to understand the term volatility in a lucid way, you can use the term “speed”. Let me quote Albert Einstein:
“As far as the laws of mathematics refer to reality, they are not certain; and as far as they are certain, they do not refer to reality.”
In this era of predictive analytics also we have to advertise our ignorance because we cannot predict future with the precision. If you and I could do that, by now we would have been on the list of top five richest persons in the world. Right? Haha!
There is an old saying on Wall Street that the market is driven by just two emotions: greed and fear. These two intrinsic emotional states relate the word “uncertainty” to the stock market. Succumbing to these emotions can have an “utter and deleterious effect” on investors’ portfolios and the stock market.
Believe me, the superfluity of information on “volatility” will drown your head in the massive “noise” of the financial market. According to Nassim Nicholas Taleb, the terms “bull” and “bear” have limited meanings outside of zoology because of the concept of skewness. Median and expected do not mean the same thing at all in the financial world. The terms bullish and bearish are often hollow words with no application in a world of randomness – particularly if such a world, like ours, presents asymmetric outcomes.
“Suppose we use the standard deviation of possible future returns on a stock as a measure of its volatility. Is it reasonable to take that volatility as a constant over time? I think not.” — Fischer Black
It is widely accepted today that an assumption of constant volatility fails to explain the existence of the volatility smile and the leptokurtic character (fat tails) of the stock distribution. The above Fischer Black quote, made shortly after the famous constant-volatility Black-Scholes model was developed, proves the point.
You must know that the sharpest of all sharp brains are involved in this stock market with different mathematical models and statistical tools to quantify volatility and estimate the underlying price. It is beyond the scope of this article to articulate those complex structures in words.
To keep it simple and precise for trading, it would be better to study the Bollinger bands.
What is the Bollinger Bands Indicator?
In the 1980s, a tool named “Bollinger Bands” was invented by John Bollinger. These bands are volatility indicators similar to the Keltner Channel. Except for the Bollinger Bands, which are placed two standard deviations above and below the moving average, which is usually 20 days.
Importance of Bollinger Bands Indicator
For traders and analysts, the Bollinger Bands indicator is a valuable tool in technical analysis for a number of reasons. These include:
- Volatility Measurement: By constantly adapting to price changes, Bollinger Bands offer a visual depiction of volatility. The bands expand in times of high volatility and compress in times of low volatility. This makes it easier for traders to quickly assess the volatility levels in the market.
- Determining Overbought and Oversold Conditions: The Bollinger Bands’ upper and lower bands can serve as dynamic levels of support and resistance, respectively. Prices that are close to or over the upper band may indicate that the market is overbought. On the other hand, it indicates that the market can be oversold if prices approach or drop below the lower band.
- Trend Analysis: The strength and direction of a trend can be evaluated using Bollinger Bands. Prices that often go outside of the bands in one direction could be signs of a significant trend. On the other hand, if prices fluctuate within the bands, there may not be a clear pattern.
- Reversal Signals: Price movements that cross over into or touch the outer bands, particularly following a contractionary phase, may indicate possible reversal points. For traders wishing to initiate or exit positions based on mean reversion tactics, this can be helpful.
Bollinger Bands Formula
It evolved from the concept of trading bands. Two trading bands are placed around a moving average, similar to the envelope technique. For your simplicity, I am breaking it down:-
- An N-period moving average(MA)
- An upper band at K times an N-period standard deviation above the moving average (MA + Kσ)
- A lower band at K times an N-period standard deviation below the moving average (MA − Kσ)
The values for N and K are 20 and 2. Normally Simple Moving Average is preferred to Exponential Moving Average because it is used in calculating the volatility used to set the bandwidth, hence, it is internally consistent to use the same average to set the center point.
Moreover, for both the middle band and calculation of standard deviation usually, the same period is used. For a 20 day average, the most recent 20 days are used. The next day the oldest day’s data is discarded and the newest included. The same is true for volatility; for each period, the volatility is measured using the immediately preceding periods.
You must know that Standard Deviation (S.D.) is a statistical concept that describes how prices are dispersed around an average value. The importance of using two standard deviations is that it ensures that 95% of the price data will fall between the two trading bands. To know the process of calculation of standard deviation you can always consult our common guide “Google”.
The default for Bollinger bands are: 20-day calculation and ± 2 standard deviations. Surprisingly, you will find that as you shorten the calculation period, you will need to reduce the number of standard deviations used to set the bandwidth, and as you lengthen the number of periods, you will need to widen the bandwidth.
According to Bollinger if you use a starting point of 2 standard deviations and a 20-period calculation, you should decrease the bandwidth to 1.9 standard deviations at 10 periods and increase it to 2.1 standard deviations at 50 periods. However, none of the strategies are more important than the evolution of the markets.
If the period is less than 10 or greater than 50, changing the periodicity of the bars is more appropriate. Suppose you require a shorter calculation period than 10 days; a shift to hourly bars might be better than trying to squeeze the calculation period even tighter.
I want to add one more variation of Bollinger, i.e. multiple bands at the same time. It can be done in two ways. One is to plot multiple bands using the same calculation periods, say 20 periods, but differing bandwidths, 1 & 2 standard deviations for example. The other is to plot multiple sets of bands with different parameters, say 20 periods and 2 standard deviations and 50 periods and 2.1 standard deviations, on the same chart.
As a thumb rule, prices are considered to be overextended on the upside (overbought) when they touch the upper band. They are considered overextended on the downside (oversold) when they touch the lower band. The statistical concept behind the technical terms overbought and oversold is that as prices depart from the average, you and I should expect them to move back toward the average.
Note: Bollinger bands provide a relative definition of high and low. At the upper band, prices are high, and vice versa. This helps us recognize patterns and develop our own strategy.
Components of Bollinger Bands
I want to provide another information. Bollinger further developed 3 new indicators based on his own bands.
- BBImpulse – It helps to measure the change in price as a function of the bands.
- Percent Bandwith (%b) – It is used to normalize the width of the bands over time.
- Bandwidth delta – It helps to quantify the changing width of the bands.
How do Bollinger Bands work?
Here is how this indicator works:
1. Using Bollinger Bands as Targets
By now, you must have an idea of the use of Bollinger bands. The most common way to use it is to keep the upper and lower bands as price targets. Suppose if prices bounce back from the lower band and cross above the 20-day average, then the upper band becomes the price target on the upside and vice-versa. Normally, the price level oscillates inside the upper band and the 20-day average in case of a strong uptrend, whereas it is just the opposite in case of a strong downtrend.
During a period of rising price volatility, the distance between the two bands will widen, whereas, during a period of low volatility, the bands will contract. Usually, the contraction and extraction come alternately. Okay. I will break it down for better clarity. Before proceeding further you should know that volatility is cyclical even when the price is not.
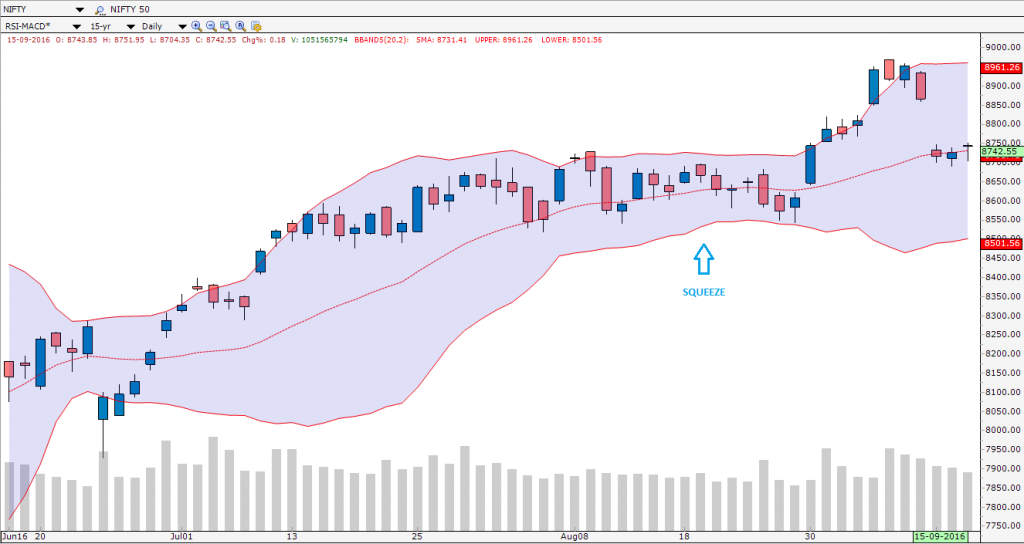
2. The Squeeze
Please remember these points. During a period of low volatility, the bands come closer, constricting the moving average. It is a sign that a market may be about to initiate a new trend, and traders use this as a possible trading opportunity in the future because, you know after contraction comes the expansion/explosion phase. This rule is never broken. Bollinger bands are driven by volatility, and “the squeeze” is a pure reflection of that volatility. When volatility falls to historically low levels, the squeeze is on.
An indicator named “Bandwidth” was created in order to measure. Normally the squeeze is triggered when bandwidth drops to its lowest level in six months. Often, as the end of a squeeze nears, the price will stage a short fake-out move and then abruptly turn and surge in the direction of the emerging trend.

To deal with the head fake, you can wait for the move to develop sufficiently so that there is a little question about the nature of the emerging trend. Or if you want to trade the squeeze right from the beginning you can take an initial position in the direction of the fake and use the trailing stop loss technique.
After low volatility, high volatility comes to the table. Hence, when a powerful trend is born, volatility expands so much that the lower band will turn down in an uptrend and vice-versa. But you know it works very well when combined with other indicators and oscillators.
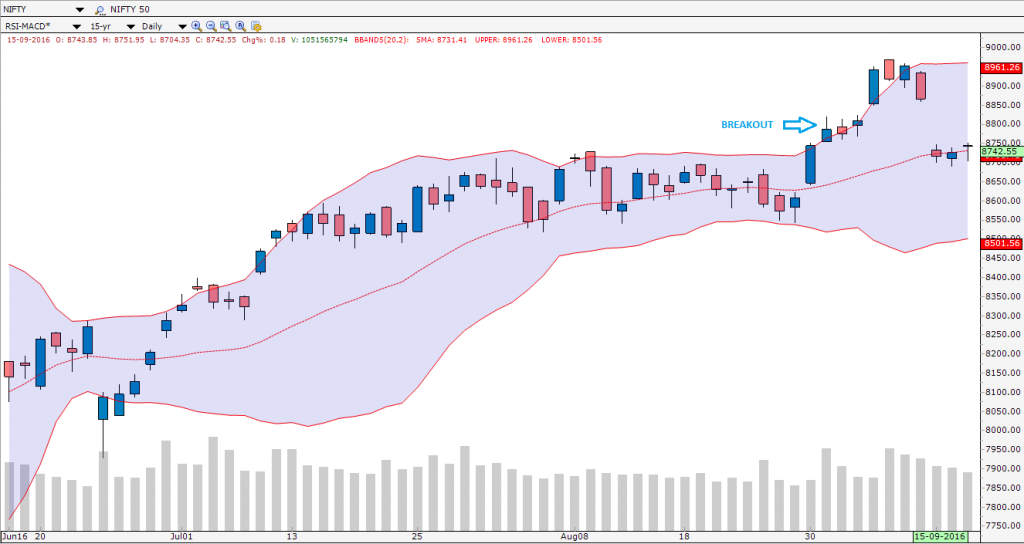
3. The Breakout
Usually, the maximum lifespan of the price movement occurs inside the two bands. When the price breaches on either side it is called breakouts. When combined with other factors it can provide some clues.
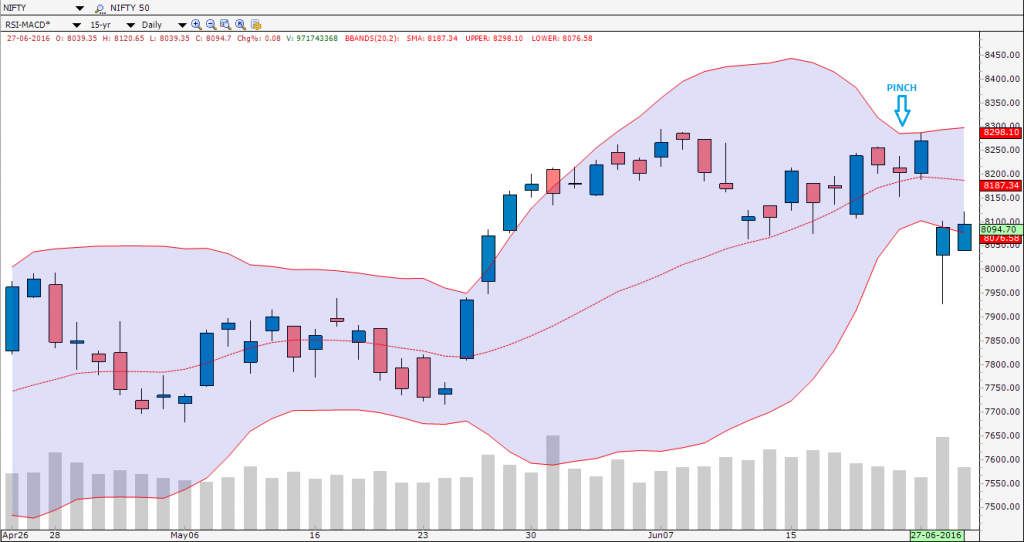
4. The Pinch
You should consider this point as well for simplicity. As mentioned earlier, expansion follows contraction, and the process is repeated. Hence, when the level of volatility decreases from an expansion phase, it is sometimes known as a pinch pattern.
As you know a table looks stable in four legs; sometimes three is okay but less than that it behaves like a drunken person. Likewise, any trade, irrespective of trend following, contrarian, or swing, you should consider at least three conditions to fulfil. It will not only help you to make better actions but also will gradually get reflected in your portfolio.
5. M-Top
Bollinger used the concepts of M-patterns in his own bands to spot the M-Top. Among the possible patterns that can form M-Top are double tops, head and shoulders, and diamonds. The ideal M-Top is formed when
Step 1) The price level makes a high outside the upper band or at least touch the upper band
Step 2) The price is pulled back towards the middle band
Step 3) Price level bounces back towards the upper band. Ideally should be lower than the prior high and below the upper band
Step 4) Volume will be higher on the first advance than on the second
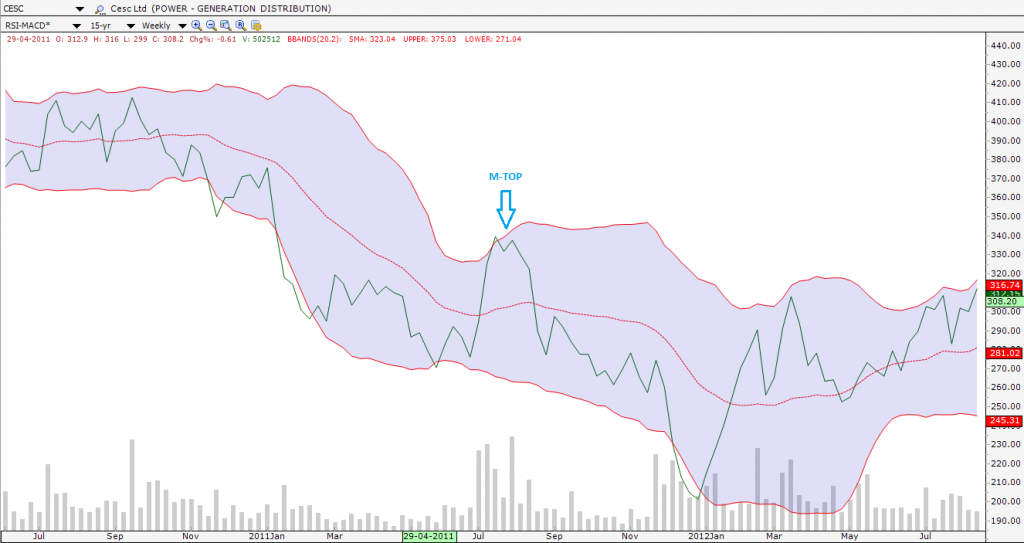
Isn’t it interesting? Now let’s go on to the interpretation…
This tops act as a warning sign. Moreover, the weakness of the trend is reflected when the second high fails to touch the upper band. The momentum loses its strength and has a possibility to reverse. Considering other factors one can easily go for a contra trade.
6. W-Bottom
Just like the M-top, the possible patterns that can form W-Bottom are double bottoms, inverted head, and shoulders. The ideal W-Bottom is formed when
Step 1) The price level makes a low outside the lower band or at least touches the lower band
Step 2) The price is bounced back towards the middle band
Step 3) Price level is pulled back towards the lower band. Ideally, it should be higher than the prior low and above the lower band
Step 4) Volume will be higher on the first decline than on the second
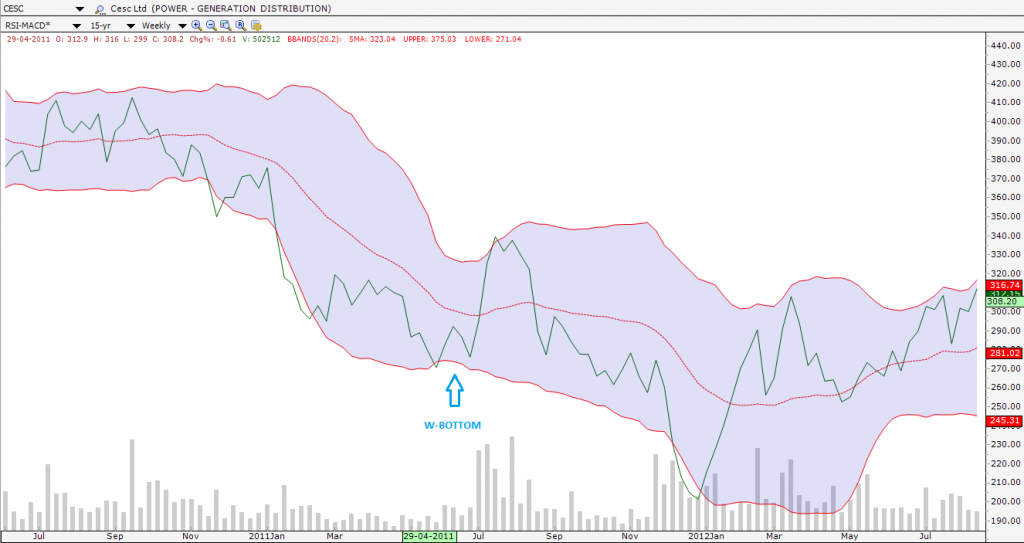
This bottoms act as a warning sign. Moreover, the weakness of the trend is reflected when the second low fails to touch the lower band. The momentum loses its strength and has a possibility to reverse. Considering other factors, one can easily go for a contra trade.
You know along with volume indicators momentum indicators can be very useful in the diagnostic process. As you know that each indicator operates independently of the other, so when they signal together, they afford a high level of confidence in the outlook for the stock.
Strategies for Utilising Bollinger Bands
Let us discuss trading strategies using Bollinger Bands–
- One should actually buy when the upper band is exceeded and short when the lower band is broken to the downside
- One should buy on strength as one approaches the upper band only if an indicator confirms and sell on weakness as the lower band is approached, if and only if confirmed by other indicators.
- One should buy near the lower band, using a W pattern and an indicator to clarify the setup and vice-versa
Bollinger Band %B Indicator Strategy
When determining if an asset’s price is high or low in relation to its recent price history, the Bollinger Band %B indicator is a helpful tool. The current position of the most current price in relation to the upper and lower Bollinger Bands is quantified by %B.
Bollinger Bands RSI Strategy
When paired with the Relative Strength Index (RSI), the Bollinger Bands (BB) and RSI can create a potent trading method for determining possible entry and exit locations. Using a combination of two widely used technical indicators, this method generates indications based on momentum (RSI) and price volatility (BB). Here’s how to put the Bollinger Bands RSI approach into practice:
Rules of Strategy:
- Buy Signal: When both requirements are satisfied, take a long position.
- The price either passes over or hits the lower Bollinger Band.
- An oversold threshold is crossed by the RSI (e.g., RSI > 30).
- Sell Signal: When both requirements are satisfied, take a short trade.
- The price either passes over or touches the upper Bollinger Band.
- An overbought threshold is crossed by the RSI (e.g., RSI < 70).
Signals of Exit:
Exit Long Position: When one of the following scenarios happens, leave the long position.
The price either passes over or touches the upper Bollinger Band.
A bearish threshold (e.g., RSI < 50) is crossed by the RSI. Either of the following two conditions must be met in order to exit the short position: The price either passes over or hits the lower Bollinger Band. A bullish threshold is crossed by the RSI (e.g., RSI > 50).
Combining Bollinger Bands with Other Indicators
Your trading technique will work better if you combine Bollinger Bands with other technical indicators since they will provide you more confirmation signals and help you weed out misleading signals. The following are a few well-liked indicators that work well with Bollinger Bands:
Moving Average
Strategy: Combine Bollinger Bands with a moving average (such the 50- or 200-day MA)Signal: Use Bollinger Band signals (e.g., price crossing outside the bands) in conjunction with price crosses above or below the moving average.
For instance: Purchase when the price crosses above the upper Bollinger Band and the 50-day moving average. Sell when the price breaks below both the lower Bollinger Band and the 50-day moving average.
MACD
Strategy: In addition to Bollinger Bands, use MACD to determine trend direction and momentum.
Signal: In addition to Bollinger Band signals, keep an eye out for MACD line crossovers and signal line crossovers.
For instance: Purchase when the price is above the middle Bollinger Band and the MACD line crosses above the signal line. When the price is below the middle Bollinger Band and the MACD line passes below the signal line, it is time to sell.
Limitation of Bollinger Bands
Although Bollinger Bands are a well-liked and useful tool for technical analysis, traders should be aware of the following limitations before incorporating them into their research and trading plans:
- Lagging Indicator: Because Bollinger Bands rely on moving averages and past price data, they naturally trail current price changes. There are situations where this lag leads to delayed signals, particularly in rapidly moving markets or during trend reversals.
- Whipsaw in Range-Bound Markets: Prices may frequently hit or cross the upper and lower bands in sideways or range-bound markets, producing erroneous signals known as “whipsaws.” These erroneous signals could cause traders to lose money if they are not properly screened.
- Bollinger Bands are mostly utilized for evaluating volatility and possible price reversals inside a specified range, so they are not ideal for trend identification on their own. They might not be adequate on their own to determine a trend’s intensity or direction.
- Dependency on Volatility Assumptions: The Bollinger Bands’ efficacy is contingent upon the notion that volatility follows a mean-reverting path. But markets can have protracted spikes or valleys in volatility, which can affect how reliable Bollinger Band signals are.
- Insensitive to Sudden Price Jumps: Bollinger Bands might not respond rapidly to abrupt and dramatic changes in price, including price gaps or events prompted by breaking news. They work better at capturing slow variations in price volatility.
Watch the video below to learn How to trade with Bollinger Bands:
Bottomline
Some of the concepts mentioned here are based on my personal interpretations and speculations inspired by the theories of John Bollinger and John Murphy. While they align with widely accepted principles, there is a non-zero possibility that these strategies and conclusions may have limitations. Therefore, rather than accepting them at face value, consider this technical analysis PDF as a tool to spark your own independent thought process and further exploration.
For more Market Updates, Visit StockEdge


I was thinking to buy a book on bollinger band analysis but was doubtful how much I would be able to put it to practical use. Now I am confident that I should definately buy and learn . Thanks to your easy explanation . I must say e learning is a really free school without any reward expectation but will get lot of ‘ dua ‘ . I personally wouldnt mind even paying for such service at all !
uday p dalvi
Mumbai
Thanks for such encouraging words Sir. Appreciate it to the core.
The lower band reflects an oversold area so when prices move towards the lower band doesn’t it generate a buy signal?
or does it depend on the type of stock?
Bollinger Bands theory is very well explained. This so helpful for beginners. Thanks for the content and making it so easy too follow !
Hi Rani,
Thank you for reading!
You can read more blogs on Technical Analysis here.
Keep Reading!
nice explain
Hi,
Thank you for reading!
For receiving updates on our new posts please register on our blog page!
Keep Reading!
WOW Sir/Madam,
That was a beautiful piece of information it enhanced my knowledge to greet extent.
God bless you.
Regards.
Irfan Zindran.
Hi,
Thank you for Reading!
Keep Reading
I do believe all of the ideas you’ve introduced in your post. They’re very convincing and will certainly work. Nonetheless, the posts are too short for beginners. May just you please prolong them a bit from next time? Thank you for the post.