Elearnmarkets - Financial Market Learning
  • Categories
    • Basic Finance
    • Derivatives
      • Futures
      • Options
    • Financial Planning
    • Fundamental Analysis
    • Technical Analysis
    • Marketshala
    • Miscellaneous
  • Language
    • English
    • Hindi
    • Bengali
No Result
View All Result
  • Courses
  • Webinars
  • Stories
Elearnmarkets - Learn Stock Market, trading, investing for Free
No Result
View All Result
Home Technical Analysis Charts, Patterns & Indicators
कैंडलस्टिक चार्ट की बुनियादी समझ 1

कैंडलस्टिक चार्ट की बुनियादी समझ

Elearnmarkets by Elearnmarkets
September 24, 2021
in Charts, Patterns & Indicators
Reading Time: 4 mins read
10
125.1k
VIEWS
Share on FacebookShare on XShare on WhatsApp

English: Click here to read this article in English.

तकनीकी विश्लेषण (Technical Analysis) के तहत, कैंडलस्टिक चार्ट किसी सिक्योरिटी की कीमतों में परिवर्तन का विश्लेषण करने के सबसे कुशल तरीकों में से एक है।

कैंडलस्टिक चार्ट्स की लोकप्रियता का एक कारण यह है कि वे बार और  लाइन चार्ट्स  की तुलना में अधिक आकर्षक हैं।

एक व्यापारी के लिए, कैंडलस्टिक चार्ट की दो सबसे पसंदीदा विशेषताएँ हैं:

  • प्रत्येक कैंडलस्टिक एक विशेष अवधि के दौरान व्यापारों की विशिष्ट संख्या के पूरा होने को दर्शाता है।
  • इससे यह भी पता चलता है कि उस विशेष अवधि के दौरान अधिक बिक्री का दबाव था या खरीदी का दबाव था।

इस ब्लॉग में, हम कैंडलस्टिक चार्ट और उनका विश्लेषण कैसे करें के बारे में विस्तार से चर्चा करेंगे:

Table of Contents
कैंडलस्टिक्स चार्ट का उद्गम
कैंडलस्टिक्स चार्ट का निर्माण
कैंडलस्टिक चार्ट पर पैटर्न की व्याख्या करना
कैंडलस्टिक चार्ट का विश्लेषण करते समय तीन मान्य ताएँ
  • एक को ताकत खरीदनी चाहिए और कमजोरी को बेचना चाहिए
  • एक को पैटर्न के साथ लचीला होना चाहिए
  • एक को पूर्व प्रवृत्ति की तलाश करनी चाहिए
महत्वपूर्ण सीख

कैंडलस्टिक्स चार्ट का उद्गम:

जापानी कैंडलस्टिक चार्ट भविष्य के मूल्य उतार-चढ़ाव का विश्लेषण करने के लिए इस्तेमाल की जाने वाली सबसे पुरानी प्रकार की चार्टिंग तकनीक है।

1700 के दशक में, कैंडलस्टिक चार्ट के शुरुआती रूपों का इस्तेमाल चावल की कीमतों का अनुमान लगाने के लिए किया गया था।

1750 में, मुनेहिसा होमा के नाम से एक जापानी व्यापारी ने अपने कैंडलस्टिक विश्लेषण का इस्तेमाल सकाता में चावल के आदान-प्रदान में व्यापार करने के लिए करना शुरू किया।

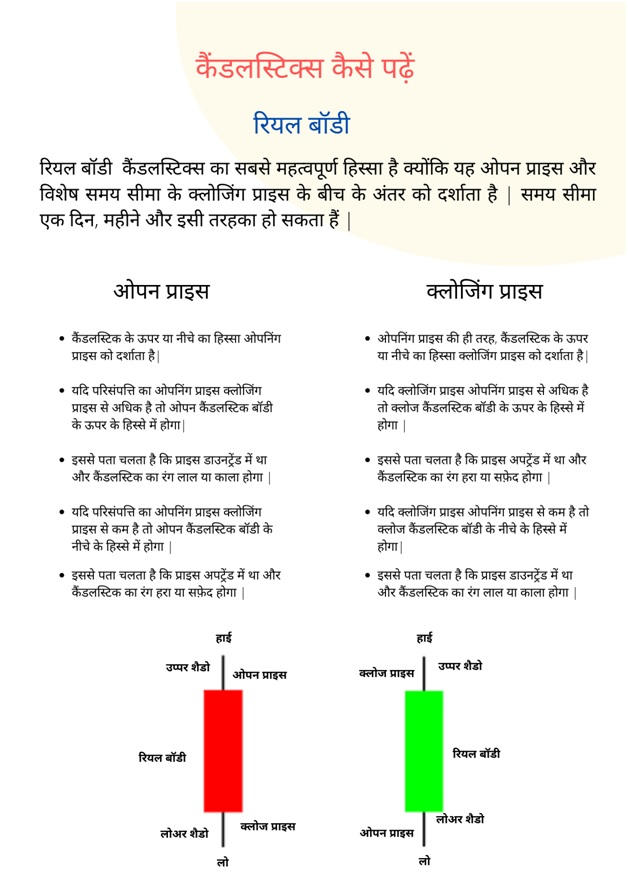
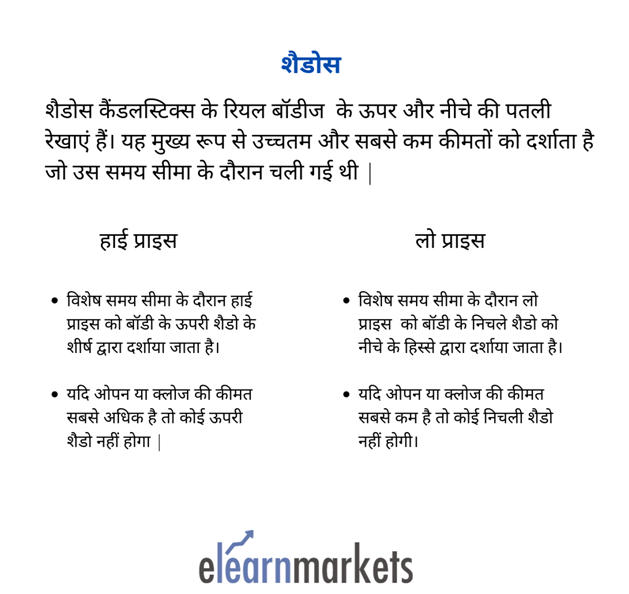
कैंडलस्टिक चार्ट का निर्माण:

प्रत्येक कैंडलस्टिक मुख्य रूप से रियल बॉडी और विक्स से बना होता है जिसे शड़ौस या टेल्स के रूप में भी जाना जाता है:

रीड कैंडलस्टिक चार्ट
शैडोस कैंडलस्टिक चार्ट

कैंडलस्टिक चार्ट पर पैटर्न की व्याख्या करना:

जैसा कि कैंडलस्टिक्स अधिक आकर्षक होती हैं, व्यापारी ऐसी कैंडलस्टिक पैटर्न की तलाश करता है जो निरंतरता या उलट-फेर हो सकती हो।

इन कैंडलस्टिक पैटर्न को मंदी और तेजी वाली कैंडलस्टिक पैटर्न में भी वर्गीकृत किया जा सकता है।

मार्केट एक्सपर्ट्स से कैंडलस्टिक विश्लेषण की मूल बातें सीखें

कैंडलस्टिक पैटर्न एक एकल कैंडलस्टिक पैटर्न हो सकता है या दो-तीन कैंडलस्टिक्स को मिलाकर बनाया जा सकता है।

इस तरह के कैंडलस्टिक पैटर्न के कुछ उदाहरण हैं:

एकल कैंडलस्टिक पैटर्न का उदाहरण:

  • मारूबोज़ू
  • डोजी
  • स्पिनिंग टॉप्स
  • हैमर
  • हैंगिंग मैन
  • शूटिंग स्टार

कई कैंडलस्टिक पैटर्न्स कई कैंडल्स द्वारा बनाई जाती है।

कई कैंडलस्टिक पैटर्न का उदाहरण:

  • एंगलफ़ींग पैटर्न

o बुलिश एंगलफ़ींग

o बीयरिश एंगलफ़ींग

  • हारामी

o बुलिश हारामी

o बीयरिश हारामी

  • पियर्सिंग पैटर्न
  • डार्क क्लाउड कवर
  • मॉर्निंग स्टार
  • इवनिंग स्टार

कैंडलस्टिक चार्ट का विश्लेषण करते समय तीन मान्य ताएँ:

1. एक को ताकत खरीदनी चाहिए और कमजोरी को बेचना चाहिए:

शक्ति आमतौर पर एक तेजी (हरे) कैंडल द्वारा दर्शायी जाती है जबकि कमजोरी एक मंदी (लाल) कैंडल द्वारा दर्शायी जाती है।

आम तौर पर हरे रंग की कैंडल के दिन खरीदना चाहिए और लाल कैंडल के दिन बेचना चाहिए।

2. एक को  पैटर्न के साथ लचीला होना चाहिए:

बाजार की स्थितियों के कारण पैटर्न में मामूली बदलाव हो सकते हैं।

इसलिए, चार्ट पर इन कैंडलस्टिक पैटर्न का विश्लेषण करते समय थोड़ा फ्लेक्सिबल होना चाहिए।

3. एक को पूर्व प्रवृत्ति की तलाश करनी चाहिए:

अगर आप तेजी से कैंडलस्टिक पैटर्न की तलाश कर रहे हैं तो पूर्व प्रवृत्ति मंदी होनी चाहिए और इसी तरह, अगर आप एक मंदी के पैटर्न की तलाश कर रहे हैं तो पूर्व प्रवृत्ति तेज होनी चाहिए।

महत्वपूर्ण सीख:

  • कैंडलस्टिक चार्ट एक प्रकार के तकनीकी चार्ट हैं जो बार चार्ट या लाइन चार्ट के समान मूल्य के उतार-चढ़ाव का विश्लेषण करते हैं।
  • प्रत्येक कैंडलस्टिक मुख्य रूप से वास्तविक शरीर और विक्स से बना होता है जिसे छाया या पूंछ के रूप में भी जाना जाता है:
  • संपत्ति का शुरुआती मूल्य> समापन मूल्य = ओपन कैंडलस्टिक बॉडी के शीर्ष पर होगा।
  • संपत्ति का समापन मूल्य> प्रारंभिक मूल्य = क्लोज कैंडलस्टिक बॉडी के शीर्ष पर होगा।
  • जैसा कि कैंडलस्टिक्स अधिक आकर्षक होती हैं, व्यापारी ऐसी कैंडलस्टिक पैटर्न की तलाश करता है जो निरंतरता या उलट-फेर हो सकती हो।
Tags: basiccandlestickcandlestick analysiscandlestick beginners guidecandlestick chartscandlestick patternhindijapanese candletsicks
Share7TweetSend
Get Kotak Offer Get Kotak Offer Get Kotak Offer
Previous Post

22 Important Banking Terms you need to know

Next Post

चेक के बाउंस होने के 12 कारण

Elearnmarkets

Elearnmarkets

Elearnmarkets (ELM) is a complete financial market portal where the market experts have taken the onus to spread financial education. ELM constantly experiments with new education methodologies and technologies to make financial education effective, affordable and accessible to all. You can connect with us on Twitter @elearnmarkets.

Related Posts

How to Trade with Bullish Engulfing and Bearish Engulfing Patterns 2
Technical Analysis

How to Trade with Bullish Engulfing and Bearish Engulfing Patterns

December 8, 2023
29.7k
Piercing Pattern - How to trade with Piercing Candlestick? 3
Technical Analysis

Piercing Pattern – How to trade with Piercing Candlestick?

December 7, 2023
19.8k
Top 10 Chart Patterns you should know when Trading in the Stock Market 4
Technical Analysis

Top 10 Chart Patterns you should know when Trading in the Stock Market

December 5, 2023
167.6k
5 Powerful Bearish Candlestick Patterns 5
Technical Analysis

5 Powerful Bearish Candlestick Patterns

November 30, 2023
99.1k

Comments 10

  1. AffiliateLabz says:
    4 years ago

    Great content! Super high-quality! Keep it up! 🙂

    Reply
  2. Season Mallone says:
    4 years ago

    Hello there, I discovered your web site via Google while searching for a related topic, your web site came up, it appears good. I have bookmarked it in my google bookmarks.

    Reply
  3. Be in Hindi says:
    3 years ago

    काफी अच्छी जानकारी प्रदान की है आपने | धन्यवाद

    Reply
  4. ROHITIT says:
    3 years ago

    Thanks allot

    Reply
  5. Pavan says:
    3 years ago

    Nice artical

    Reply
    • Sakshi Agarwal says:
      3 years ago

      Hi,

      We are glad that you liked our blog post.

      Thank you for Reading!

      Reply
      • Gurmeet Singh says:
        2 years ago

        Hi can learn more about candles analysis

        Reply
        • Sakshi Agarwal says:
          2 years ago

          Hi,

          You can check our course on CANDLESTICKS MADE EASY to learn more about candlesticks

          Keep Reading!

          Reply
  6. Chandra prakash says:
    2 years ago

    Nice👍😊

    Reply
    • Sakshi Agarwal says:
      2 years ago

      Hi,

      We really appreciated that you liked our blog.

      Keep Reading!

      Reply

Leave a Reply Cancel reply

Your email address will not be published. Required fields are marked *

Elearnmarkets Logo

Follow Us

Facebook-f Twitter Instagram Linkedin-in Youtube Telegram

Register on Elearnmarkets

Continue your financial learning by creating your own account on Elearnmarkets.com

Register Free Account

Download App

Playstore logo
Download on app store

Categories

  • Basic Finance
  • Derivatives
  • Financial Planning
  • Fundamental Analysis
  • Technical Analysis
  • Marketshala
  • Miscellaneous

Popular On Elearnmarkets

  • Market Superheroes:
  • Vivek Bajaj
  • Chetan Panchamia
  • Ashish Kyal
  • Premal Parekh
  • Abhijit Paul
  • Jegan
  • Sivakumar Jayachadran
  • Vishal Malkan
  • Jyoti Budhia
  • Vivek Gadodia
  • Vishal Mehta
  • Piyush Chaudhry
  • Santosh Pasi
  • Gomathi Shankar
  • Market Superheroes:
  • Vivek Bajaj
  • Chetan Panchamia
  • Ashish Kyal
  • Premal Parekh
  • Abhijit Paul
  • Jegan
  • Sivakumar Jayachadran
  • Vishal Malkan
  • Jyoti Budhia
  • Vivek Gadodia
  • Vishal Mehta
  • Piyush Chaudhry
  • Santosh Pasi
  • Gomathi Shankar
  • Courses:​
  • Options Trading
  • Dow Theory
  • Momentum Trading
  • Stock Investing
  • Stock Market for Beginners
  • Harmonic Chart Patterns
  • Algo Trading
  • Elliot Wave Theory
  • Advanced Excel
  • Cryptocurrency
  • NSE Certification Course
  • Courses:​
  • Options Trading
  • Dow Theory
  • Momentum Trading
  • Stock Investing
  • Stock Market for Beginners
  • Harmonic Chart Patterns
  • Algo Trading
  • Elliot Wave Theory
  • Advanced Excel
  • Cryptocurrency
  • NSE Certification Course
  • Webinars:
  • Bank Nifty Scalping
  • Intraday Trading Strategies
  • Options Trading Strategies
  • Options selling
  • Price Action
  • Relative Strength
  • Tax Planning
  • Options Buying
  • Growth Stocks
  • Portfolio Management
  • Relative Strength Index
  • Risk Management
  • Renko Charts
  • Crude Oil
  • Traders Psychology
  • Moving Average
  • Multibagger Stocks
  • Free Learning Modules:
  • Intraday Trading
  • Options Scalping
  • Swing Trading
  • Financial Modelling
  • RSI Indicator
  • Bollinger Bands
  • Pricing of Futures
  • Personal Finance
  • Initial Public Offerings (IPO)
  • Value Investing
  • Technical Indicators
  • Candlesticks
  • Chart Patterns
  • Option Greeks
  • ELSS Funds
  • Banking and Insurance
  • Real Estate
  • Gold
  • Book Summaries:
  • Rich Dad Poor Dad
  • Psychology of Money
  • The Intelligent Investor
  • The Richest Man in Babylon
  • Think and Trade Like a Champion
  • Value Investing and Behavioural Finance
  • Trading in the Zone
  • Learn to Earn
  • Book Summaries:
  • Rich Dad Poor Dad
  • Psychology of Money
  • The Intelligent Investor
  • The Richest Man in Babylon
  • Think and Trade Like a Champion
  • Value Investing and Behavioural Finance
  • Trading in the Zone
  • Learn to Earn
  • Tools:
  • CAGR Calculator
  • SIP Calculator
  • eLearnOptions
  • Future Value Calculator
  • Present Value Calculator
  • Atal Pension Yojana
  • Cost of Delay Calculator
  • Become a Crorepati
  • Tools:
  • CAGR Calculator
  • SIP Calculator
  • eLearnOptions
  • Future Value Calculator
  • Present Value Calculator
  • Atal Pension Yojana
  • Cost of Delay Calculator
  • Become a Crorepati

© 2023 Elearnmarkets. All Rights Reserved

  • Visit Elearnmarkets
  • Courses
  • Webinars
  • Financial Guides
  • Get Free Counselling
  • Visit Elearnmarkets
  • Courses
  • Webinars
  • Financial Guides
  • Get Free Counselling

Get Elearnmarkets App

No Result
View All Result
  • Article Categories
    • Basic Finance
    • Derivatives
    • Financial Planning
    • Fundamental Analysis
    • Technical Analysis
    • Marketshala
    • Miscellaneous
  • Language
    • Hindi
    • Bengali
    • English
  • Courses
  • Webinars
  • Stories

© 2020 Elearnmarkets All Rights Reserved

Guidebook On Chart Patterns
Take Your Trading To The Next Level With Strategies Shared In This Ebook
Download Now
Masterclass on Short-term Momentum Trading
Harness the Power of Market Momentum to Identify High Probability Trading Setups