An Options-Based Approach to Volatility Trading
This blog explores options-based volatility trading, helping you navigate price fluctuations and potentially profit from market uncertainty.
This blog explores options-based volatility trading, helping you navigate price fluctuations and potentially profit from market uncertainty.

A moving average is one of the lagging technical indicators which the traders and investors use for determining the trend’s...
Unlock the secrets of support and resistance levels by harnessing open interest data. Discover how to calculate these crucial markers...
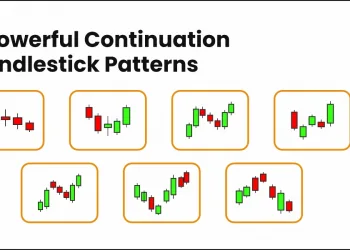
Learn about powerful continuation candlestick patterns that signal trend resumption in the financial markets.
India Vix Falling? But what does it means? Read to understand the interpretation of this index
Read to know 5 Proven Strategies When the Stock Market Crashes
Here is a comprehensive guide on 35 Candlestick Chart Patterns and how to trade with these candlesticks.
The SuperTrend indicator is a popular trend-following tool that uses price action and volatility to signal buy and sell opportunities....
Learn how the pre-open market trading session before regular market hours aids in price discovery, reduces volatility, and offers insights...
In the 1980s, a tool named “Bollinger Bands” was invented by John Bollinger. These bands are volatility indicators similar to...
The Chaikin Money Flow Indicator is a volume indicator created by Marc Chaikin (as well as the Chaikin oscillator). In...
Miss the Indian stock market rally? Don't fret! This guide explores investment options for those who want to enter the...
