
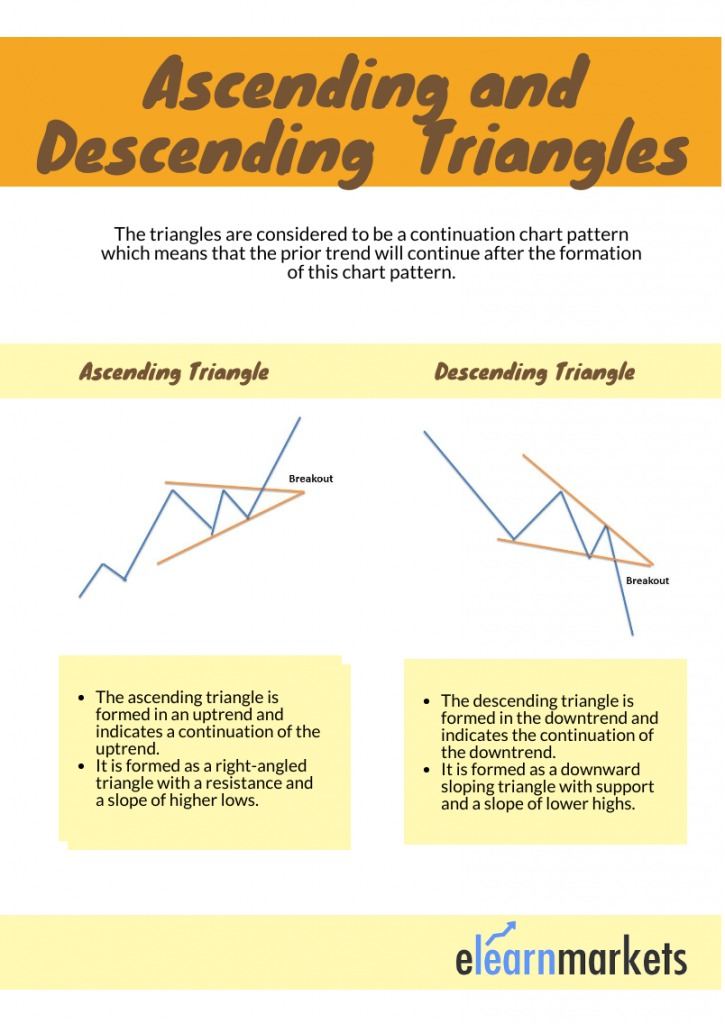
The triangle pattern is considered to be a continuation chart pattern which means that the prior trend will continue after the formation of this chart pattern.
The formation of a triangle pattern includes at least five touches of support and resistance. It involves prices moving in the tighter and tighter range in a triangle pattern which shows the battle between the bears and bulls.
The triangle pattern is mainly of three types- symmetrical pattern, ascending triangle, and descending triangles.
In this blog, we will be discussing ascending and descending triangles and how to trade with them:
Table of Contents
What is the Ascending Triangle?
The ascending triangle is formed in an uptrend and indicates a continuation of the uptrend. It is formed as a right-angled triangle with resistance and a slope of higher lows. The resistance does not allow the prices of the securities to move upward.
The higher lows show that the buying pressure has increased. This pattern clearly indicates that the market moves higher as the higher lows are formed heading toward the resistance line.
This indicates the strength of bulls and bulls are willing to pay more for the stock.
The breakout of the prices is confirmed when the prices break from the resistance level with volume and continue to move upwards.
What is the Descending Triangle?
The descending triangle is formed in the downtrend and indicates the continuation of the downtrend. It is formed as a downward-sloping triangle with support and a slope of lower highs.
The support does not allow the prices of the securities to move downward. The lower highs show that the selling pressure has increased. This pattern clearly indicates that the market moving lower as the lower highs are formed heading toward the support line.
This indicates the strength of bears and they are willing to sell more for the stock. The breakout of the prices is confirmed when the prices break from the support level with volume and continue to move down.
Formation of Ascending and Descending Triangle Pattern
Below is the formation of the Ascending and Descending Triangle Pattern:
Trading with Ascending Triangle Pattern
There are certain factors that one should consider when trading with the Ascending Triangle Pattern:
- The prior trend should be an uptrend.
- There should be a horizontal line acting as a resistance level and prices should be making higher lows.
- The prices should continue to move up after the breakout from the resistance level.
Example
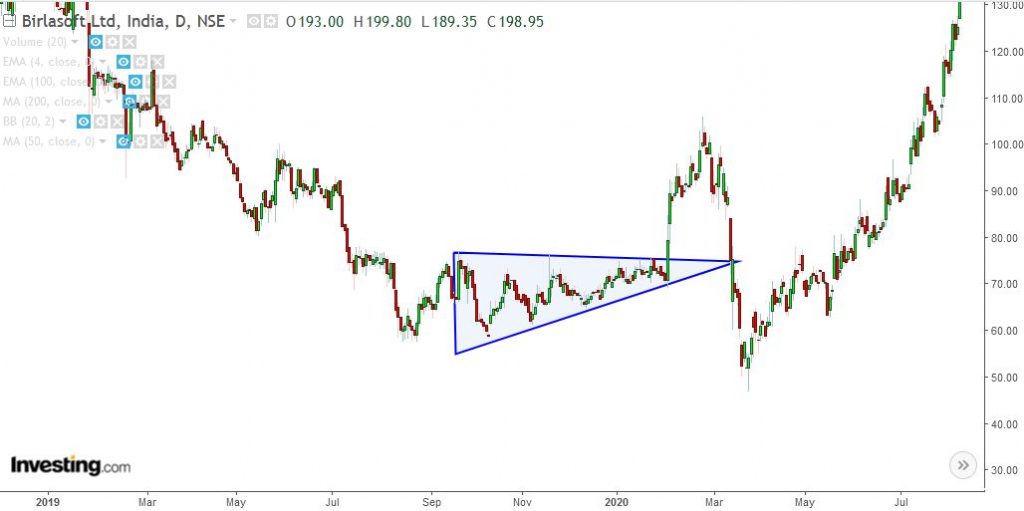
Below is an example of an ascending triangle pattern formed in the daily chart of Birlasoft Ltd. after an uptrend:
Price Target
The price target can be set as the width of the ascending triangle from its high to low and then add this value to the breakout level.
Stop Loss
The stop loss can be placed at the resistance level.
Trading with Descending Triangle Pattern
There are certain factors that one should consider when trading with the descending triangle pattern:
- The prior trend should be downtrend.
- There should be a horizontal line acting as a support level and prices should be making lower highs.
- The prices should continue to move down after the breakout from the support level.
Example
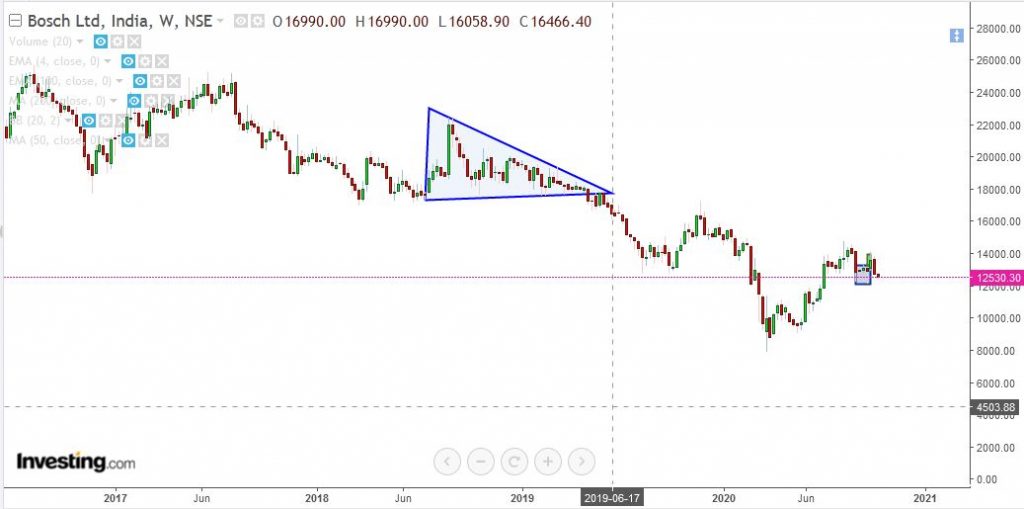
Below is an example of a descending triangle pattern formed in the weekly chart of Bosch Ltd. after the downtrend:
Price Target
The price target can be set as the width of the descending triangle from its high to low and then add this value to the breakout level.
Stop Loss
The stop loss can be placed at the support level.
How to filter Stocks using Ascending and Descending Triangles screeners?
There are so many stocks in which this chart pattern is formed and it is difficult for traders to look at the charts of more than 500 stocks for finding this pattern.
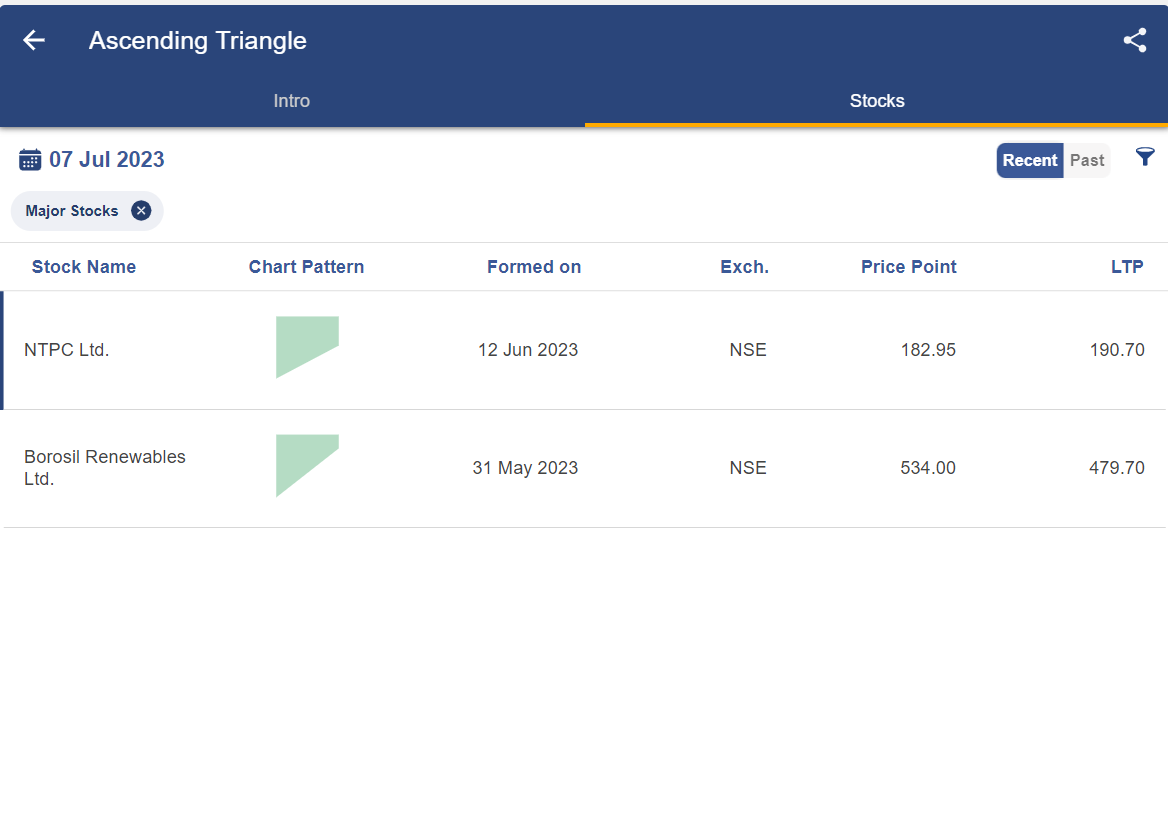
So, with the help of StockEdge, one can filter out stocks in which the ascending and descending triangles are formed:
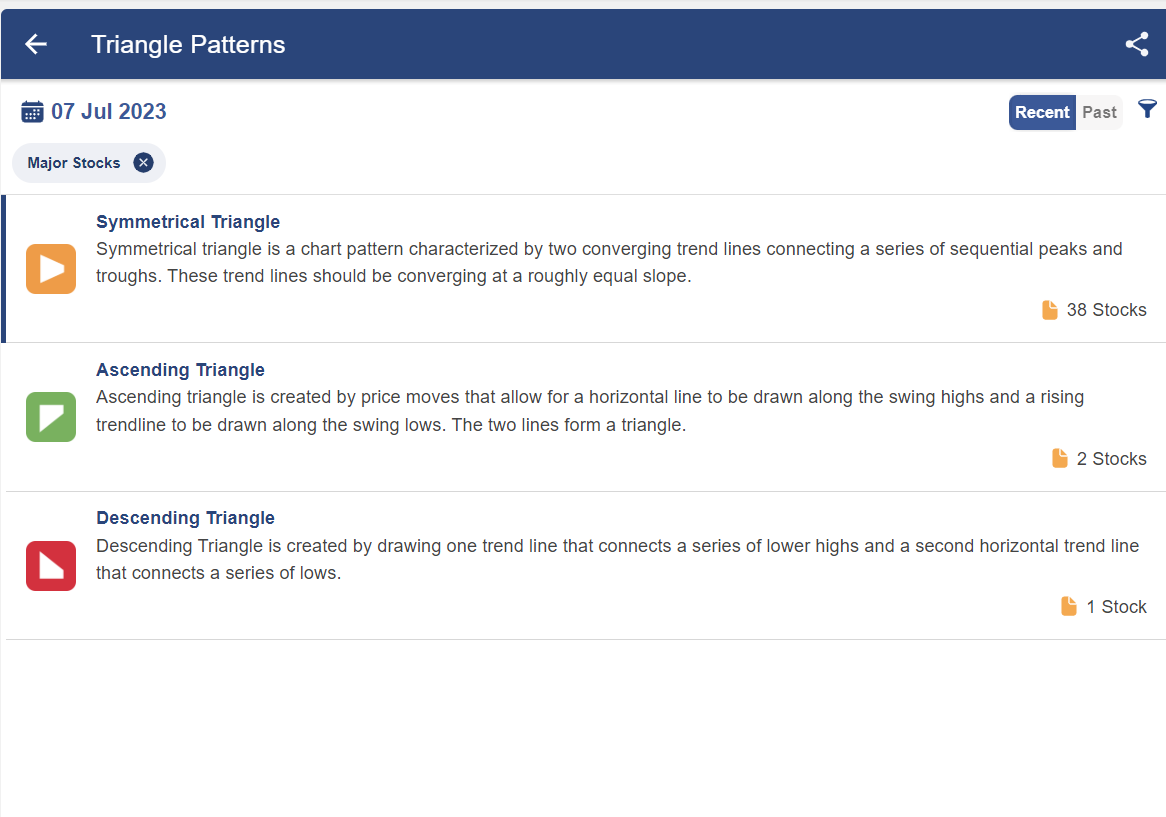
After clicking on the ascending triangles, you will get a list of stocks in which this pattern is formed:
After clicking on any of the above stocks, you will get a technical chart showing the pattern below:
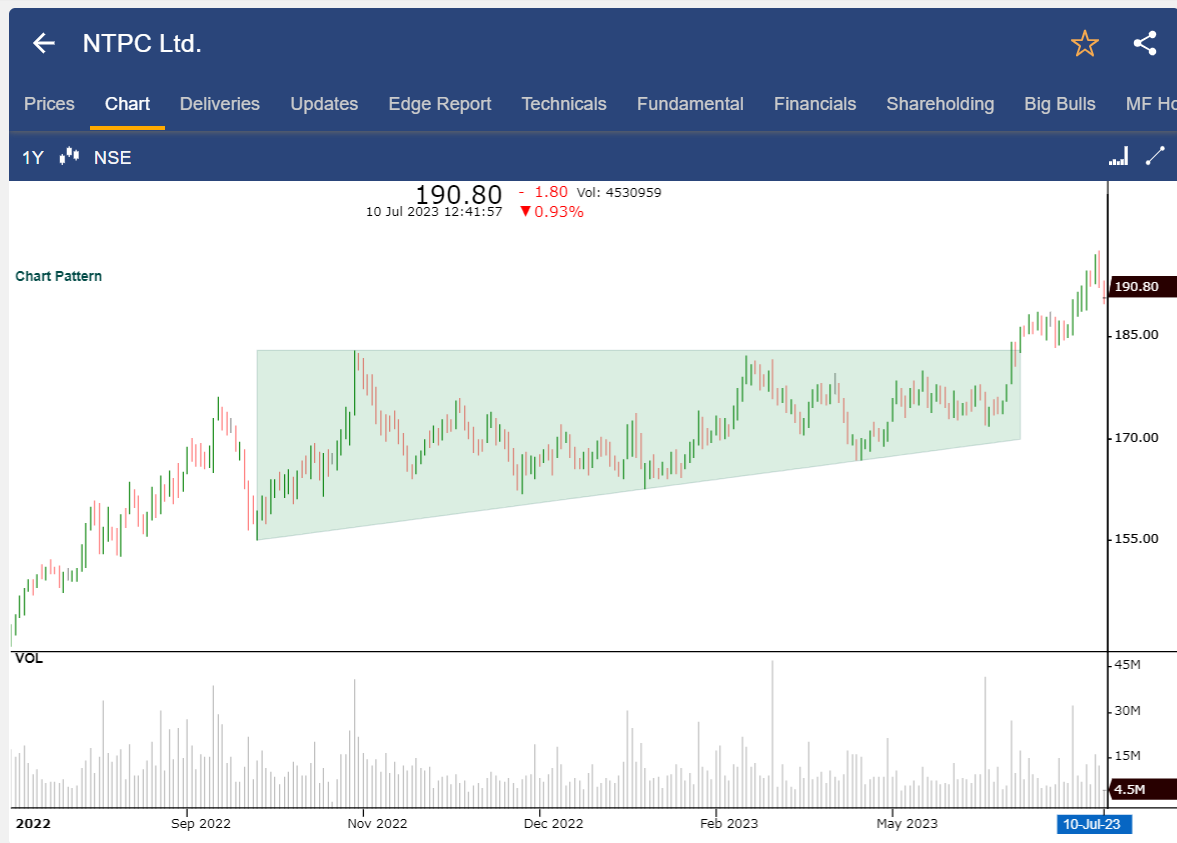
Once you have identified this chart pattern in the stocks, you can trade accordingly as discussed above.

You can also read more on Chart Patterns from our ELM School
Bottomline
The triangles are considered to be a continuation chart pattern which means that the prior trend will continue after the formation of this chart pattern. The ascending triangle is formed in an uptrend and indicates the continuation of the uptrend. The descending triangle is formed in the downtrend and indicates the continuation of the downtrend. There are certain factors that one should consider when trading with the descending and ascending triangle pattern.
Frequently Asked Questions (FAQS)
What is descending and ascending triangle pattern?
The triangles that are rising and descending are continuation patterns. A horizontal lower trend line and a descending upper trend line define the descending triangle. On the highs and lows of the ascending triangle, respectively, there is a horizontal trend line.
What is the descending triangle?
A notable technical analysis pattern that denotes a negative market is the falling triangle. It develops as a continuation pattern during a downturn and is distinguished by a horizontal line at the bottom created by comparable lows and a descending trend line at the top created by declining peaks.
Is descending triangle bullish or bearish?
A bearish configuration that appears in both uptrends and downtrends is a descending or falling triangle. Thus, if it appears during an uptrend or a downtrend, it denotes a trend reversal, respectively.
What is the difference between ascending and descending triangle stocks?
A price break through a barrier level in an ascending triangle denotes a bullish outlook, whereas a price break through a support level in a descending triangle denotes a bearish outlook. These patterns can be used by traders to pinpoint probable entry and exit locations for lucrative transactions.


