In 1987, J. Welles Wilder developed the Average Directional Index (ADX) as an indicator of trend strength. He developed the ADX Indicator with commodities and daily prices in mind, but it can also be applied to stocks.
ADX quantifies the price’s velocity regardless of its north/south/eastward movement. Hence, two other lines, the Positive Directional Indicator (+DI) and Negative Directional Indicator (-DI), are used in the charting system to complement ADX.
Nowadays, it has become one of the favourite indicators for technical analysts, who study the historical price against time to analyse the market’s supply and demand forces.
Table of Contents
“Trend is your friend” is a common belief of traders.
Once the trend is identified, the next important thing is “timing”. The challenge is to determine the best time to enter and exit a trade. Hence, a chartist can use the trio of lines together, as discussed above, to determine both the direction and strength of the trend.
The backbone of ADX Indicator
Directional movement indicators (DMI) i.e. Positive Directional Indicator (+DI) & Negative Directional Indicator (-DI) act as the pillars of ADX, which is a moving average of the DMI.
DMI is used to identify a definable trend.
The scale for the DMI ranges from 0 to 100. Any negative value in DMI is considered as zero.
Positive Directional Indicator (+DI)
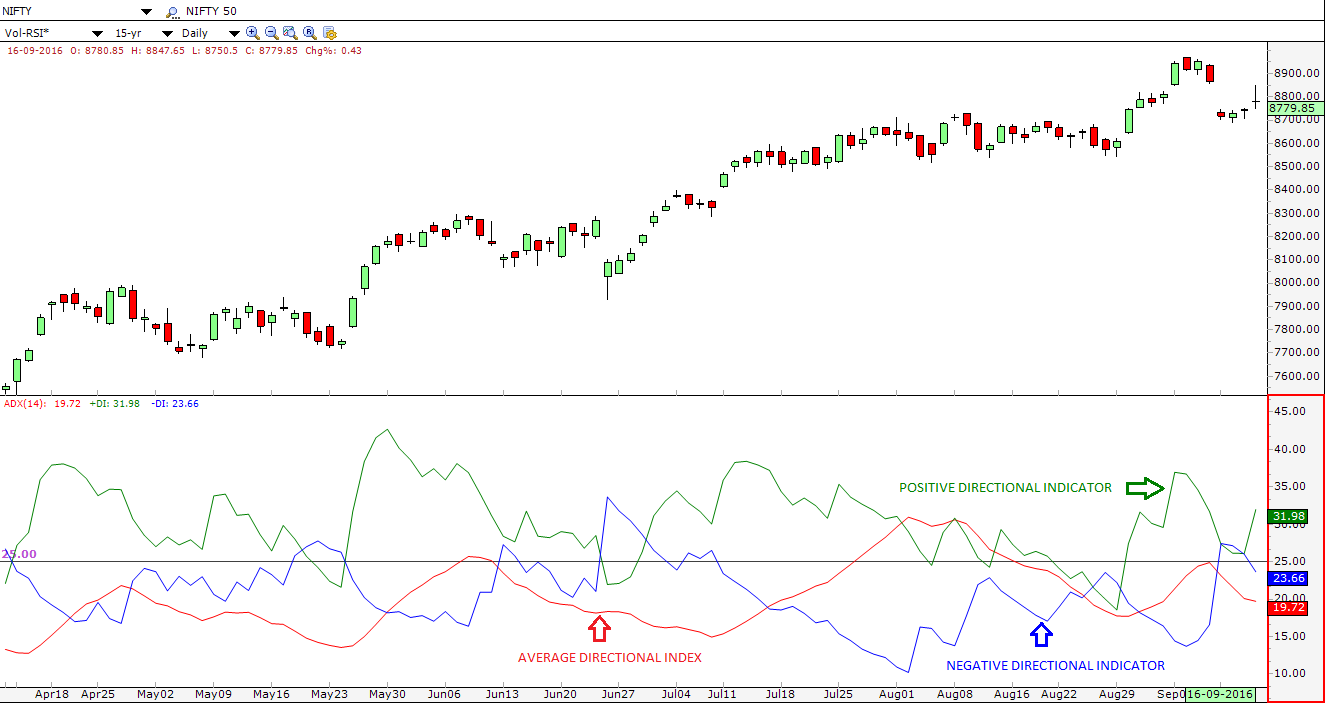
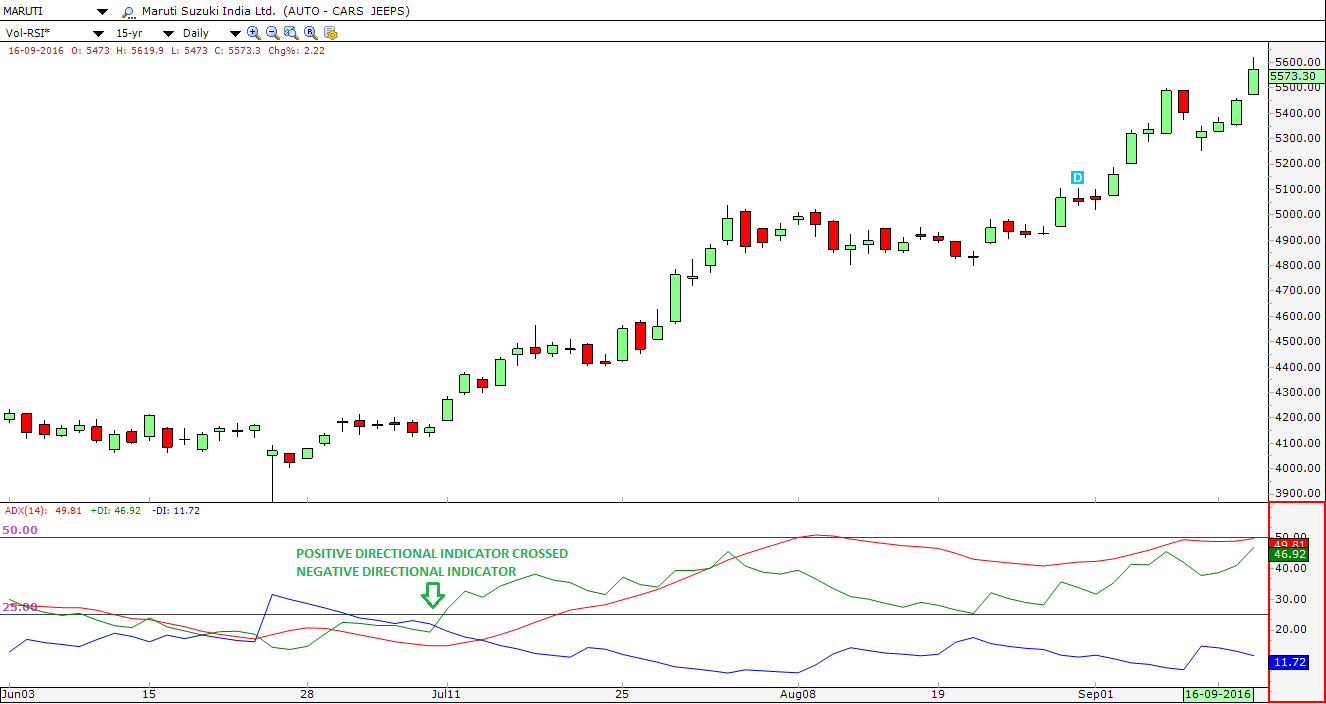
Analysts watch for the Positive Directional Indicator to cross above the Negative Directional Indicator to mark the beginning of an uptrend.
It should have an upward-sloping curve to represent the uptrend. The steeper the curve, the stronger the uptrend.
The DMI is positive (plus) when the current high minus the prior high is greater than the prior low minus the current low. It is a key component in the calculation of ADX.
Negative Directional Indicator (-DI)
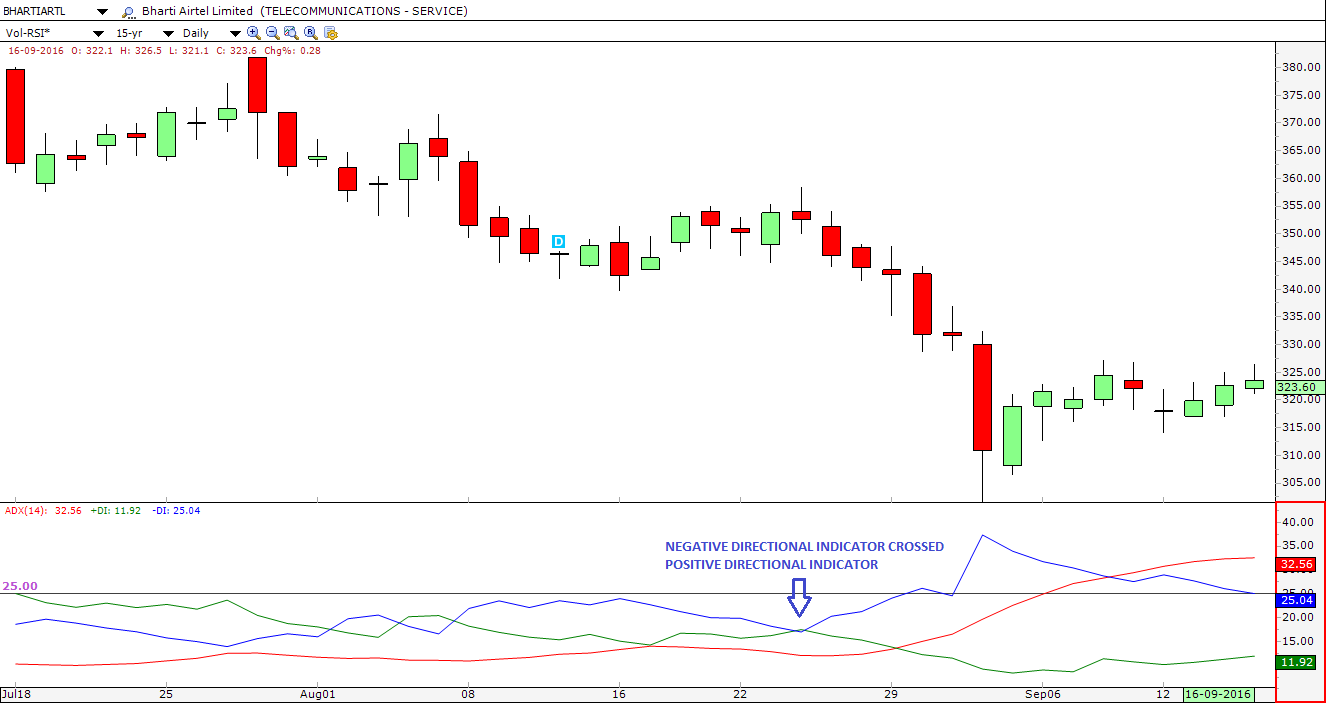
Analysts watch for the negative directional indicator to cross above the positive directional indicator to mark the beginning of a downtrend.
It should have an upward-sloping curve to represent the downtrend.
The steeper the curve, the stronger the downtrend. The DMI is negative (minus) when the prior low minus the current low is greater than the current high minus the prior high.
It is a key component in the calculation of ADX.
Calculation of ADX
To calculate +DI and −DI, a chartist needs price data consisting of High(H), Low(L), and Closing(C) prices of each period.
Once the data is available one can analyse and predict the trend accordingly.
After adjusting the number of periods (Wilder used 14 days), +DI and −DI are:
+DI = 100 times the smoothed moving average of (+DM) divided by average true range*
−DI = 100 times the smoothed moving average of (−DM) divided by average true range
The smoothed moving average is calculated over the number of periods selected, and the average true range is a smoothed average of the true ranges. So,
A.D.X. = 100 times the smoothed moving average of the absolute value of (+DI − −DI) divided by (+DI + −DI)
Note – Variations of this calculation typically involve using different types of moving averages, such as an EMA, WMA etc.
Average True Range (ATR)
It is an indicator developed by Welles Wilder to measure volatility in commodities. A volatility formula based only on the high-low range would fail to capture volatility from gap or limit moves.
Hence, to capture this “missing” volatility Wilder created ATR. It does not provide an indication of price direction. Rather, it only describes volatility.
Calculation
Normally, the ATR is based on 14 periods and can be calculated on any time frame.
To start the process we need to find the first TR** value which is simply the High minus the Low, and the first 14-day ATR which is the average of the daily TR values for the last 14 days.
Then Wilder sought to smooth the data by incorporating the previous period’s ATR value.
Current ATR = [(Prior ATR x 13) + Current TR] / 14
– Multiply the previous 14-day ATR by 13.
– Add the most recent day’s TR value.
– Divide the total by 14
**True Range (TR) is a concept started by Wilder, which is defined as –
- Method 1: Current High less the Current Low
- Method 2: Current High less the Previous Close (Absolute value)
- Method 3: Current Low less the Previous Close (Absolute value)
Note – Absolute values are used to ensure positive numbers.
ADX Indicator Scale
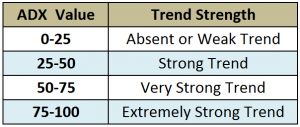
Basic Strategy
By quantifying the trend strength, a chartist can identify the strongest and most profitable trends to trade.

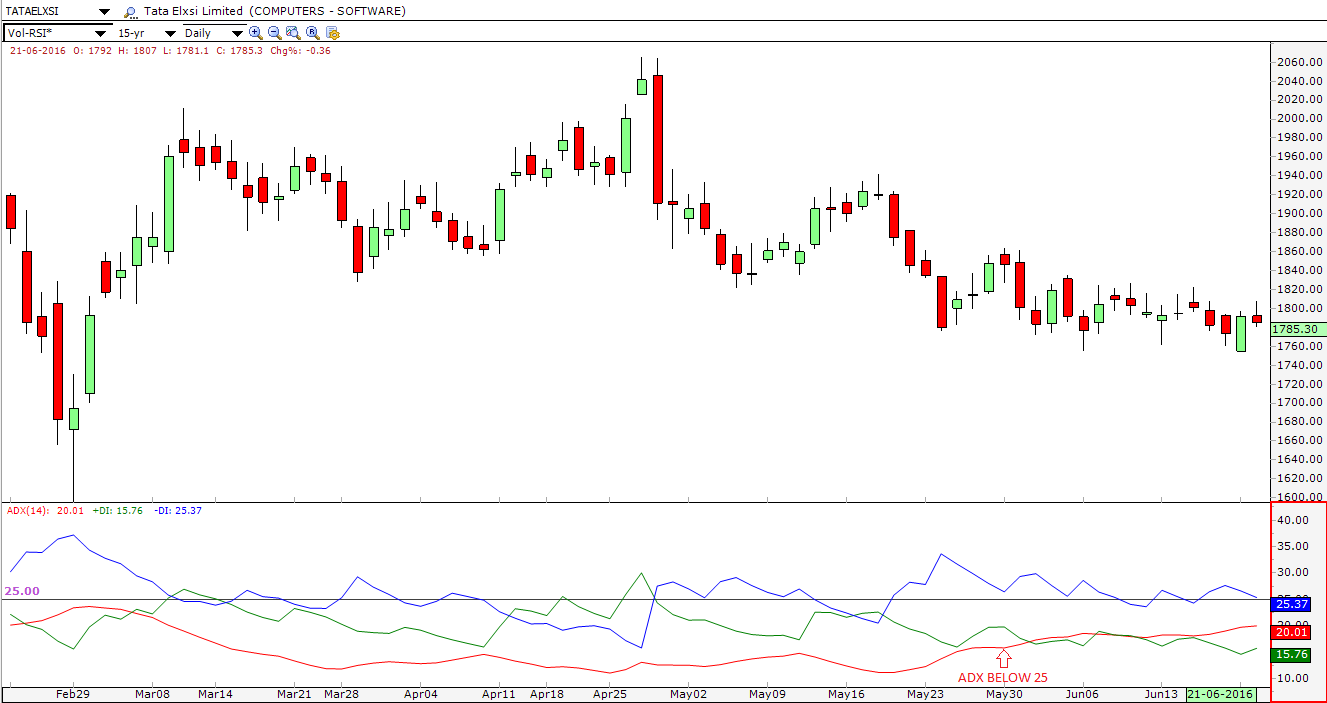
A lower value indicates a sign of accumulation or distribution. On average, if ADX is below 25 for more than 30 bars, the price enters into a range and has a possibility to consolidate.
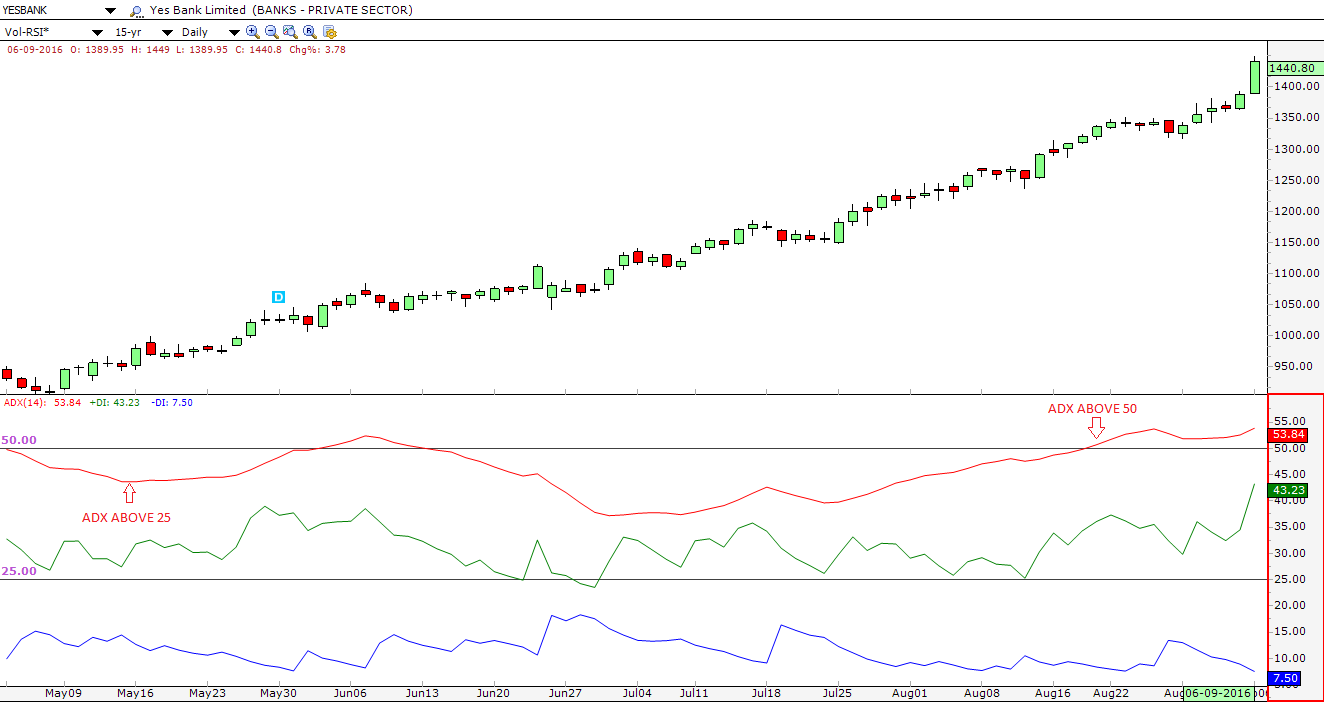
From this choppy movement, it gives a break out to initiate a new trend. Accordingly, when the ADX line rises, trend strength also increases.
To mark the beginning of uptrend chartists watch for the Positive Directional Indicator to cross above the Negative Directional Indicator, whereas, to mark the beginning of a downtrend chartists watch for the Negative Directional Indicator to cross above the Positive Directional Indicator.
There is a common misperception that a falling ADX will reverse the trend.
It simply means the strength of the trend is weakening. In layman’s terms, a series of higher ADX peaks means trend momentum is increasing, whereas a series of lower ADX peaks means trend momentum is decreasing.
It can also show momentum divergence. It suggests that price makes a higher high and ADX makes a lower high.
Divergence is not a signal for a reversal but just a warning that trend momentum is changing. It may lead to trend continuation, consolidation, correction or reversal. ADX not only helps to identify breakouts but also to understand when breakouts are valid.
When it crosses 25 from below, the trend gets strong enough to continue in the direction of the breakout.
Bottomline
A trader gains the most from trading the strongest trends. The ADX indicator not only helps the chartist identify trending conditions but also finds the strongest trends to trade. It also protects a risk-averse trader by alerting him to changes in trend momentum. However, in the end, it is the chartist’s ability to quantify trend strength and stay one step ahead that matters. Thus, ADX should be used in tandem with other technical indicators and chart patterns to generate better trading signals.
Frequently Asked Questions (FAQs)
What is the Average Directional Index?
A technical indicator called the Average Directional Index (ADX) is used to gauge how strong a trend is. It is a component of the Directional Movement System, a larger set of technical indicators.
How is Average Directional Index calculated?
The smoothed moving average of price changes over a given time period is used to calculate ADX. Together with the ADX itself, the formula also entails calculating the positive and negative directional movements (+DM and -DM) and their smoothed averages.
What does the Average Directional Index value indicate?
Typically, the ADX value falls between 0 and 100. A market that is ranging or has a weaker trend is indicated by a lower ADX number, whereas a higher ADX value indicates a stronger trend. In general, a strong trend is present when the ADX value is above 25, and a weak trend is present when the reading is below 20.
You can also use Average Directional Scans in StockEdge


