


- What Is a Stock Market Crash? Crash vs Correction
- Stock Market Crash History in India: Four Major Events That Shook Investors
- Case 1: The 2008 Global Financial Crisis and the Indian Stock Market Crash
- Case 2: The 2020 COVID-19 Stock Market Crash
- 2008 vs 2020: How Were the Two Stock Market Crashes Different?
- What Long-Term Investors Should Take Away
- Conclusion
On 23 March 2020, India’s stock market witnessed one of its sharpest single-day falls as the COVID-19 pandemic triggered panic among investors. The Sensex plunged nearly 13% in a single session. For many investors, watching their portfolios lose value so quickly brought back a familiar fear: should I sell now, or wait for the market to recover?
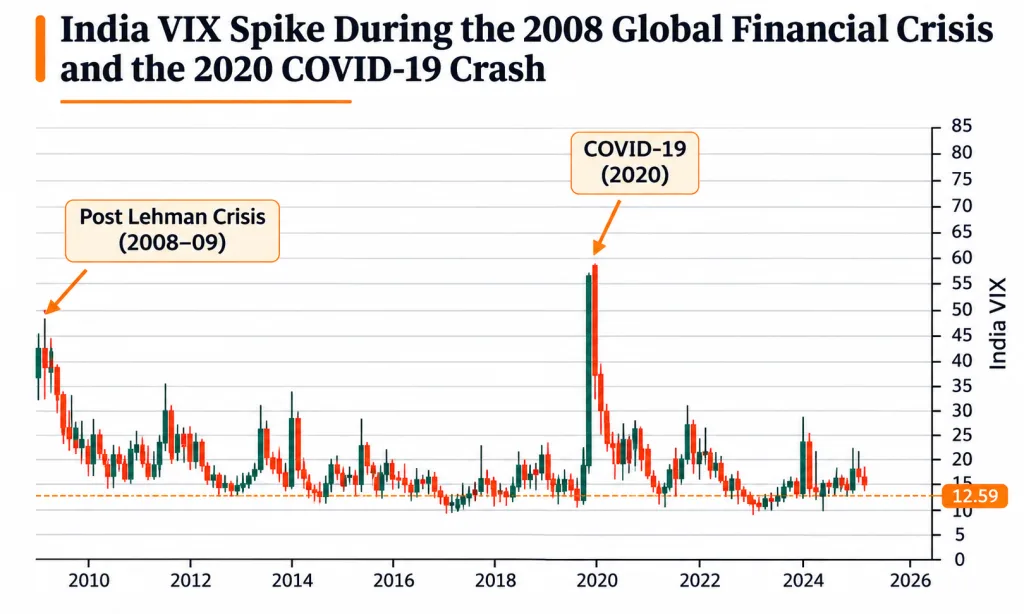
This wasn’t the first time Indian investors had faced such uncertainty. During the 2008 global financial crisis, the market fell by nearly 64%, while the 2020 COVID-19 crash wiped out approximately 40% from its peak. Despite happening more than a decade apart and being triggered by very different events, both episodes raised the same question for investors: what should you do when the stock market crashes?
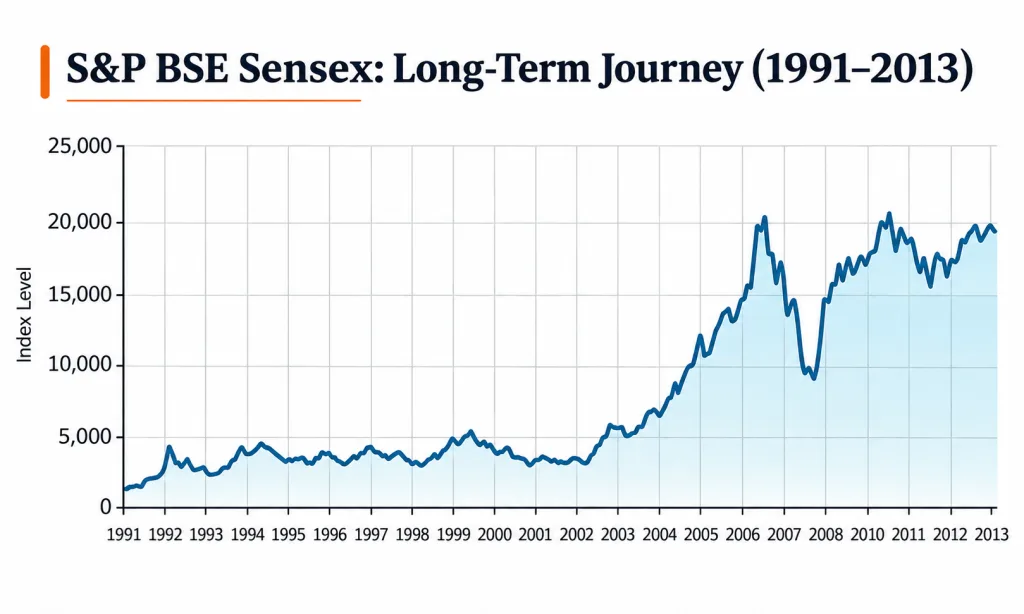
However, the story of these crashes did not end with the market decline. The Sensex gained approximately 174% in the five years following the 2008 crisis low, while it rose by around 200% in the five years following the March 2020 COVID-19 low. These recoveries highlight an important aspect of long-term investing: even after severe market downturns, equities can deliver substantial gains over time. But does that mean investors should simply wait out every crash? The answer requires a closer look at what happened during these two crises.
A stock market crash can test even the most patient investor. But looking back at these two major downturns reveals important lessons about panic selling, market recovery and the value of staying invested. In this blog, we’ll revisit both crashes, understand what triggered them and explore what long-term investors can learn from these share market crash episodes.
What Is a Stock Market Crash? Crash vs Correction
Imagine checking your investment portfolio one morning and finding that its value has dropped by 5% in a single day. A few difficult weeks later, the market is down much further. Is this a normal stock market correction, or is something bigger unfolding?
A stock market correction generally refers to a decline of 10% or more from a recent market peak. It is a relatively common part of market cycles and can happen when valuations become stretched, economic growth slows or investors turn cautious.
A stock market crash, on the other hand, involves a sharp and often sudden fall in share prices across the market. It is usually accompanied by widespread panic, heavy selling and uncertainty about the economy or financial system. Unlike a correction, a crash can erase a significant amount of market value within a short period.
| Basis | Market Correction | Stock Market Crash |
| Decline | Generally 10% or more | Usually a much sharper fall |
| Speed | Can develop over weeks or months | Often happens rapidly |
| Investor sentiment | Cautious or negative | Widespread fear and panic |
| Triggers | Valuation concerns, slowing growth | Financial crises, major economic shocks or unexpected events |
However, there is no universally accepted percentage that officially separates a crash from a correction. The speed, scale and circumstances of the decline also matter.
And here’s what makes stock market crashes particularly important for long-term investors: a sharp fall does not necessarily mean the market will keep falling. Some downturns recover relatively quickly, while others take years. The 2008 financial crisis and the 2020 pandemic crash offer two very different examples of how markets can fall, recover and test investor patience.
Stock Market Crash History in India: Four Major Events That Shook Investors
India’s stock market has experienced several major downturns over the years, each driven by a different event. From financial scams to global economic shocks, these episodes have tested investor confidence and highlighted the risks of market volatility.
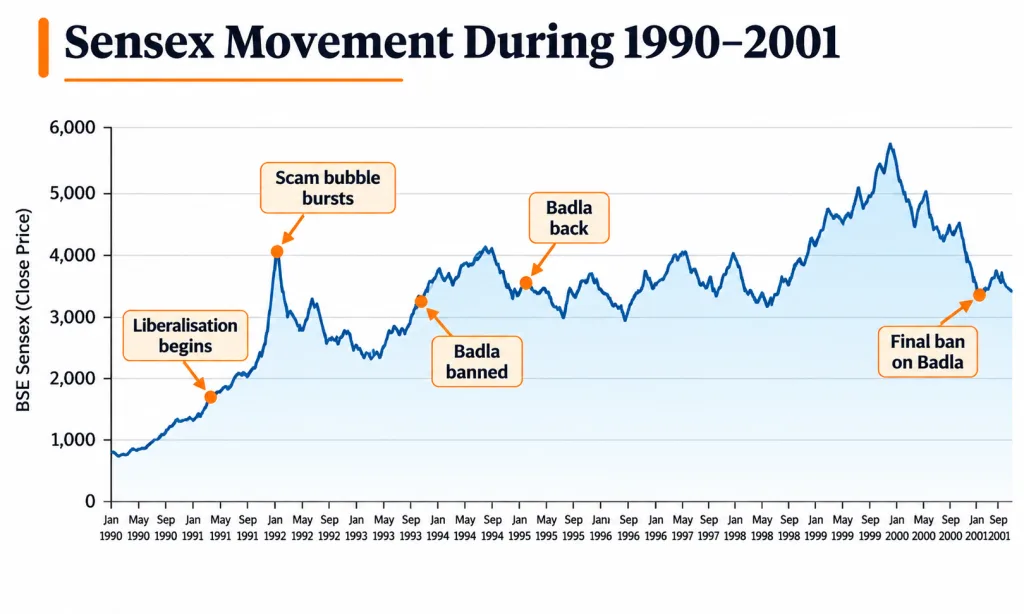
1992: The Harshad Mehta Securities Scam
In 1992, the Harshad Mehta securities scam exposed major irregularities in India’s banking and stock market systems. The revelation triggered a sharp market decline and raised serious concerns about transparency and regulatory oversight. It also became a turning point in the development of India’s securities market regulations.
2001: The Ketan Parekh Scam and Dot-Com Bubble Burst
The Indian market faced another setback in 2001 as the Ketan Parekh securities scam came to light, while the global dot-com bubble burst put further pressure on technology stocks. Several heavily traded shares witnessed sharp declines, highlighting the risks of speculation and inflated valuations.
2008: The Global Financial Crisis
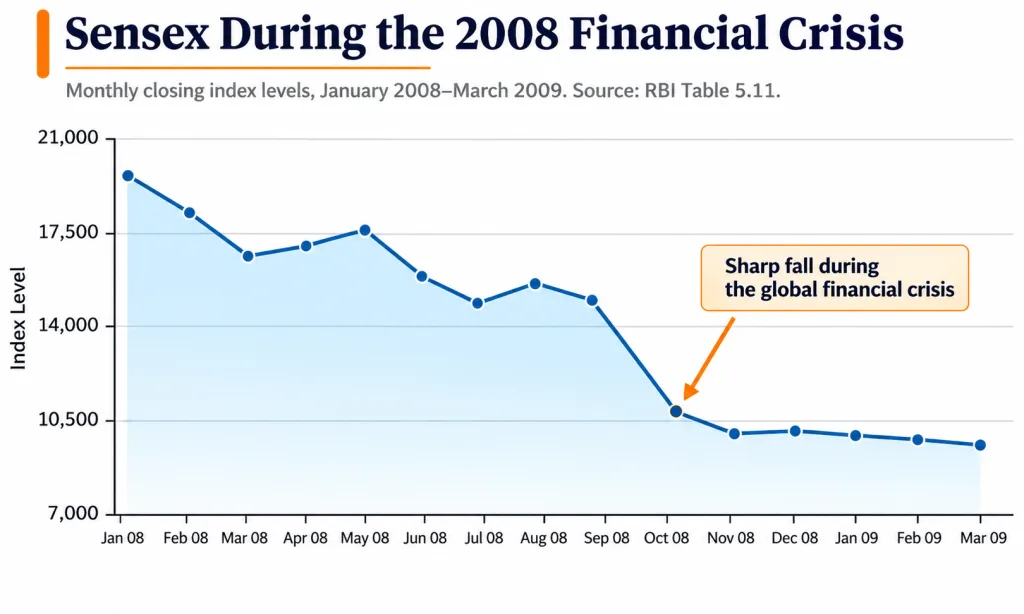
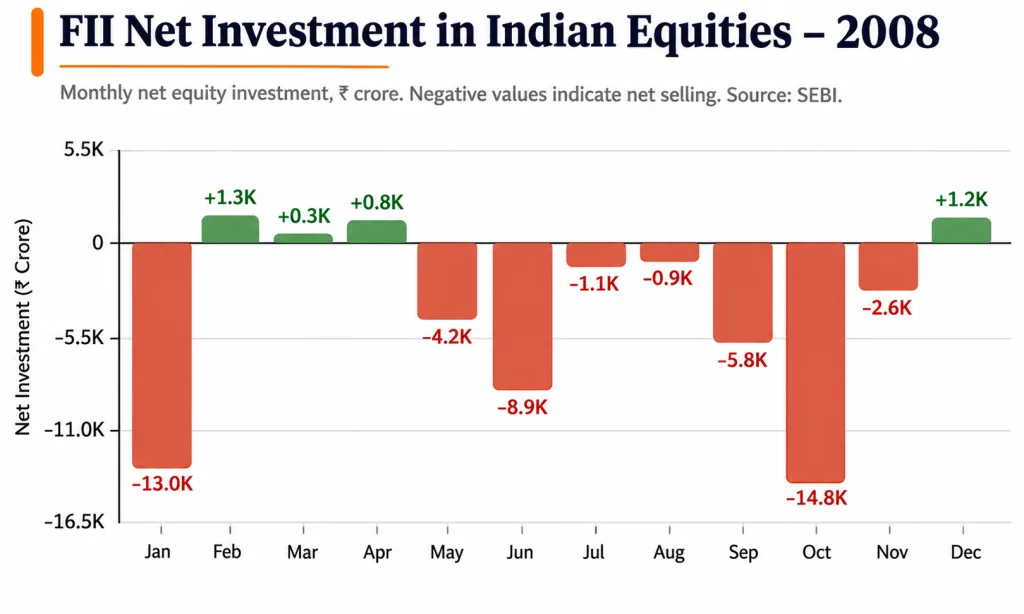
The global financial crisis triggered a massive sell-off in Indian equities. Following the collapse of Lehman Brothers in September 2008, foreign investors pulled money out of emerging markets, including India. The Sensex eventually fell nearly 64% from its January 2008 peak to its October low.
2020: The COVID-19 Stock Market Crash
The COVID-19 pandemic brought economic activity to a sudden halt as countries imposed lockdowns and businesses faced uncertainty. Panic selling pushed Indian markets sharply lower, with the Sensex falling nearly 40% from its January peak to its March 2020 low. However, the recovery that followed was much faster than many investors had anticipated.
These four episodes show that stock market crashes can emerge from very different situations. The 2008 and 2020 downturns, in particular, offer valuable lessons about how markets react to crises and how investors respond when uncertainty is at its peak.
Case 1: The 2008 Global Financial Crisis and the Indian Stock Market Crash
The 2008 financial crisis was one of the most severe downturns in modern market history. Although it originated in the US, its impact spread across global markets, including India. The Sensex fell nearly 64% from its January 2008 peak to its October low, making it a particularly difficult period for investors.
How the 2008 Crisis Hit India
The collapse of the US housing market and the bankruptcy of Lehman Brothers in September 2008 triggered panic across global financial markets. Foreign Institutional Investors (FIIs) began withdrawing money from emerging markets, including India, leading to heavy selling in equities. Concerns over global growth, corporate earnings and liquidity further weakened investor confidence.
Stock Market Recovery After 2008
Indian markets eventually began recovering from their March 2009 lows as global financial conditions stabilised and investor confidence gradually returned. However, regaining the previous peak took considerably longer. The Sensex took nearly three years to recover its January 2008 peak, showing that a sharp market decline can take time to reverse.

What Investors Did Right and Wrong
Long-term investors who stayed invested in fundamentally strong companies and avoided panic selling were better positioned to benefit from the eventual recovery. Those who sold in fear often locked in their losses. On the other hand, buying stocks simply because their prices had fallen, without checking their financial health and valuations, carried significant risks.
Case 2: The 2020 COVID-19 Stock Market Crash
Just when markets were beginning to stabilise after years of global uncertainty, the COVID-19 pandemic triggered another major sell-off in 2020. Unlike the 2008 crisis, which originated in the financial system, this crash was caused by an unexpected health emergency that brought economic activity to a standstill.
How Far Did the Market Fall and Why?
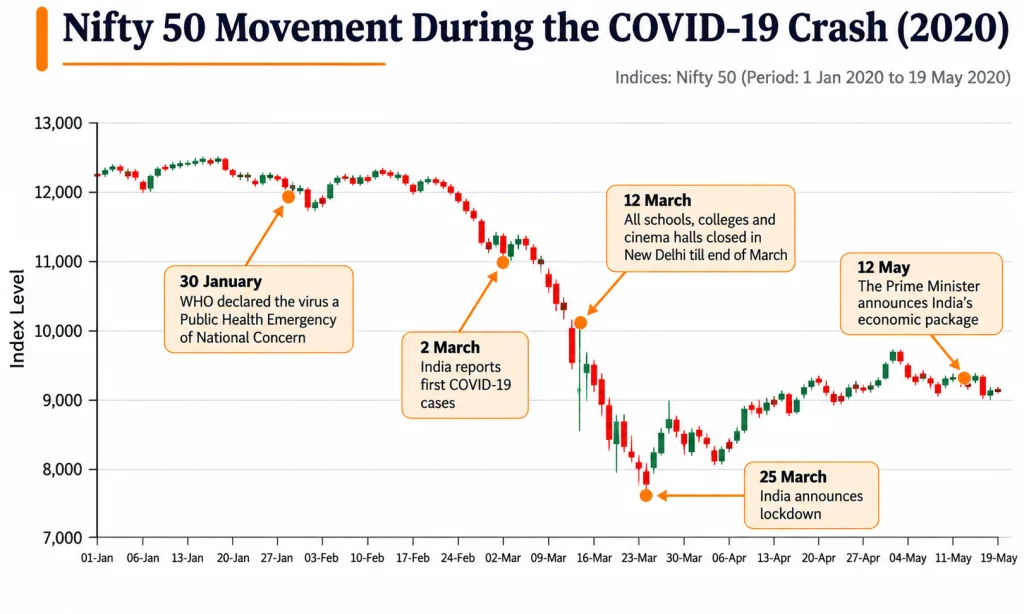
Between January and March 2020, the Sensex lost nearly 40% of its value as lockdowns, business closures and uncertainty over economic growth triggered widespread panic selling. The Nifty 50 also witnessed a sharp decline, with investors moving away from equities amid fears of falling corporate earnings and a prolonged economic slowdown. The market hit its lowest point on 23 March 2020, reflecting the severity of investor concerns.
How the Market Recovered
Despite the sharp decline, the stock market recovery was much faster than many investors expected. Government relief measures, RBI’s liquidity support, low interest rates and gradual reopening of the economy helped restore confidence. Strong retail participation and renewed interest in equities also supported the rebound. The Nifty 50 recovered its pre-crash levels in roughly eight months, highlighting how quickly market sentiment can change.
What Investors Did Right and Wrong
Long-term investors who continued their SIPs and stayed invested in fundamentally strong companies benefited from the subsequent recovery. Those who avoided panic selling were also better positioned to participate in the market rebound. However, rushing into stocks simply because prices had fallen, without assessing business fundamentals, remained a risky approach.
2008 vs 2020: How Were the Two Stock Market Crashes Different?
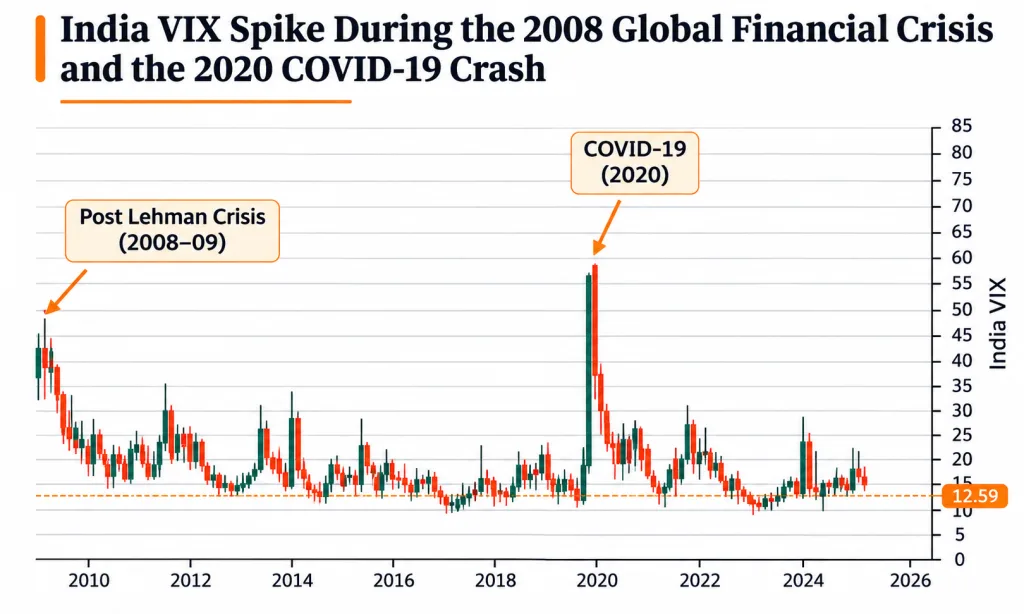
Both 2008 and 2020 witnessed sharp declines in Indian equities, but the reasons behind them and the pace of recovery were very different.
The 2008 stock market crash was driven by a financial crisis that spread from the US to global markets. Weakness in the banking system, the collapse of major financial institutions and heavy FII outflows kept investor sentiment under pressure. The Sensex fell nearly 64% from its January peak to its October low, and it took close to three years to regain its previous peak.
In contrast, the 2020 stock market crash was triggered by an unexpected global health emergency. Lockdowns and uncertainty over economic activity caused the Sensex to fall nearly 40% from its January peak to its March low. However, strong policy support, liquidity measures and improving investor confidence helped markets recover much faster, with the Nifty 50 regaining its pre-crash level in roughly eight months.
What Long-Term Investors Should Take Away
Stock market crashes are difficult to predict, but investors can prepare for them. The biggest lesson from past downturns is that a sound investment strategy should not depend on markets moving in one direction. Instead of reacting to every sharp fall, long-term investors should focus on managing risk, maintaining financial discipline and making decisions based on their investment goals.
A few habits can make a significant difference during uncertain market conditions.
Why Timing the Market Bottom Rarely Works
During a stock market crash, it is natural to wait for prices to fall further before investing. However, identifying the exact market bottom is extremely difficult, even for experienced investors. Markets can rebound suddenly, and waiting for the perfect entry point may mean missing a significant part of the recovery.
A more disciplined approach is to invest according to your financial goals, risk tolerance and investment horizon rather than trying to predict every market movement. The goal is not to catch the lowest point, but to avoid letting short-term market fear dictate long-term investment decisions.
Conclusion
The 2008 and 2020 stock market crashes remind us that uncertainty is an unavoidable part of investing. While no one can predict when the next downturn will occur, investors can control how they respond to it.
For long-term investors, the focus should remain on understanding the businesses they invest in, maintaining a diversified portfolio and avoiding decisions driven by panic selling. Market declines can be unsettling, but they also reinforce the importance of patience and financial discipline.
Ultimately, successful long-term investing is not about avoiding every stock market crash. It is about being prepared to navigate one without losing sight of your financial goals.
FAQs
1. What is the biggest stock market crash in India?
The 2008 global financial crisis was one of India’s biggest stock market crashes, with the Sensex falling sharply amid global financial turmoil.
2. How long does the market take to recover after a crash?
There is no fixed timeline. Stock market recovery can take months or even years, depending on the severity and cause of the crash.
3. What is the difference between a stock market crash and a correction?
A stock market correction generally involves a fall of 10% or more from a recent peak, while a crash is usually a sharper and more sudden decline accompanied by widespread panic.
4. Should I stop my SIP during a crash?
Not necessarily. Continuing SIPs can help accumulate more mutual fund units at lower prices, provided your investment goals and risk tolerance remain unchanged.