One of the most profitable moving average strategies that investors follow is the golden crossover strategy.
When an asset’s 50-day short-term moving average crosses over its 200-day long-term moving average, the market displays a golden cross, a momentum technical indicator.
A golden crossover indicates that a bullish reversal may take place.
Many investors view the Golden Cross as the Holy Grail of chart patterns. Want to know more about how this indicator works? Then keep reading below-
Table of Contents
Concept of Golden Crossover Strategy
When a very short-term moving average crosses above a long-term moving average, it forms a golden cross pattern on the chart.
When a security’s short-term moving average (like the 50-day moving average) crosses over its long-term moving average (like the 200-day moving average) or resistance level, a bullish breakout pattern known as a golden cross is created.
The golden cross suggests the probability of the emergence of a long-term bull market. The indication is often strengthened by high trading volumes.
How to Identify a Golden Cross on a Chart?
As a momentum indicator, the golden cross signifies that prices are steadily rising and accumulating momentum. Instead of being bearish, traders and investors now have bullish outlooks.
Typically, the indicator consists of three stages-
First Stage
There is a fall in the first phase, but it is almost over because there is more interest in buying than in selling.
Second Stage
In the second phase, there comes a fresh upsurge. The new uptrend’s breakout is identified when the short-term average forms the Golden Cross, crossing from below to above the long-term average.
Third Stage
At the conclusion of this phase, the bull market is confirmed by the new trend’s ongoing advances. If a corrective negative retracement happens during this phase, the Golden Cross two-moving average should serve as a level of support. As long as the 50-day moving average and the price are both below 200 days, a bull market is considered to be in place.
How to Use the Golden Crossover Strategy?
Here are some points for using the Golden Crossover Strategy-
- The golden cross can be a useful tool for traders looking to make informed decisions. Rather than depending just on volume and price swings, you can identify possible chances far faster if you monitor this pattern closely in your charts.
You can filter out stocks with Golden Crossovers with the help of StockEdge as shown below-

- Gold crosses can also be used in conjunction with other technical indicators. Use support and resistance levels or trend lines, for instance, to guide your trading decisions.
- Any macroeconomic influences that are at work—such as economic news—should be considered. It will let you decide whether to utilize all of the benefits that this design has to offer or not.
- A Golden Crossover is a useful indicator, but it’s not foolproof. It is advisable to employ supplementary technical indicators such as relative strength index (RSI) or volume in order to validate the upward trend and possible purchasing opportunity.
- Golden Crossovers may serve as false signals that cause prices to reverse or go into brief uptrends.
- Examine the moving averages’ slope following the crossing. A stronger possible uptrend is indicated by a steeper slope.
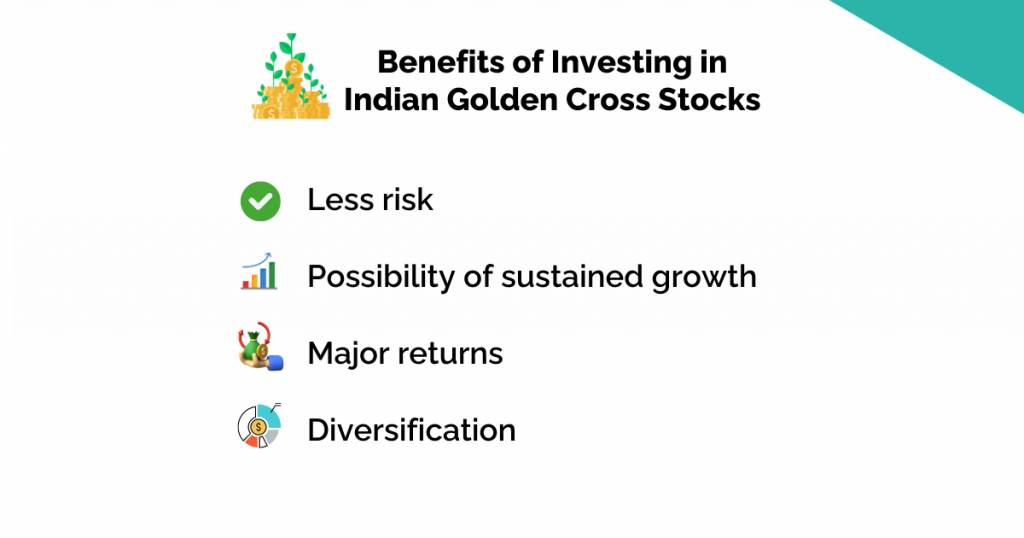
Benefits of Investing in Indian Golden Cross Stocks
Here are some Benefits of Investing in Indian Golden Cross Stocks

1. Less risk
A Golden Crossover implies that a market is shifting from being bearish to a bullish one. This could mean stocks in downtrends are less likely to experience sudden declines in their prices as compared to other such investments during the short-term (after all, past performance doesn’t predict future results).
2. Possibility of sustained growth
With this Golden Crossover comes the potential for ongoing long-term growth that is supported by both its short-term momentum and underlining company fundamentals change. This means there might be some kind of steady increase in value over longer periods.
3. Major returns
However, if the uptrend following the Golden Crossover is strong and sustained, it could lead to significant returns on your investment. Yet, remember that stock markets are inherently risky, and not every investment will give you good returns.
4. Diversification
The inclusion of these kinds of stocks into your portfolio can help diversify your holdings as well as potentially enhance its risk-adjusted returns. This has something to do with the fact that such stocks have chances of showing different behaviour in certain stages when compared to the market’s overall movement.
Conclusion
A popular technical analysis tool for figuring out when to enter and quit the stock market is the Golden Cross. Like all technical indicators, it could be more reliable, though. As a result, you need to combine it with other chart patterns and technical indicators.
Frequent Ask Questions (FAQ)
How to read a golden cross?
Shorter-term 50-day moving average crosses over longer-term 200-day moving average. This suggests that the longer-term trend may give way to the shorter-term momentum, potentially resulting in an upswing.
Is Golden Cross profitable?
Although the Golden Cross may point to an impending price increase, it is not a surefire way to make money.
How to find golden crossover stocks?
Many online trading platforms and charting tools offer features to identify Golden Cross patterns on charts such as StockEdge


Beautiful 🙂 literally that’s enough👍🏻