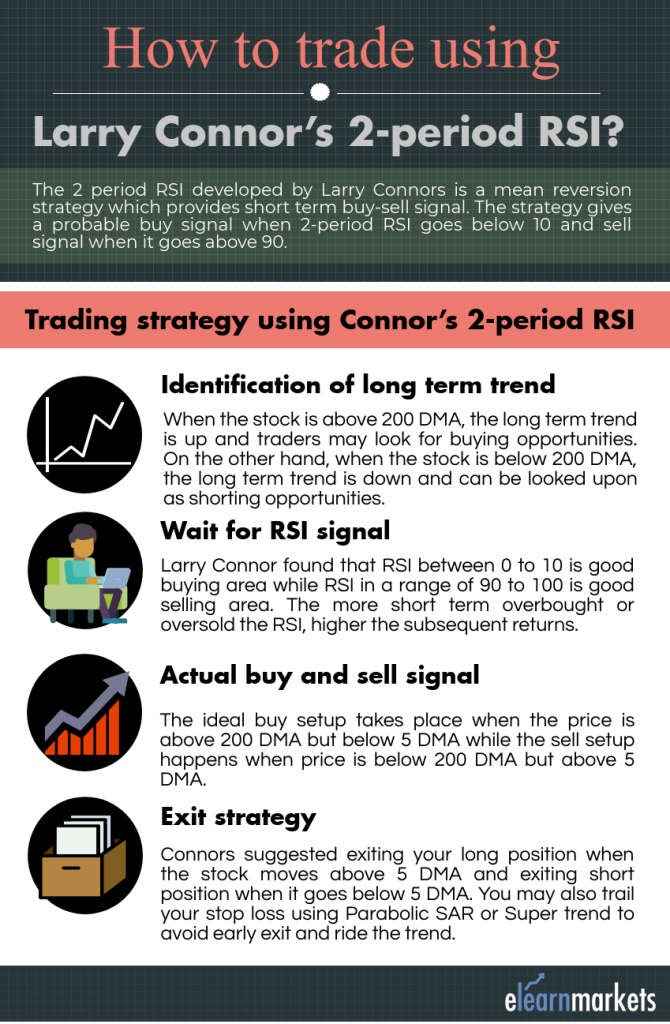
The 2 period RSI developed by Larry Connors is a mean reversion strategy which provides a short-term buy-sell signal.
The strategy gives a probable buy signal when 2-period RSI goes below 10 (lower the better) which is regarded as highly oversold. Similarly move above 90 generates sell signal (of course higher the better) which is seen as a highly overbought zone.
| Table of Contents |
|---|
| Identification of long-term trend |
| Wait for RSI signal |
| Actual buy and sell signal |
| Exit strategy |
| How to trade using Larry Connors RSI (2) strategy? |
| Conclusion |
The trading strategy using connor’s 2-period RSI basically comprises of four steps which are discussed below-
1. Identification of long-term trend
In order to identify the long-term trend, we can take the help of long-term moving average where Connor uses 200 DMA for this matter.
When the stock is above 200 DMA, the long-term trend is up and traders may look for buying opportunities.
On the other hand, when the stock is below 200 DMA, the long-term trend is down and can be looked upon as a shorting opportunity.
Also read: Mastering Inside bar trading strategy
2. Wait for RSI signal
You may use RSI to identify buying and selling opportunities within the broader trend.
Larry Connor found that RSI between 0 to 10 is good buying area but discovered that RSI going below 5 provides a better return than RSI going below 10.
Similarly, RSI in a range of 90 to 100 is a good selling area while RSI above 95 gives a better return than above 90.
In simple words, the more short-term overbought or oversold the RSI, the higher the subsequent returns.
3. Actual buy and sell signal
This is the most important step since actual buying or selling is done in this step.
Another important factor here is with regard to entry timing.
The ideal buy setup takes place when the price is above 200 DMA but below 5 DMA while the sell setup happens when the price is below 200 DMA but above 5 DMA.
Traders can either make position just before the close or can make position next day opening.
Both the logic has its own pros and cons since entry based on close approach can be with gap up or gap down which may either go in favor or against the trader and thus may maximize your potential gains.
On the other hand, making position next day opening provides flexibility but can lose in case of gap up trade and thus reduces risk.
Depending upon your risk profile, you may make your position. The traders who are unable to devote much time in analyzing charts of various securities may benefit from scan section in the StockEdge mobile app.
4. Exit strategy
This point is with regards to the exit strategy where Connors suggested exiting your long position when the stock moves above 5 DMA and exiting short position when it goes below 5 DMA.
Here you will not enjoy long trending moves but it is a short-term trading strategy which will result in quick exits.
You may also trail your stop loss using Parabolic SAR or Supertrend so that instead of making an early exit, you may ride the trend trailing your stop loss.
Know More: How to generate powerful trading signals using Parabolic SAR and RSI?
How to trade using Larry Connors 2 Period RSI strategy?
Based on the above 4 conditions, we will take a practical example to discuss the above trading strategy. Below is the daily chart of Havells India.
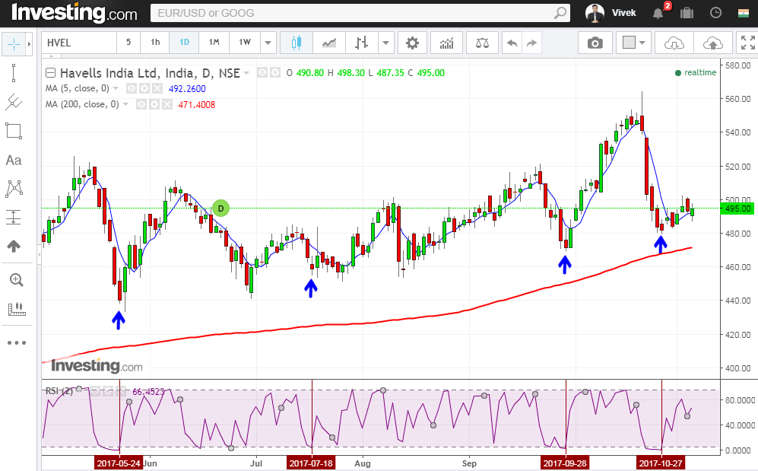
In all the above buying situations, the price candle was above 200 DMA but below 5 DMA.
In order to execute the actual trade, you may either make your position, when the RSI is below 5 or the next day open when the RSI crosses 5 from below.
Read More: 5 important roles of Relative Strength Index (RSI)
One important thing to note here is that you will execute your trade only when all the above conditions are met.
For exit, you may trail your stop-loss or above the close of 5 DMA.
In the same way, now we will look at the stock on the sell-side.
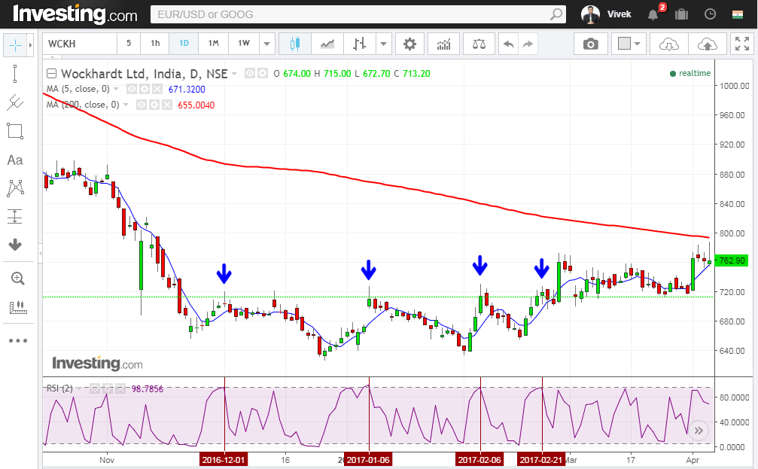
In all the above selling situations, the price candle was below 200 DMA but above 5 DMA.
In order to execute the actual trade, you may either make your position, when the RSI is above 95 or the next day open when the RSI crosses 95 from above.
For exit, you may trail your stop loss or below the close of 5 DMA.
Conclusion
This 2 period RSI strategy is designed not to look for tops or bottom but to participate in an ongoing uptrend.
But one problem within this 2 period RSI strategy is that Connor doesn’t believe in putting stops and he discovered that 2 period RSI may hurt your overall performance and thus he left on to traders to decide themselves based on their risk profile.
You may use 2 period RSI in conjunction with other indicators or strategies so that you can filter out the strategy as per your trading style.






I’m subscribed member of Stock Edge . How to create this scan using stock edge ? because it does not have scan for 5 DMA and RSI above 90 or below 10.
Please guide.
Hi,
You can just use the ready Technical scans in StockEdge!
Thank you for Reading!
Please guide as to how to create this scan using the ready technical scans ? as I’m not able to to do it.
Hi,
There is no option in creating of creating new scans in StockEdge.
Thank you for Reading!
Hi,
I know I can’t create new scan. What I’m asking is how to create my own combo scan using your crafted scans for the above ? Hope I’m clear this time.
Hi,
Please refer to our blog on How to make a combination scan
hi mam,
In the trading view, we have a separate indicators of C RSI but it is showing a completely different buy/sell-side compared to RSI(2). Please suggest.
Hi,
Yes as it is 2 period RSI it will show different signals.
Thank you for Reading!