Elearnmarkets - Financial Market Learning
  • Courses
  • Webinars
  • Stories
  • Language
    • English
    • Hindi
    • Bengali
No Result
View All Result
Get Free Course
  • Basic Finance
  • Derivatives
    • Futures
    • Options
  • Financial Planning
  • Fundamental Analysis
  • Technical Analysis
  • Mutual Funds
  • Marketshala
  • Miscellaneous
Elearnmarkets - Learn Stock Market, trading, investing for Free
  • Courses
  • Webinars
  • Stories
  • Language
    • English
    • Hindi
    • Bengali
No Result
View All Result
Get Free Course
Elearnmarkets - Learn Stock Market, trading, investing for Free
No Result
View All Result
Home Technical Analysis
Triple Screen Trading System

Triple screen trading system: the Alexander Elder way of trading

Elearnmarkets by Elearnmarkets
October 18, 2024
in Technical Analysis
Reading Time: 7 mins read
7
10.4k
VIEWS
Share on FacebookShare on XShare on WhatsApp

This triple screen trading system was developed by Dr Alexander Elder.

This is a mechanism which goes through the practical examination of a stock in three different stages.

In order to qualify for trading, a stock must pass through all three different stages with positive marking.

Table of Contents
Step 1
Step 2
Step 3
Bottomline

Step 1

It is found that if a stock does not qualify for any of the stage; it does not qualify for the next step.

We must keep in our mind that all the three stages must positively allow the stocks to get ahead.

No compromise in the process of selection is accepted. The triple screen trading system requires the first two stages of the study on a weekend. It means that one can start examining this process only after the weekly closing is over.

Hence, it is of no use to study this process in between the week.

Once the weekly closing is over, we should open the weekly chart and plot at least three trends following indicators. They are as follows:

1. MACD

2. Directional system

3. 13 and 30 Moving average

In order to make a positive marking, all the three indicators have to give confirmation. The ideal situation would be as follows-

a. Both the lines in MACD i.e. solid line and the trigger line should be above zero and both rising.

b. In the directional system, +DI is rising on the upside and –DI is falling on the downside and ADX is in between the two and rising.

c. 13 and 30 weeks moving average line should be such that 13 weeks > 30 weeks and both are rising.

Also Read: RSI failure swing strategy

If all of the above three are showing the positive sign, then we can reasonably say that the trend is up. The trend identification process has to be on a weekend basis.

The examination report will allow us to take a positive decision.

If during the course of the examination, if any of the indicators is not dancing on the same tune, then the entire process stands disqualified.

That is the reason that all three indicators must behave in the same manner and when all the three gives a positive signal, then we will move to the second step.

Example

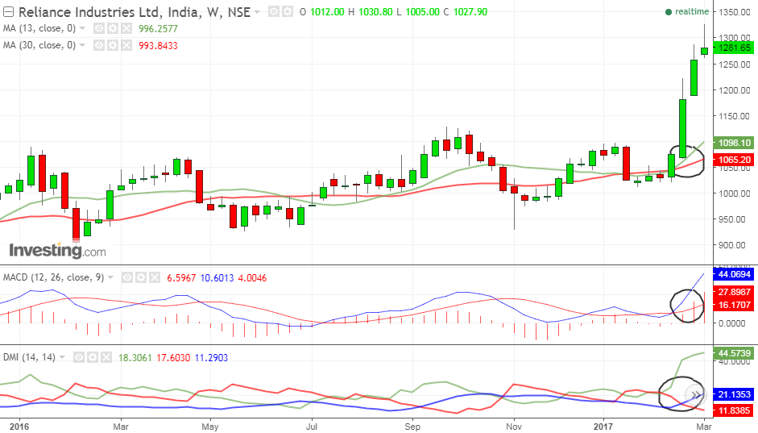
Let’s take an example to understand the first step. The below is the chart of Reliance Industries and we can clearly see that the all the three i.e. 13,30  moving average, MACD and the Directional system gives a positive buy signal in the weekly chart above 1250 levels (approx).

reliance step one

Step 2

The second step deals with the identification of the status of momentum.

In order to do such, we will open the daily chart, plot and take the help of stochastic only. We should not forget that stochastic catches the short term momentum.

Also Read: Slow Stochastic Explained

Let us now try to understand that the trend has been identified in the weekly chart with the indicators which are laggard in nature.

Hence it may happen that although the weekly chart shows an uptrend it has started momentum sometime back.

Hence it may happen that in the process the stock has reached already a short-term overbought situation.

So even if the weekly chart allows a positive trend, the stochastic in daily chart might say the other way round.

Here, we are actually making a combination of a trend that is in the direction and the momentum.

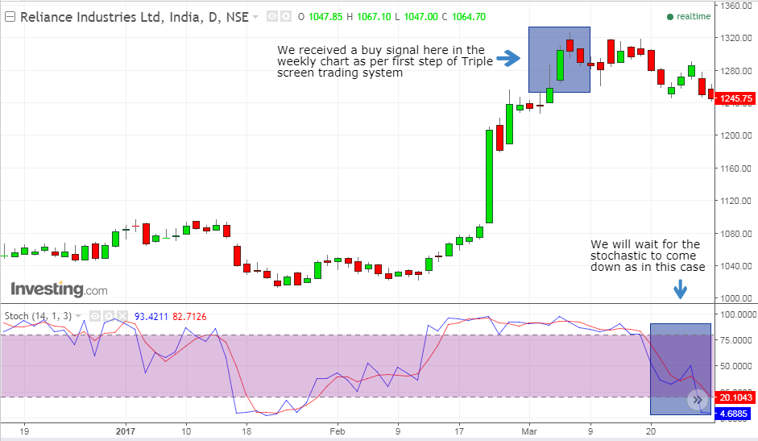
As we can see in the chart below that when we received the buy signal in the weekly chart, the stochastic was in the overbought zone.

So we will wait for the short-term correction to fulfil the criteria of the second step. Accordingly, the stock gave a correction and the stochastic travelled all the way to oversold zone.

reliance step two

Step 3

Once we have crossed the first two steps of triple screen trading system, the question of third step or the final step where the action is required to be taken.

If the first scenario gives us a proper signal of the uptrend and stochastic has remained in the falling or oversold condition, it means that the price has been falling and of course making a lower top and lower bottom.

To take an entry for buy, we should allow the price to close above the top of the previous high and of course, low has to be higher in comparison to the previous day.

Thus it will create a higher top and higher bottom which also confirms that the downtrend or the correction is over and the price has started creating the higher top and higher bottom.

If this happens, stochastic will also turn for a buy signal. Needless to say that we will hold the position trailing our stop to previous day’s low and will finally liquidate when the stochastic is overbought.

In case of the downtrend in the weekly chart, we will wait for a selling decision when the stochastic is up. Since stochastic is up, it means price was rallying in the nature of relief rally.

Once price breaks, the last day’s bottom and makes a lower top, the sell signal is triggered.

We will keep our position sold and trail our stock gradually to the downside where yesterday’s high would be trailing stop. We can book the profit when stochastic is finally oversold.

Here, we will make our position when the stochastic rises above the oversold zone.

reliance step three

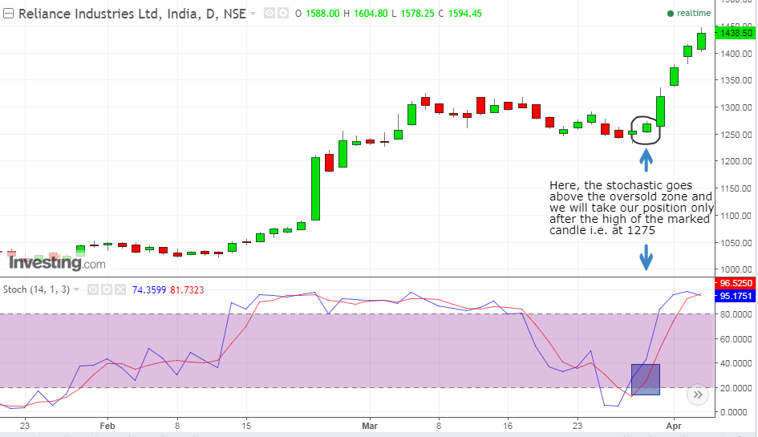
We will enter only above the high of the marked candle in the chart.

After the buy signal was generated, the stock gave a good 150-160 point rally and it’s very important to keep trailing our stop loss in the process.

Bottomline

The same concept can be applied in combination of weekly chart and monthly chart where the trend has to be decided in the monthly chart and stochastic to be applied in the weekly chart and we will allow other rules as applicable.

Tags: candlestick patternenglishmacdmoving averagestochastictechnical analysis
ShareTweetSend
Get Kotak Offer Get Kotak Offer Get Kotak Offer
Previous Post

ROC Indicator – How to trade with Rate of change Indicator ?

Next Post

How Heikin Ashi charts help to filter the trade?

Elearnmarkets

Elearnmarkets

Elearnmarkets (ELM) is a complete financial market portal where the market experts have taken the onus to spread financial education. ELM constantly experiments with new education methodologies and technologies to make financial education effective, affordable and accessible to all. You can connect with us on Twitter @elearnmarkets.

Related Posts

Understand Slippage in Trading
Technical Analysis

What is Slippage in Trading? Meaning & Examples

March 28, 2025
307
Breakout trading strategies
Technical Analysis

Top 5 Breakout Trading Strategies

March 12, 2025
1.1k
5 stocks for today
Technical Analysis

5 Stocks to Buy Today That Could Beat the NIFTY in 2025!

May 5, 2025
405
Image describing What is marginal trading facility
Technical Analysis

 What is a Margin Trading Facility? Advantages & Risks

April 4, 2025
666

Comments 7

  1. Mr Sam says:
    7 years ago

    Wow! Very interesting. It beggers the mind to know the efforts someone has put in to make trading more productive…can’t wait to try this out!

    Reply
    • Sakshi Agarwal says:
      7 years ago

      Hi Sam,

      Welcome!!

      Keep Reading!

      Reply
      • Mr Sam says:
        6 years ago

        I back tested the strategy and worked like magic. Therafter, added a little tweaked to it and applied it on the hourly time frame and it’s still killing the market. Thanks, I do appreciate you’ve done more than enough by sharing this strategy

        Reply
        • Sakshi Agarwal says:
          6 years ago

          Hi Sam!

          Thank You !

          Keep Reading!

          Reply
  2. Aakaash says:
    5 years ago

    Very nice explanation. Thank you.

    Reply
    • Sakshi Agarwal says:
      5 years ago

      Hi,

      Thank you for Reading!

      Keep Reading!

      Reply
  3. Sharda Sutterfield says:
    5 years ago

    Thanks a lot. This is great content. I might share some for you guys too. Great work poster!

    Reply

Leave a Reply Cancel reply

Your email address will not be published. Required fields are marked *

Disclaimer

Elearnmarkets (Kredent InfoEdge Pvt. Ltd.) is a SEBI-registered Research Analyst (RA) entity (SEBI Registration No.: INH300007493). The information provided in this article is for educational and informational purposes only and should not be considered as an offer to buy or sell any securities or investment products.

The stocks, securities, and investment instruments mentioned herein are not recommendations under SEBI (Research Analysts) Regulations, 2014. Readers are advised to conduct their own due diligence and seek independent financial advice before making any investment decisions.

Investments in securities markets are subject to market risks. Please read all related documents carefully before investing. Investing in Equity Shares,
Derivatives, Mutual Funds, or other instruments carry inherent risks, including potential loss of capital. Elearnmarkets (Kredent InfoEdge Pvt. Ltd.) does not provide any guarantee or assurance of returns on any investments. Past performance is not indicative of future performance.

Elearnmarkets Logo

Follow Us

Facebook-f X-twitter Instagram Linkedin-in Youtube Telegram

Register on Elearnmarkets

Continue your financial learning by creating your own account on Elearnmarkets.com

Register Free Account

Download App

Playstore logo
Download on app store

Categories

  • Basic Finance
  • Derivatives
  • Financial Planning
  • Fundamental Analysis
  • Technical Analysis
  • Mutual Funds
  • Miscellaneous

Popular On Elearnmarkets

  • Market Superheroes:
  • Vivek Bajaj
  • Chetan Panchamia
  • Ashish Kyal
  • Premal Parekh
  • Abhijit Paul
  • Jegan
  • Sivakumar Jayachadran
  • Jyoti Budhia
  • Vivek Gadodia
  • Vishal Mehta
  • Piyush Chaudhry
  • Santosh Pasi
  • Gomathi Shankar
  • Market Superheroes:
  • Vivek Bajaj
  • Chetan Panchamia
  • Ashish Kyal
  • Premal Parekh
  • Abhijit Paul
  • Jegan
  • Sivakumar Jayachadran
  • Jyoti Budhia
  • Vivek Gadodia
  • Vishal Mehta
  • Piyush Chaudhry
  • Santosh Pasi
  • Gomathi Shankar
  • Courses:​
  • Options Trading
  • Dow Theory
  • Momentum Trading
  • Stock Investing
  • Harmonic Chart Patterns
  • Algo Trading
  • Elliot Wave Theory
  • Advanced Excel
  • Cryptocurrency
  • NSE Certification Course
  • Courses:​
  • Options Trading
  • Dow Theory
  • Momentum Trading
  • Stock Investing
  • Harmonic Chart Patterns
  • Algo Trading
  • Elliot Wave Theory
  • Advanced Excel
  • Cryptocurrency
  • NSE Certification Course
  • Webinars:
  • Bank Nifty Scalping
  • Intraday Trading Strategies
  • Options Trading Strategies
  • Options selling
  • Price Action
  • Relative Strength
  • Tax Planning
  • Options Buying
  • Growth Stocks
  • Portfolio Management
  • Risk Management
  • Renko Charts
  • Crude Oil
  • Traders Psychology
  • Moving Average
  • Multibagger Stocks
  • Free Learning Modules:
  • Intraday Trading
  • Options Scalping
  • Swing Trading
  • Financial Modelling
  • RSI Indicator
  • Bollinger Bands
  • Pricing of Futures
  • Personal Finance
  • Initial Public Offerings (IPO)
  • Value Investing
  • Technical Indicators
  • Candlesticks
  • Chart Patterns
  • Option Greeks
  • ELSS Funds
  • Banking and Insurance
  • Real Estate
  • Gold
  • Book Summaries:
  • Rich Dad Poor Dad
  • Psychology of Money
  • The Intelligent Investor
  • The Richest Man in Babylon
  • Think and Trade Like a Champion
  • Value Investing and Behavioural Finance
  • Trading in the Zone
  • Learn to Earn
  • Book Summaries:
  • Rich Dad Poor Dad
  • Psychology of Money
  • The Intelligent Investor
  • The Richest Man in Babylon
  • Think and Trade Like a Champion
  • Value Investing and Behavioural Finance
  • Trading in the Zone
  • Learn to Earn
  • Tools:
  • CAGR Calculator
  • SIP Calculator
  • eLearnOptions
  • Future Value Calculator
  • Present Value Calculator
  • Atal Pension Yojana
  • Cost of Delay Calculator
  • Become a Crorepati
  • Tools:
  • CAGR Calculator
  • SIP Calculator
  • eLearnOptions
  • Future Value Calculator
  • Present Value Calculator
  • Atal Pension Yojana
  • Cost of Delay Calculator
  • Become a Crorepati

© 2025 Elearnmarkets. All Rights Reserved

  • Visit Elearnmarkets
  • Courses
  • Webinars
  • Financial Guides
  • Get Free Counselling
  • Visit Elearnmarkets
  • Courses
  • Webinars
  • Financial Guides
  • Get Free Counselling

Download Our App

No Result
View All Result
  • Article Categories
    • Basic Finance
    • Derivatives
    • Financial Planning
    • Fundamental Analysis
    • Technical Analysis
    • ETFs & Mutual Funds
    • Marketshala
    • Miscellaneous
  • Language
    • Hindi
    • Bengali
    • English
  • Courses
  • Webinars
  • Stories
Get Free Course

© 2024 Elearnmarkets All Rights Reserved

A Handbook of Technical Analysis
To start your trading journey as a seasoned technical analyst
Download Guide For FREE
Trading Mentorship Program