
“Trend is your friend” You must have heard this quote by Martin Zweig if you trade in the stock market? Momentum trading is all about trading with the trend.
For example, if a stock surges after reporting strong earnings, a momentum trader could acquire shares and ride the stock’s price upward.
Also, if a stock’s price begins to increase due to a suspected short squeeze, momentum traders may buy shares in the hopes that the short squeeze will continue to push the price higher.
Momentum investing is a strategy that aims to buy stocks showing an upward price trend or short-selling securities that have been showing a downtrend.
So, in today’s blog, we will discuss momentum investing, the indicators used in momentum trading, and some strategies.
What is Momentum Investing?
The technique of purchasing and selling assets based on the strength of recent market trends is known as momentum investing.
It is predicated on the concept that if a price move has enough momentum behind it, it will continue in the same direction.
When an asset reaches a higher price, traders and investors are more likely to pay attention to it, pushing the market price even higher.
This continues until a large number of sellers enter the market, such as when an unexpected incident prompts them to reconsider the asset’s price, when there are enough sellers in the market, the momentum shifts and the price of an asset falls.
The main goal of fundamental-driven, long-term investing is to “buy low, sell high.” Whereas the purpose of momentum trading is to “buy high and sell even higher.”
But how do we identify if there is momentum in the stock or not? There are many momentum indicators that help us to analyse stocks having the momentum to solve this issue.
Types of Momentum Indicators
Below are the most popular types of momentum indicators:
1. Trendlines
A basic technical analysis tool for monitoring price fluctuations is trend lines. A trend line is drawn between two consecutive points on a price chart.
If the resulting line slopes upward, it suggests a favourable, bullish trend, and investors might consider buying shares.
If the resulting line is downward sloping, the trend is negative or bearish, then selling short is the most likely lucrative strategy.
2. Moving Averages
Traders can use a moving average line to detect the current trend while removing most of the “noise” in the market that arises from small, unimportant price swings.
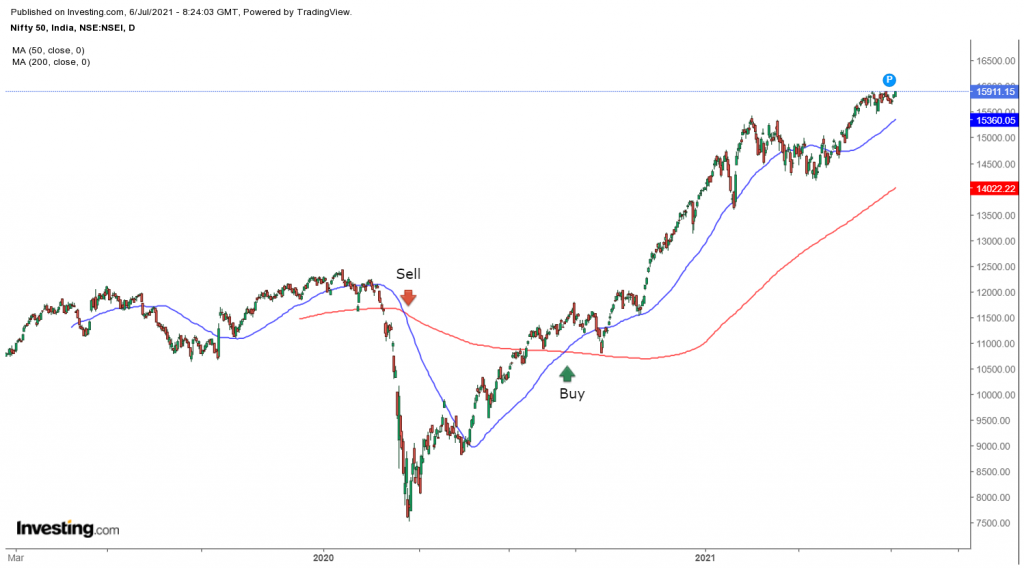
When the price of security continuously remains at or above a moving average, it indicates an uptrend.
Price sustaining a position at or below a specified moving average usually indicates a downtrend on a chart.
3. The Average Directional Index
The Average Directional Index (ADX) is a prominent momentum indicator that is thought to be less likely than the stochastic oscillator to produce false signals.
The ADX is used to identify (A) whether a trend exists and (B) how strong it is. It achieves so by calculating securities’ price range expansion (or contraction) over a given period.

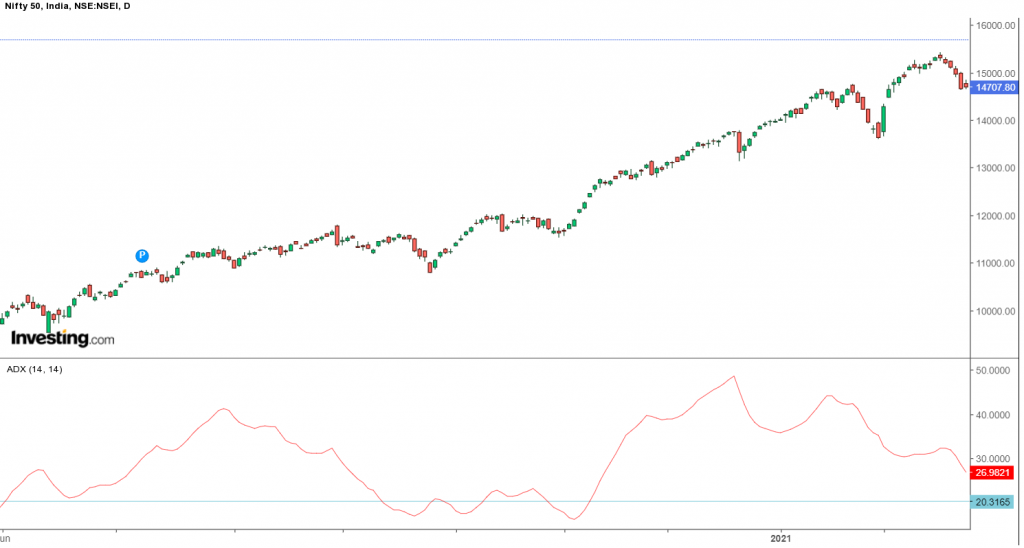
The ADX scale runs from 0 to 100. Values less than 25 (some traders use 20 instead of 25) suggest a range or directionless market with no discernible trend.
A result of more than 25 shows the presence of a trend, with higher readings indicating a stronger trend. In other words, a reading of 40 on the ADX implies a stronger signal.
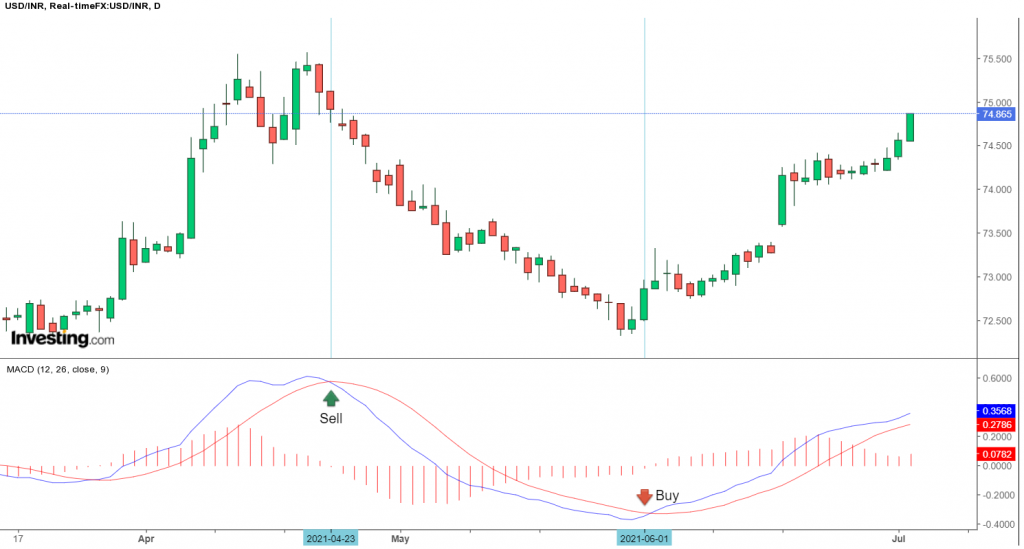
4. Moving Average Convergence Divergence (MACD):
MACD is a momentum indicator that shows the relationship between the two moving averages, i.e., 26 EMA and 12 EMA.
It consists of the MACD line and the signal line. The MACD line is the difference between the 26 EMA and 12 EMA, and the signal line is 9 EMA.
The buying signal is generated by MACD when the MACD line crosses the signal line from below, and the selling signal is generated when the MACD line crosses the signal line from above, as shown below:
MACD also generates buy and sell signals by bullish and bearish divergences.
5. Stochastics
The stochastic oscillator compares an asset’s most recent closing price to the prices over a given period.
The trend is favorable when the closing price is towards the high price range for the time period. Conversely, a declining trend is shown when the closing price is near the low.
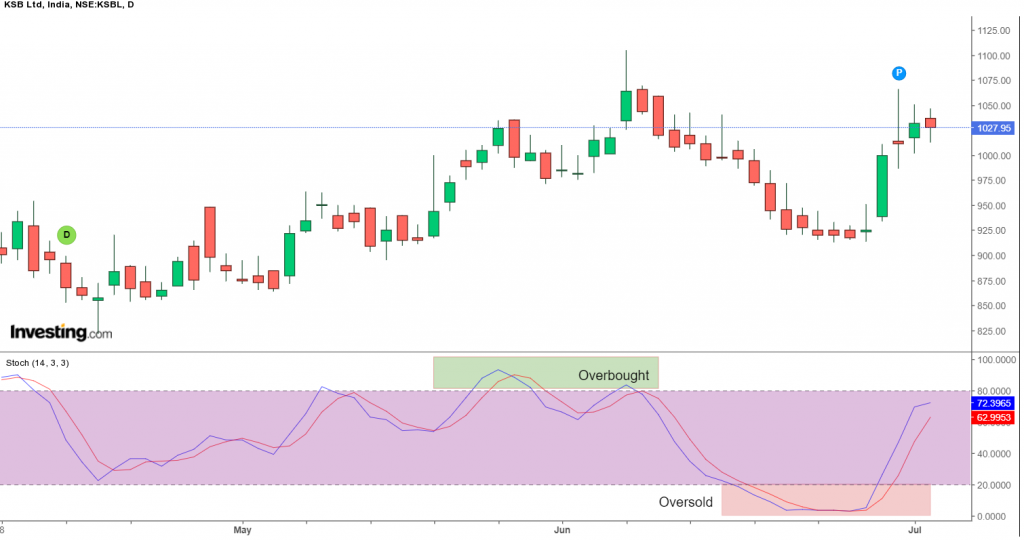
The values of stochastic oscillators range from 0 to 100. A stronger rise is indicated by values above 50. Lower values, below 50, indicate an accelerating downward trend.
A reading below 20 on the oscillator, on the other hand, signals oversold circumstances in the market, which could lead to a market reversal to the upside. Overbought conditions and the potential for a bearish reversal are also indicated by readings above 80.
How does Momentum Investing work?
Traders who use a momentum investing strategy try to benefit by purchasing or selling short securities when the market is strongly trending, such as when the price action momentum is high.
Price increasing or dropping across a wide range in a short period indicates high momentum. Conversely, markets with a lot of momentum usually have a lot of volatility.
Momentum investing is often short-term, as traders are only interested in capturing a portion of a trend’s price movement.
The following is how a momentum investing trade works:
To determine the existence of a trend, a trader uses technical indicators like trend lines, moving averages, and particular momentum indicators such as the ADX.
The trader takes a market position in the trend direction as it develops momentum (strengthens) (buying an uptrend; selling a downtrend).
When the trend’s momentum begins, such as a divergence between price action and the movement of momentum indicators like the MACD or RSI, the trader attempts to exit their position (preferably at a profit) before the trend reverses.
Having understood about indicators, now let us discuss some momentum strategies using StockEdge:
Momentum Trading Strategies using StockEdge
There are ready-made strategies available in StockEdge that help us filter in stocks both bullish and bearish, as shown below:
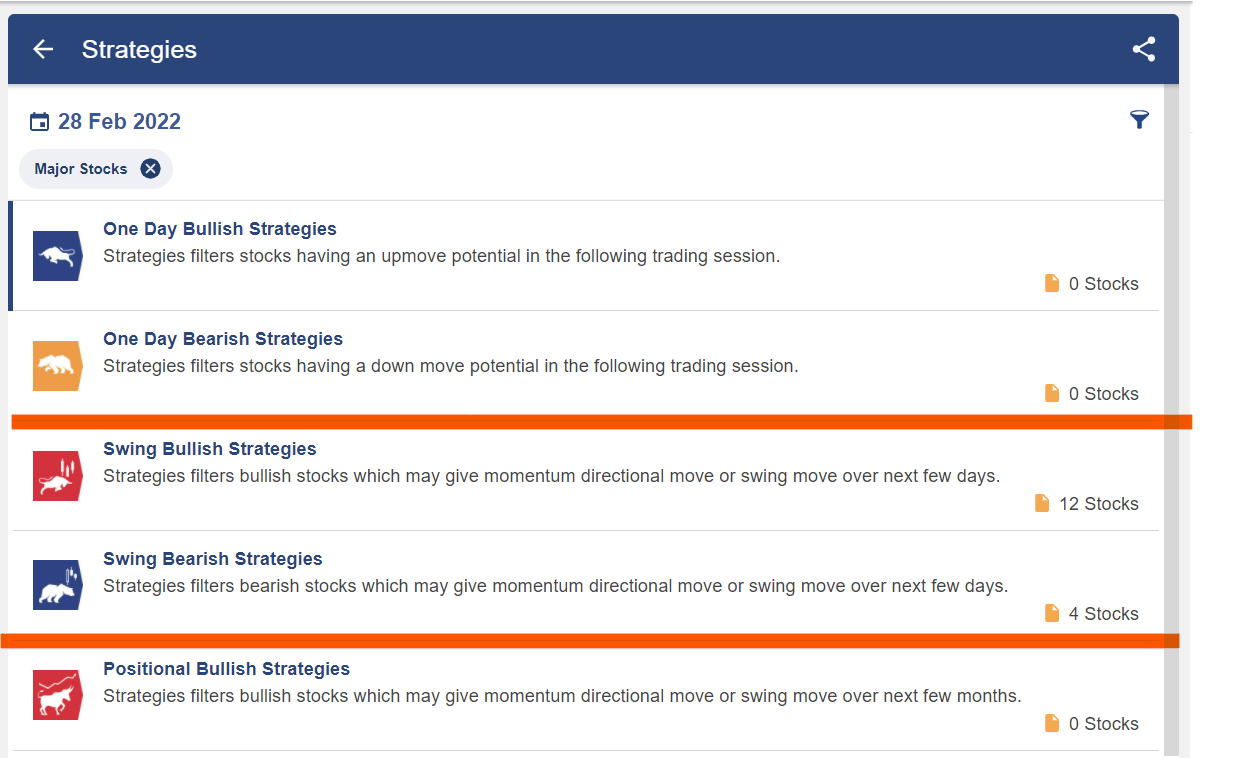
Traders can select either momentum, continuation, or reversal strategies according to their trading style, as shown below:
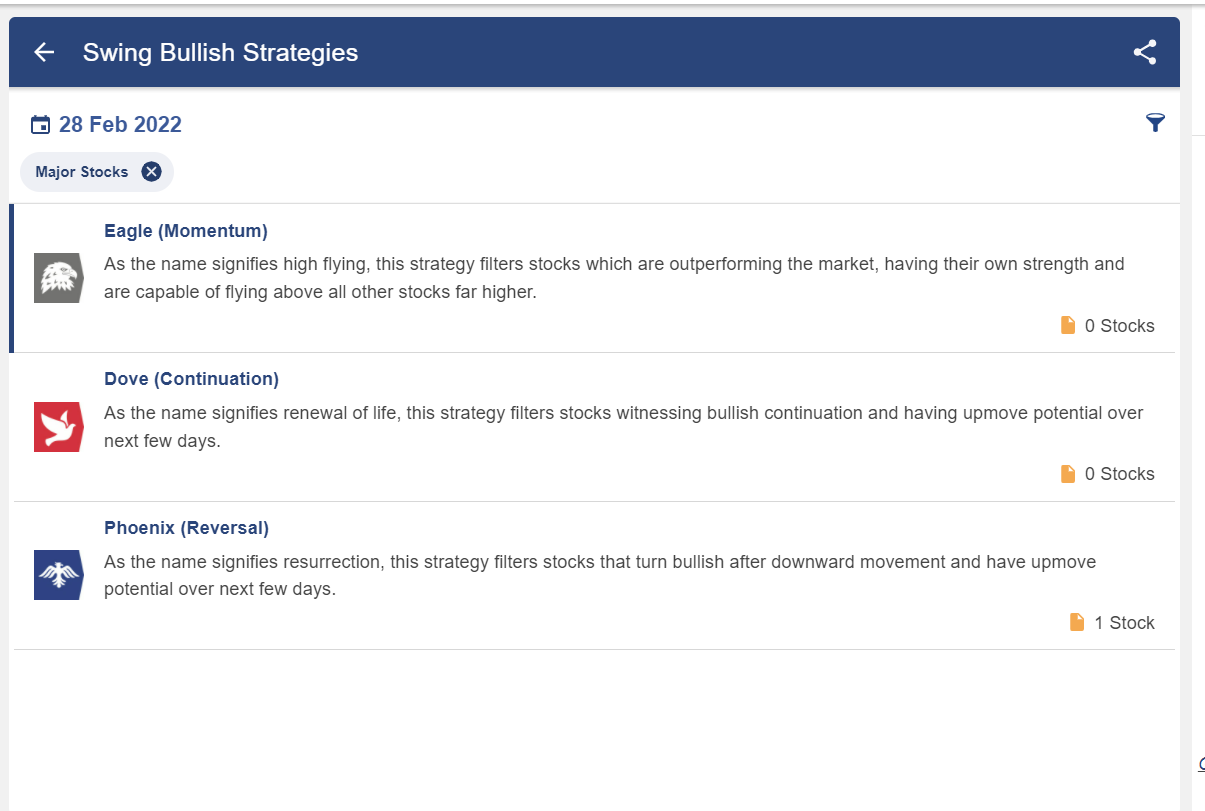
After selecting, traders will get a list of stocks fulfilling that criteria.
Like other investing strategies, momentum investing also have drawbacks. Let us discuss that.
You can also do our course on Masterclass on Short-term Momentum Trading
Drawbacks of Momentum Investing
Momentum trading is based on the assumption that a trend will continue. However, there are no assurances at all.
Trend reversals occur frequently, and momentum does not continue indefinitely. Buying stock on the rise and selling it at (or just before) its top would be an excellent momentum move. That is far easier said than done, as anyone who has tried it can attest.
If you want to learn more about momentum investing, you can take our following webinars:
Webinars on Momentum Investing
1. Momentum trading and Playing Breakouts
Active investors use momentum & Breakout trading to take a position within a trending move.
This webinar will focus on how to take advantage of the momentum and play breakout trade with proper risk management.
We will discuss the signals and patterns to look for and what signals to look for. We will be covering both positional and intraday aspects of momentum trading.
2 Momentum Trading Strategy
The webinar will look at building momentum trading strategies for indices/stocks. In addition, it will cover technical indicators and apply them for directional buy/sell signals.
There are opportunities for playing the markets in both directions in volatile markets. Even in recent phases where markets crashed, there were many opportunities in such kinds of markets that may be captured through systematic trading.
3. How to Gauge Momentum for Option Buying(Bank Nifty)?
In this session, we will learn to identify momentum, understand candle formation, and contribute to the overall market structure.
We will also learn how to be a profitable day trader using a battle-tested setup with good risk management and how to identify the market structure and modify your trading style as per the situation.
4. Systematic Trading using Relative Strength/Momentum
In this webinar, you will learn How to identify the strongest stocks, create a basket of stocks and allocate capital, rebalance stocks and Managing Risk
You can also watch our video on Momentum Trading by Mr Vivek Bajaj:
Bottomline
As we have discussed, the main goal of momentum trading is all about buying higher and selling higher. It is one of the most used strategies among investors. We hope you found this blog informative and use it to its maximum potential in the practical world.
You can enhance your knowledge and join our stock market crash course.
Also, show some love by sharing this blog with your family and friends and helping us in our mission of spreading financial literacy!
Happy Investing!


