Key Takeaways
- Opening range defines early market direction: The high and low during the first 30–60 minutes help traders identify key price levels and potential breakouts for the day.
- Measuring the range is crucial: Use the previous day’s last candle and the first candle of the new session to calculate the opening range size before taking any trade.
- Breakouts signal strong momentum: When price breaks above or below the opening range, it often continues in that direction, making it a prime entry point for traders.
- ORB strategies suit different setups: Methods like early morning breakout, gap pullback buy, and gap reversal help traders act on both continuation and reversal opportunities.
- Risk management is key: Always place stop-loss orders—ideally around the midpoint or lowest point of the range—to protect against false breakouts and sudden reversals.
Opening range breakouts are one of the important reversal and continuation chart patterns, designed to capture move or reversal during this first hour.
The first hour of the trading day is the most active and dynamic period. Though it is the time period where you can make most of your money quickly, you may also lose without a trading plan. The first hour is the most volatile time frame during the trading day.
In this blog, we will understand what is opening range is and the method to trade them.
What is Opening Range breakouts?
The opening range is high and low for a given period after the market opens. This period is generally the first 30 or 60 minutes of trading. It is one most important chart patterns to make money in the stock market.
During this period we need to identify the highs and lows of the day. Also, we need to identify pre-market highs and lows, as these levels act like a magnet on price action after the market opens.
The opening hour of the market is associated with big trading volumes and volatility. This time of the trading session provides many trading opportunities. In this way, traders use the opening range to set the entry points and to predict and forecast the price action for the day.
Size of the Opening Range Breakouts
The first thing you should do before trading is to measure the size of the opening range. When the market opens, you need to see two candles which will help you to measure the size of the range.
The last candle from yesterday’s trading session is the first candle and the second candle is the first one that is created when the market opens.
Learn to make profit out of failed breakouts in just 2 hours by Market Experts
To get the range size you need to take the high or low of yesterday’s last candle and the high or low of today’s opening candle. The difference between these two prices is the size of the opening range. Let’s see from the chart below how it measures the size of a range:
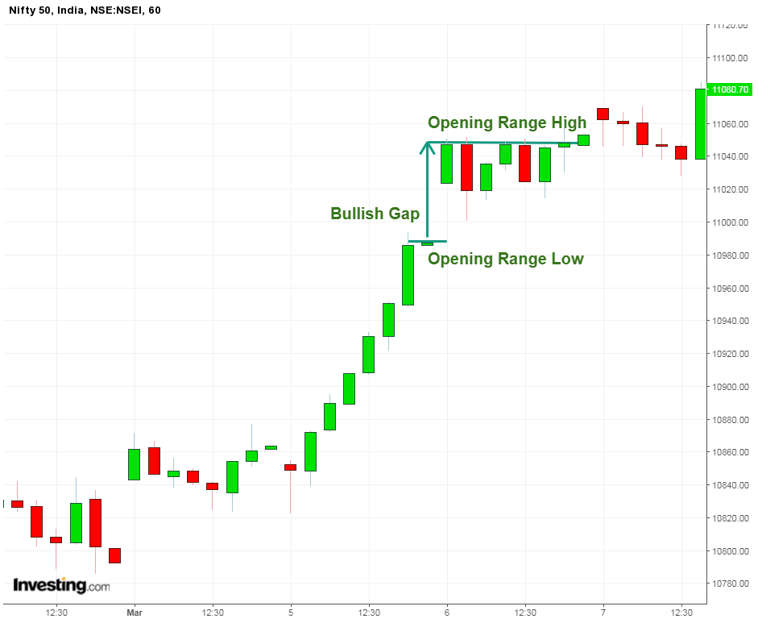
The green lines, as shown on the chart measure the size of the range. The upper line shows the opening range high and the lower horizontal line is the opening range low.
Opening Range Breakout Calculator
The most important part of the opening range trading is the breakout.
Also Read: Most Important Chart Patterns to Make Money in Stock Market
The opening range breakouts determine the further price direction. When the price breaks out of the range, there is a big chance that the price action will continue in the same direction. Therefore opening range trading strategies use the range breakout as entry points on the charts.
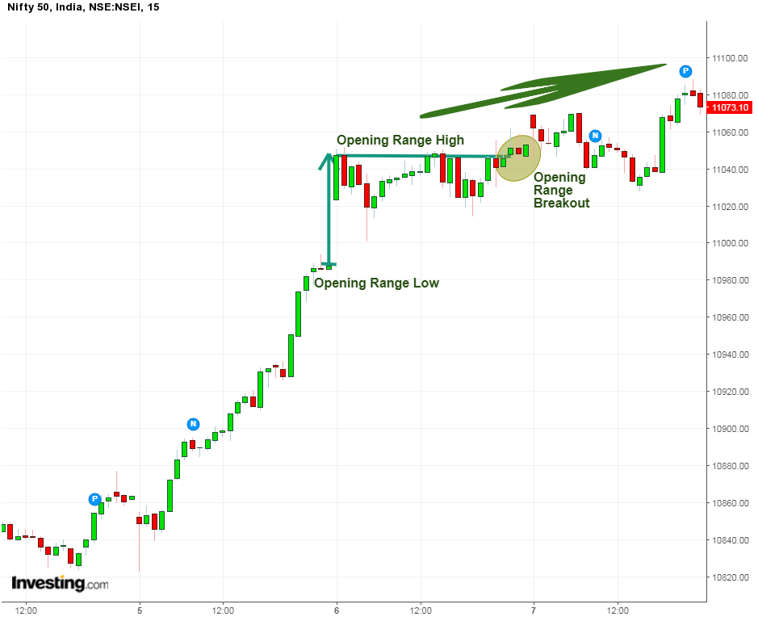
This is opening range breakouts. The size of the range is marked with green horizontal lines on the chart. The range breakout is located in the green circle and the price shoots up after the opening range breakouts.
ORB Trading Strategy
The stock market opening bell can be approached in many ways. Let’s discuss a day trading strategy:
1. Early Morning Range Breakout:
This is one of the popular opening range success formulas. The early morning range breakout focuses on the size of the gap and also on the breakthrough its high/low.
In this strategy, we need to trade in the direction of the breakout when we identify the boundaries of gaps. The breakouts later in the day should be taken as caution.
One should always use a stop-loss order when trading the early morning range breakout. The stop loss should be the mid-point of the gap.
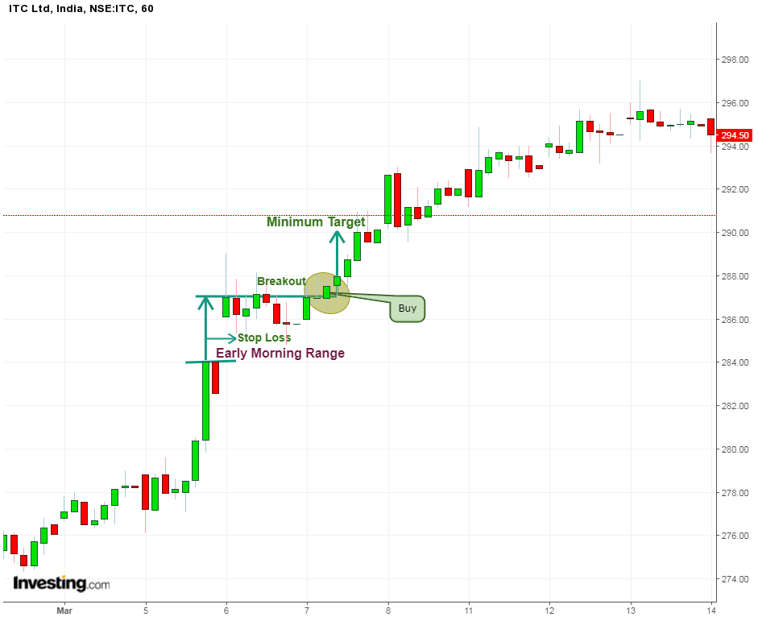
The picture above shows the hourly chart of ITC ltd, which exhibits an early morning range breakout.
The opening range is outlined with two parallel lines. We enter into a trade when the price breaks the upper level of the early morning range. The stop loss should be located in the middle of the range.
2. Chart Pattern Gap Pullback Buy
This is another approach for trading the opening range but is applied only to bullish gaps.
Once we spot a bullish gap on the chart, the price immediately starts moving contrary to the gap direction.
This is known as the pullback. As the gap is bullish, then the pullback would be bearish.
The main purpose of this strategy is to predict the end of the pullback.
In this strategy, one should know when to purchase the pullback.
This can be done by looking for a reversal candlestick pattern.
After identifying a reversal, one should wait for confirmation and then enter a long trade.
When you use this opening range trading strategy, you should use a stop-loss order for protecting your trades.
Also, the proper location of your stop should be below the lowest point of the opening range.
You should hold your trade for a minimum bullish move equal to the size of the gap.
3. Gap Reversal
The gap reversal is another way of approaching the opening morning range of stock.
There is a gap reversal when the price creates a gap, but the range is broken in the opposite direction.
If the gap is bullish, there is a gap reversal when the price breaks the lower level of the opening range.
Similarly, If the gap is bearish, then there is a gap reversal when the price breaks the upper level of the opening range.
When you open your gap reversal trade then you should also secure the trade with a stop-loss order.
The stop loss should be the mid-point of the opening range.
When you trade the gap reversal, then you should hold the trade for a minimum price move equal to the size of the gap.
Improve your trading strategies. Enroll in our Candlestick Pattern Course and start making more informed trading decisions!
Happy Learning!





in above article of opening range breakout you have explained range as difference between high/low of previous candle and high/low of following candle, but in charts you have shown it as difference of open/close of previous candle and open/close of following candle. please explain
Hi Anand,
Thank you for your feedback. We will change it as soon as possible.
Thank you for reading!
Keep Reading!
Saved as a favorite, I like your web site!
Keep on working, great job!
Hi
How can we use previous data for opening range calculation for next day trading if we do not use chart?
Hi,
This pattern is chart-based, you have to look at the charts when analyzing this pattern.
Thank you for Reading!
Nice!
Thank you for dessiminating knowledge on ORB.
Anand pointed out on the range markings. It has been two years you promised to change the range markings. Kindly do so immediately at least now.
Hi,
We really appreciated that you liked our blog.
Keep Reading!
Very nice explanation I like it! Thank you.
Hi,
We really appreciated that you liked our blog! Thank you for your feedback!
Keep Reading!