Key Takeaways
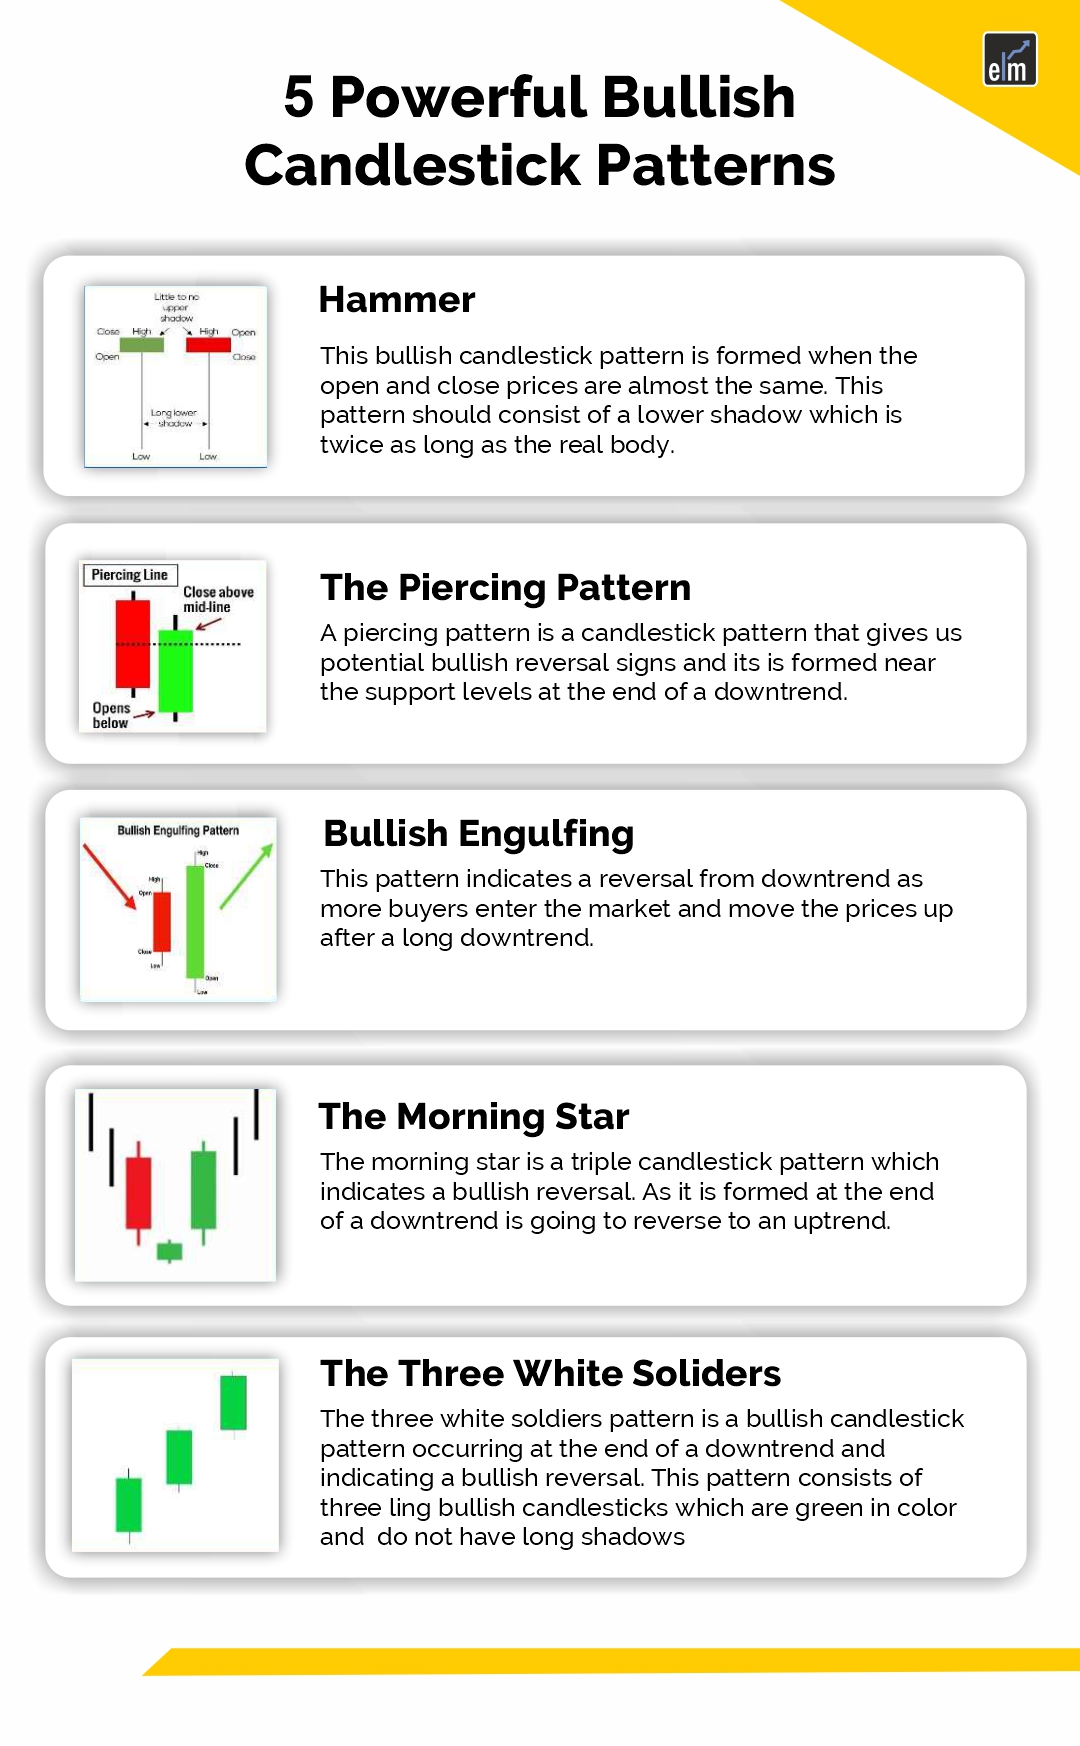
- Hammer signals a bullish reversal with a small body and a long lower shadow at the end of a downtrend.
- Piercing Pattern is a two-candle setup showing buyer strength after a gap-down in a falling market.
- Bullish Engulfing occurs when a green candle fully covers the previous red candle, hinting at a strong reversal.
- Morning Star is a three-candle pattern that marks the shift from bearish to bullish momentum.
- Three White Soldiers are three strong green candles that confirm buyer dominance and trend reversal.
Bullish Reversal Candlestick Patterns indicate that the ongoing downtrend is going to end, and it may reverse to an uptrend.
The Bullish Candlestick Pattern can be single or multiple candlestick patterns.
Before proceeding further, One should note that: Bullish reversal patterns should form at the end of a downtrend; otherwise, it will act just like a continuation pattern. One should confirm the reversal signals given by bullish reversal patterns with other indicators such as high trading volume.
In this blog, we will be discussing 5 Powerful Bullish Candlestick Patterns:
5 Bullish Candlestick Patterns
Below are 5 types of bullish candlestick patterns-
1. Hammer
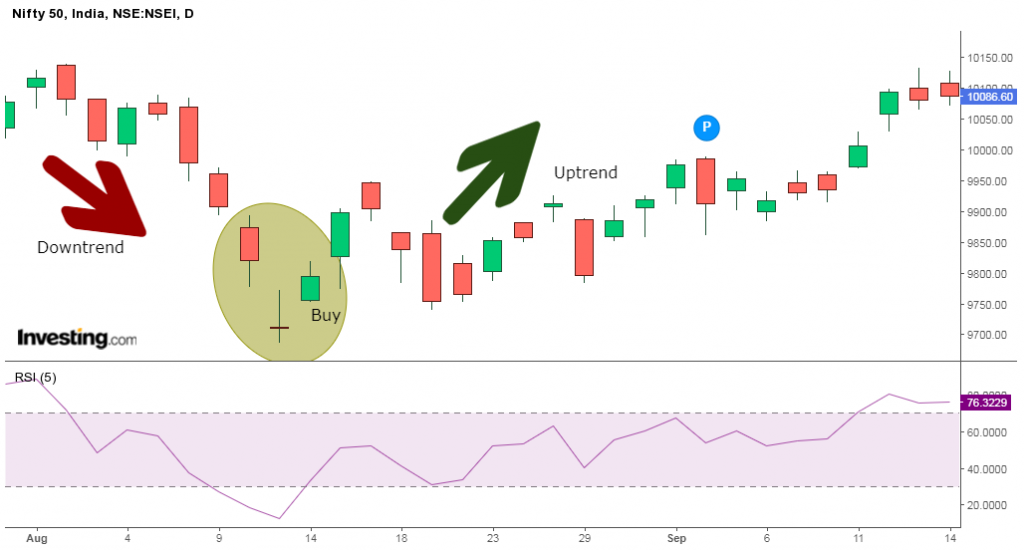
Hammer is a bullish reversal candlestick pattern that occurs at the bottom of a downtrend.
This bullish candlestick pattern is formed when the open and low prices are almost the same. This pattern should consist of a lower shadow which is twice as long as the real body.
When identifying this pattern, we should remember that the prior trend is a downtrend.
This pattern is formed when the real body is small along with a long lower shadow which shows that bears were trying to push down the prices but they were unable to do so.
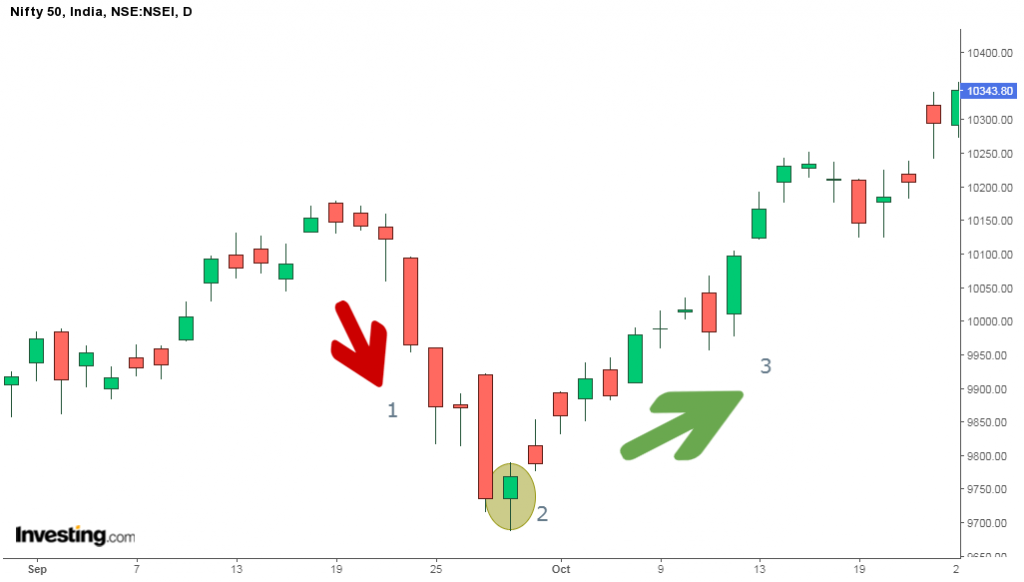
A bullish candlestick should be formed after the Hammer, which confirms that the bullish reversal has taken place.
Below is the daily chart of Nifty 50 in which all the above 3 points are demonstrated:
2. The Piercing Pattern
A piercing pattern is a candlestick pattern that gives us potential bullish reversal signs and it is formed near the support levels at the end of a downtrend.
This pattern is made of two candlesticks, the first one is a bearish candlestick, and the second one is a bullish candlestick.
The bearish candlestick should have a large real body, and the second bullish candlestick should be below the low of the previous candlestick and should close above the middle of the real body of the first candlestick.
Investors must look at a few characteristics when they trade with this bullish candlestick pattern – piercing pattern.
Firstly, the trend should be a downtrend, as the piercing pattern is a bullish reversal pattern.
Secondly, the length of the candlestick plays an important role in determining the force with which the reversal will take place.
The gap down between the bearish and bullish candlesticks indicates how powerful the trend reversal will be.
Fourthly, the bullish candlestick should close more than the midpoint of the previous bearish candlestick.
Lastly, the bearish, as well as the bullish candlestick, should have larger bodies.
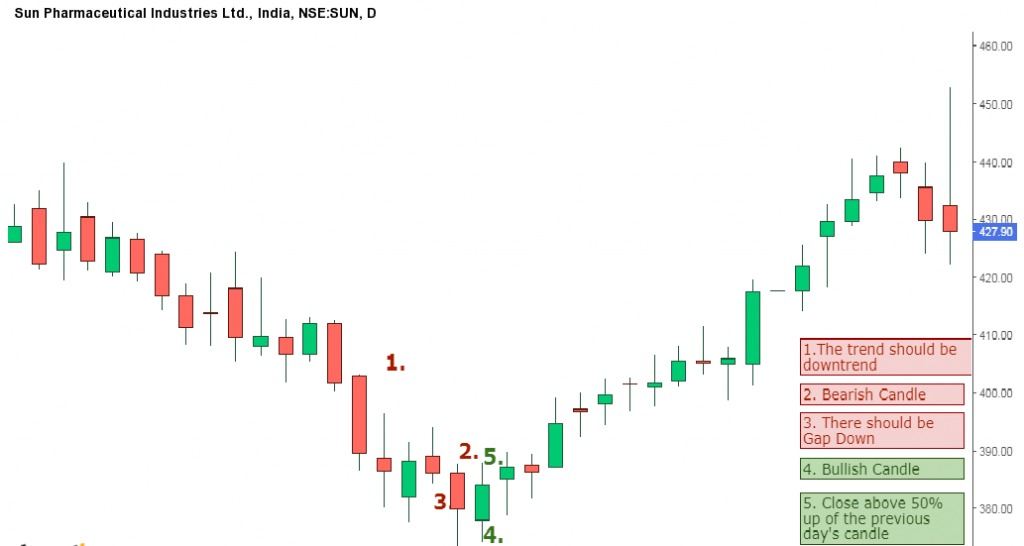
Below is an example of the piercing pattern in the daily chart of Sunpharma Industries Ltd.
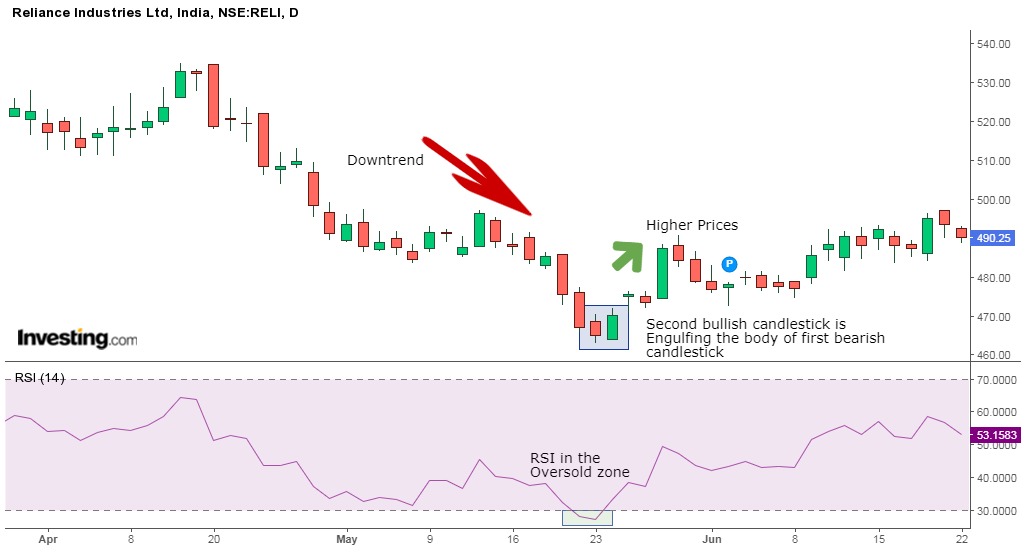
3. Bullish Engulfing
The bullish engulfing candlestick pattern indicates a bullish reversal, which shows a rise in the buying pressure. This bullish candlestick pattern indicates a reversal from the downtrend as more buyers enter the market and move the prices up after a long downtrend,
The pattern consists of two candles, with the second green candle completely engulfing the ‘body of the previous red candle.
One should remember when trading with a Bullish engulfing pattern the prior trend should be a downtrend. Engulfing candles helps the traders spot the trend reversals that indicate trend continuation and also assists traders with an exit signal:
Engulfing patterns support the continuation of the ongoing trend, for example, when spotting a bullish engulfing pattern in an uptrend, it indicates that the ongoing trend will continue.
Also, don’t forget to confirm the reversal signals given by this pattern with other technical indicators, as we have to use the Relative Strength Index in our example below.
4. The Morning Star
The Morning Star is a triple bullish candlestick pattern that indicates a bullish reversal.
As it is formed at the end of a downtrend, it gives us a warning sign that the downtrend is going to reverse to an uptrend.
It consists of three candles; a bearish candlestick, the second one can be either bullish or bearish with a small body, and the third candlestick is a bullish candle.
One should remember when trading with the Morning Star pattern the prior trend should be a downtrend.
For confirming the reversal signals given by this pattern, traders can use other technical indicators, as we have to use the Relative Strength Index in our example below.
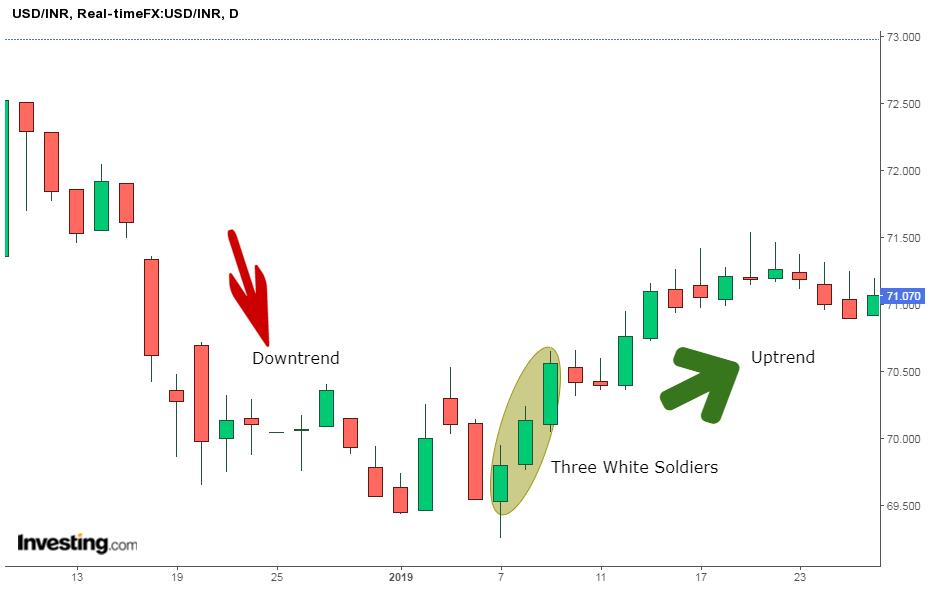
5. The Three White Soldiers
The three-white soldier’s pattern is a bullish candlestick pattern occurring at the end of a downtrend and indicating a bullish reversal.
This pattern consists of three long bullish candlesticks, which are green in colour and do not have long shadows.
This bullish candlestick pattern signals an uptrend reversal because of the strong buying pressure by the buyers.

All three candlesticks open within the real body of the previous candle in the pattern.
Below is an example of a daily chart of USD/INR that shows us how Three Soldiers Candlesticks is formed after a downtrend:
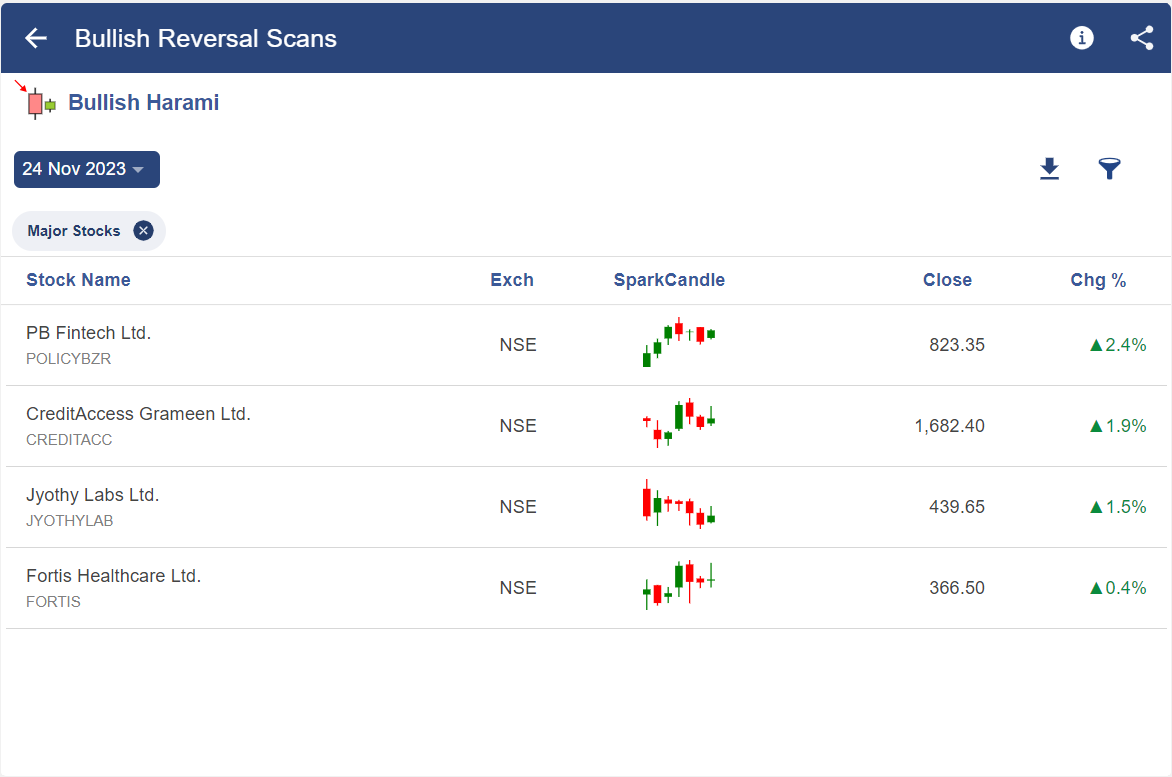
How to filter our stocks using Bullish Candlestick Scans in StockEdge?
There are bullish reversal candlestick scans available in StockEdge that help us filter the stocks as shown below-
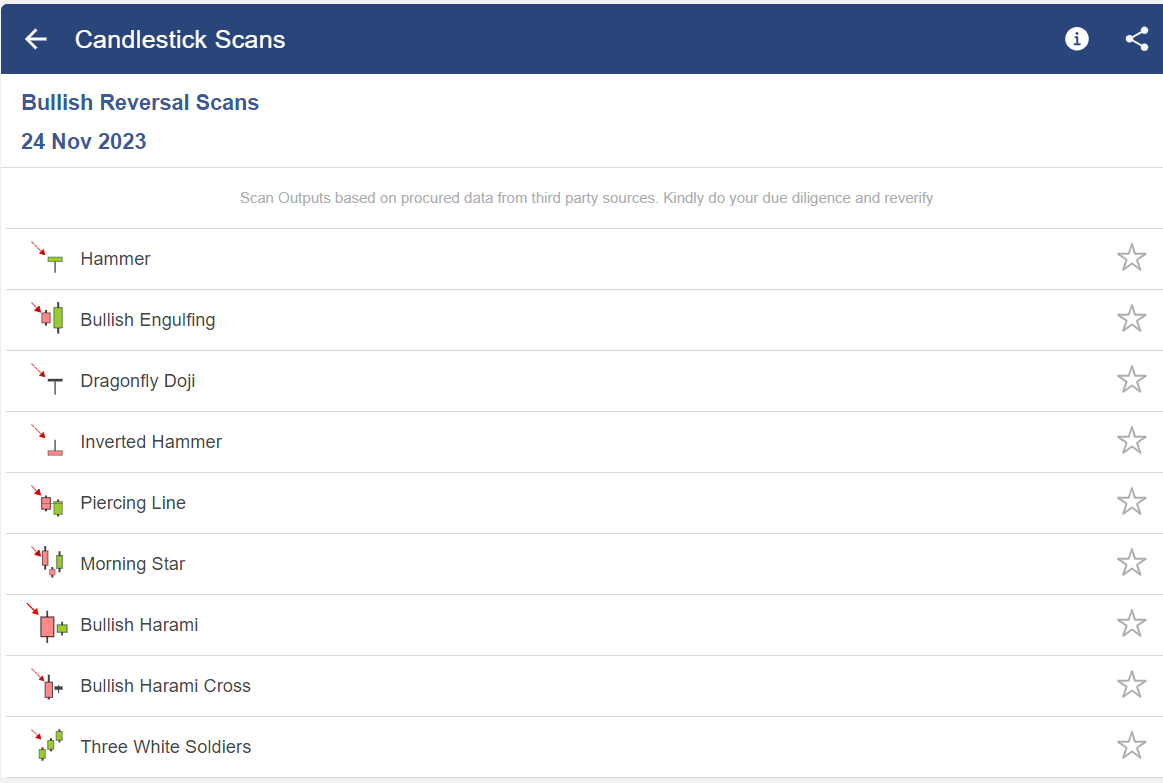
After selecting any of the above candlestick scans, we get a list of stock in which that particular candlestick pattern had happened-
To know about other candlesticks, read our blog on All 35 Candlestick Chart Patterns in the Stock Market-Explained
Bottomline
The above-discussed bullish candlestick patterns can give us important signals when the trend is going to reverse from a downtrend to an uptrend. One should also note that all these bullish candlesticks should be used with other technical indicators to confirm the signal given by them.
Enroll now to learn trading secrets with our Candlestick Pattern Course. Master 5 Powerful Bullish Candlestick Patterns for smarter investing.
Frequently Asked Questions (FAQs)
What are bullish candlestick reversal patterns?
Bullish candlestick reversal patterns contain the open price at the low of the period and close near the high. This shows buying pressure stepped in and reversed the downtrend. Some examples of bullish candles are the Hammer, Inverted Hammer, and Bullish Engulfing patterns.
How long after a reversal should a candlestick pattern be confirmed?
Since candlestick patterns are often only useful for one or two weeks, bullish confirmation should appear one to three days following the pattern. There must be a downturn to reverse for a reversal to be deemed bullish. It is difficult to classify a bullish engulfing at fresh highs as a bullish reversal pattern.
What are some examples of bullish candles?
Bullish Engulfing patterns, the Hammer, and the Inverted Hammer are a few instances of bullish candles. Alternatively, candlestick patterns with bearish reversals open close to the high and close at the low. The selling pressure was sufficient to turn the upward trend around. Common bearish candles are the Shooting Star, Hanging Man, and Bearish Engulfing patterns.


I want to learn this
Hi,
To learn in detail about the technical candlestick patterns and indicators you can check our courses on Technical Analysis
Thank you for Reading!
Thanks for sharing such a great information about the candlestick patterns that indeed an add on to my knowledge.
Hi,
Thank you for Reading!
Keep Reading!
This is very good suggestion to help all the stock market people
Hi,
Thank you for Reading!
Keep Reading!
Very useful
You make it very simple to grasp
Hi,
Thank you for Reading!
Keep Reading!
Excellent information about candlestic
Hi,
Thank you for Reading!
Keep Reading!
Enriched my knowledge on candle stick analysis to a great extent.
Hi,
Thank you for Reading!
Keep Reading!
Very simple explanation
Good
Ravindran
Hi,
Thank you for Reading!
Keep Reading!
Simple and easy
Thanks 😊 👆
Hi,
We really appreciated that you liked our blog.
Keep Reading!
thanks helpful for me in crypto
Hi,
We really appreciated that you liked our blog! Thank you for your feedback!
Keep Reading!