It shows buyers rejected lower prices during the session.
Needs confirmation from the next bullish candle or volume.
Can give false signals; use with other indicators.
Hammer candlestick pattern is a bullish reversal candlestick pattern. As it is a bullish reversal candlestick pattern, it occurs at the bottom of a downtrend.
This candlestick is formed when the open and close prices are almost the same. It consists of a lower shadow which is twice long as the real body.
Let us understand in detail how the Hammer candlestick is formed and how we can make trading decisions with it.
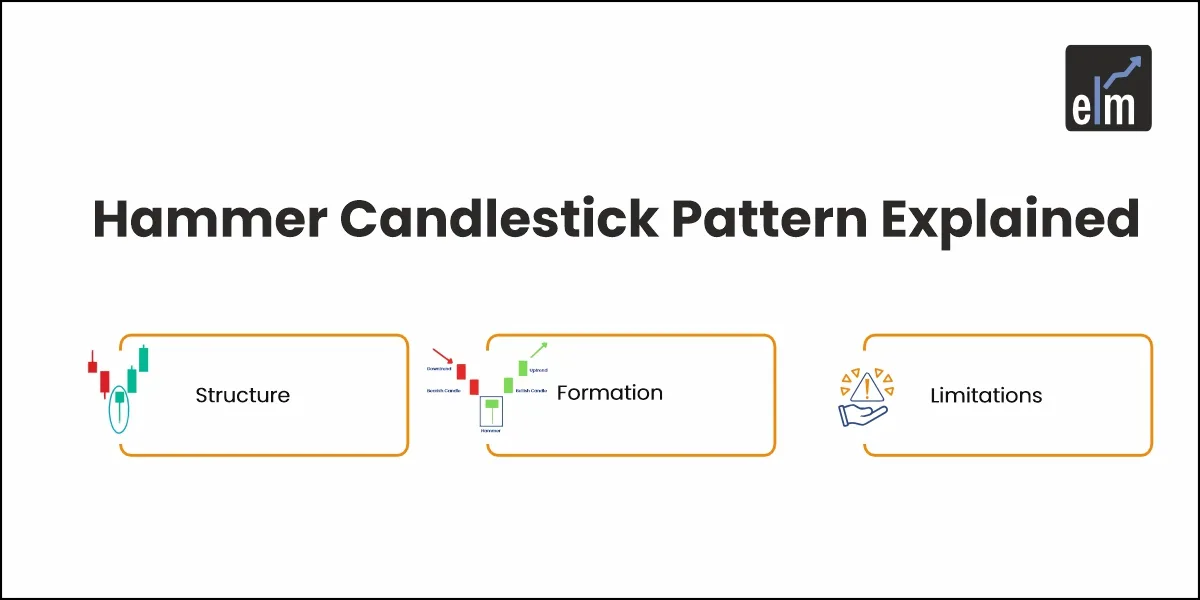
What is the Hammer Candlestick Pattern?
When the opening and closing prices are almost the same, the bulls have taken control of the prices. They have pushed the prices more than the initial opening price.
As Hammer is a bullish reversal candlestick pattern, it should be formed at the end of a downtrend. The long lower shadow shows that initially, the bears had taken the prices too low, near the support.
But then the bulls came, and they eventually took the prices up and closed it more than the opening price. There is a difference between Hammer and Inverted Hammer in terms of formation.

The Inverted Hammer candlestick is the upside-down version of Hammer.
What does Hammer Candlestick Pattern tell you?
As we have discussed above, Hammer is formed after the stock prices have been falling, indicating that the prices are attempting to form a bottom.
Hammers signal that the bears have lost control over the prices, indicating a potential reversal to an uptrend.
One should note that this candlestick should be formed after three or more bearish candles as it gives more confirmation.
Confirmation occurs when the candle after the Hammer closes above the closing price of the hammer.
This confirmation shows that the bullish reversal has taken place.
Traders should enter long positions only after the confirmation candle.
A stop-loss can be placed at the low of the hammer’s shadow.
Trading Example:
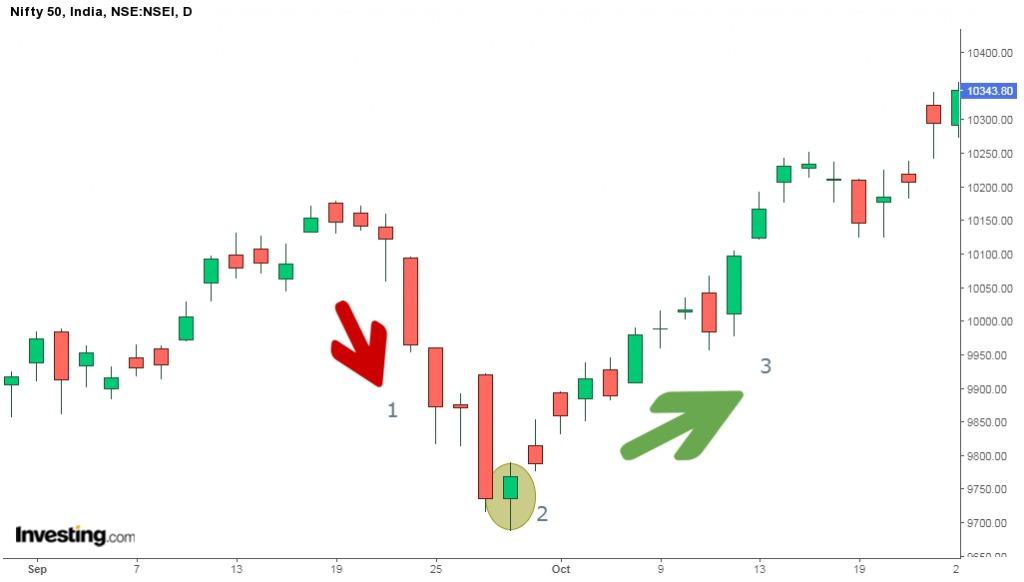
When identifying this pattern, one should note the following points:
- Before forming a Hammer pattern, the prior trend should be a downtrend, and there should be at least2-3 bearish candlesticks.
- The Hammer pattern is formed when the real body is small with a long lower shadow.
- To confirm the reversal, a bullish candlestick should be formed after the Hammer.
Below is the daily chart of Nifty 50 in which all the above 3 points have been shown:
To know about other candlesticks, read our blog on All 35 Candlestick Chart Patterns in the Stock Market-Explained
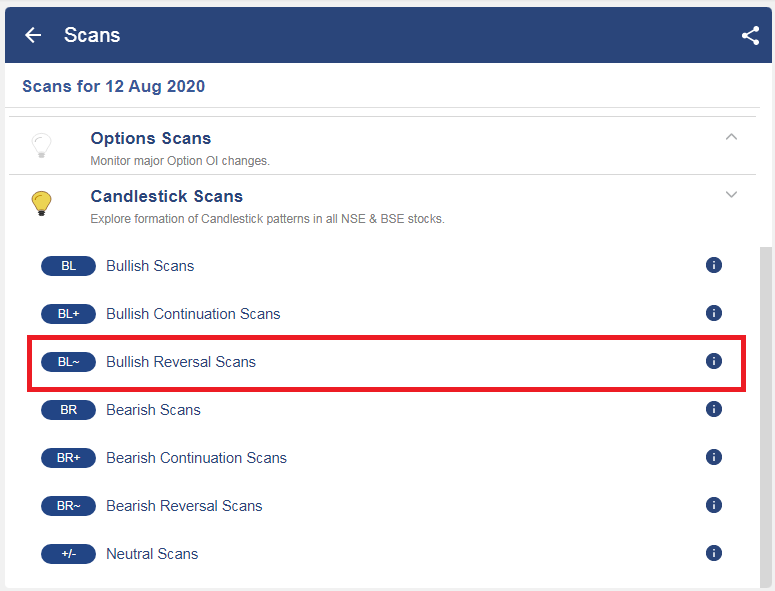
How to use Hammer Candlestick Pattern Scans in StockEdge:
You can also use hammer scans in StockEdge web version:
Steps to use these scans in StockEdge:
Under the “Candlestick Scans” we can see Bullish Reversal scans as shown below:
When we click on the “Bullish Reversal scans” we can see “Hammer” scan, click on that:
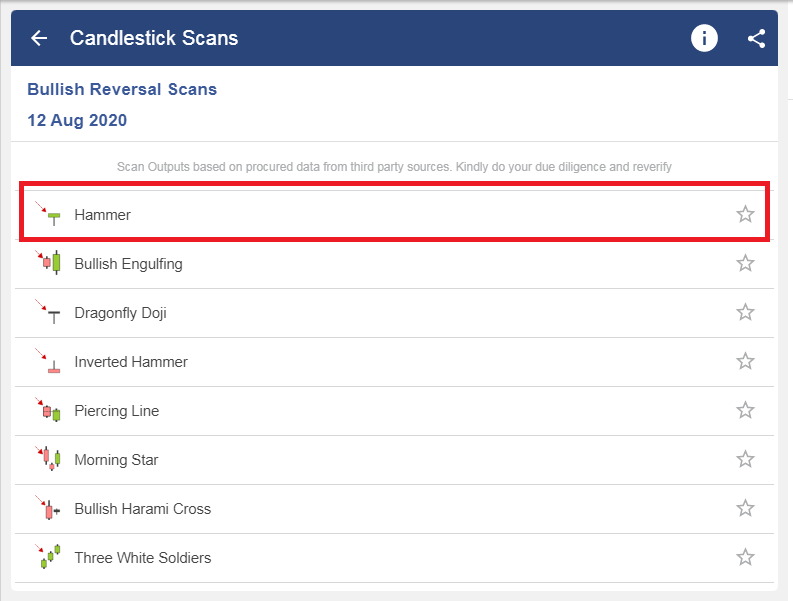
After selecting it, you will get a list of stocks in which the “Hammer” pattern is formed.
Limitations of Hammer:
There is no assurance that the price will continue to move up after the confirmation candle.
A long-shadowed Hammer may push the price high within two trading sessions. This is not an ideal spot for buying as the stop loss may be at a great distance away from the buying point.
Hammers don’t provide a price target, so determining profit for this trade may be difficult. Also, a candlestick pattern is significant when it occurs near an important level signaled by other technical indicators.
Bottomline
A Hammer candlestick pattern is a bullish reversal that occurs at the bottom of a downtrend. Hammers signal that the bears have lost control over the prices, indicating a potential reversal to an uptrend. Confirmation occurs when the candle after the Hammer closes above the closing price of the hammer. Hammers don’t provide a price target, so determining profit for this trade may be difficult.
Frequently Asked Questions (FAQs)
1. Is the Hammer Bullish or Bearish?
A bullish trading pattern known as the hammer candlestick indicates that a stock has reached a bottom and is about to see a trend reversal. It indicates that when sellers entered the market and pushed prices lower, buyers eventually outnumbered sellers and raised the asset’s price.
2. What is the Hammer Candlestick After an Uptrend?
In an upswing, an inverted hammer candlestick indicates that traders who are bullish are in the driver’s seat. Known as a shooting star, it is said to appear at the apex of a trend and portend a decline in price.
3. Can a Bullish Hammer be Red?
Similar to a green hammer, a red hammer suggests a possible bullish trend reversal. It demonstrates that although buyers could prevail over sellers, they were unable to raise the asset’s price over its opening price during the trading session.


It necessary to lean candlestick patarn for new traders or invester this is the helpful
We are highly benifited to read your writing thanks
Hi,
We really appreciated that you liked our blog.
Keep Reading!
I am new here but I am learning from this type of blog and videos. Very Good Content.
Hi,
We really appreciated that you liked our blog! Thank you for your feedback!
Keep Reading!