Elearnmarkets - Financial Market Learning
  • Categories
    • Basic Finance
    • Derivatives
      • Futures
      • Options
    • Financial Planning
    • Fundamental Analysis
    • Technical Analysis
    • Marketshala
    • Miscellaneous
  • Language
    • English
    • Hindi
    • Bengali
No Result
View All Result
  • Courses
  • Webinars
  • Stories
Elearnmarkets - Learn Stock Market, trading, investing for Free
No Result
View All Result
Home Technical Analysis
4 Types of Price Gaps a Trader should know 1

4 Types of Price Gaps a Trader should know

Elearnmarkets by Elearnmarkets
November 21, 2022
in Technical Analysis, Charts, Patterns & Indicators
Reading Time: 7 mins read
5
17.3k
VIEWS
Share on FacebookShare on XShare on WhatsApp

Hindi: आप इस लेख को हिंदी में भी पढ़ सकते है|

Key Takeaways:

  • Price Gaps are common patterns that are used as trading strategies by both day traders and positional traders.
  • A gap is formed when the closing price of the previous days and the opening price of the next day have different price levels.
  • Gaps can be classified into Common gaps, Breakaway Gaps, Exhaustion Gap and Runaways Gaps.
  • Traders can build a trading strategy based on the type of gaps formed.
    Table of Contents
    What is a Gap?
   Why Does a Gap Occur?
    4 Types of Price Gaps
   Playing with the Gaps

Have you ever noticed a break between the opening price and the closing price of the previous day?

If yes, the break between these two trading sessions is known as the Price Gap.

Gaps are common price patterns that are used as trading strategies by both day traders and positional traders.

In this blog, we will discuss about the basics of gaps as well as the 4 types of commonly used gaps in trading.

RelatedPosts

5 Important Volatility Indicators that Traders should know 2

5 Important Volatility Indicators that Traders should know

September 19, 2023
57.7k
Top 5 Momentum Indicators that Analyses Trend Strength 3

Top 5 Momentum Indicators that Analyses Trend Strength

September 7, 2023
93k
5 important roles of Relative Strength Index (RSI) 4

5 important roles of Relative Strength Index (RSI)

September 11, 2023
41.2k

What is a Gap?

A gap is formed when the closing price of the previous days and the opening price of the next day have different price levels.

This is formed mainly due to any news in that specific stock, after the trading session.

For example, if the company earning is higher than expected, then the stock will gap up the next day.

Suggested Read : Gap Trading Strategies

Why Does a Gap Occur?

A gap usually occurs when there is low liquidity in the market. There are not enough buyers or sellers to trade that stock.

It may also occur when there is a high volume in that stock.

Important events like earnings releases and company-related news that impact the market sentiment after the stock closes lead to gaps in the stock prices when the stock opens the next day.

4 Types of Price Gaps:

Gaps can be mainly classified into 4 groups:
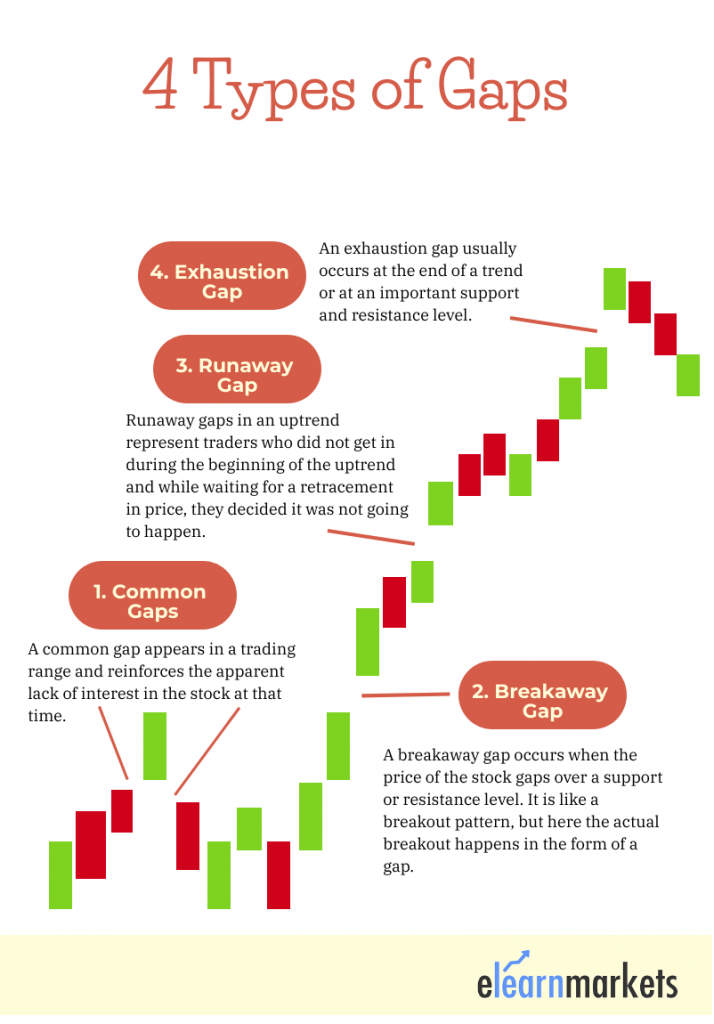
types of price gaps

1. Common Gaps:

Common Gaps are also sometimes referred to as a trading gap or an area gap.

This type of price gaps occurs in nervous markets and is generally closed within a few days. They can be caused by a stock going ex-dividend when the volume is low.

A common gap appears in a trading range and reinforces the apparent lack of interest in the stock at that time.

Knowing about these types of price gaps is good, but it’s usually doubtful that they will produce trading opportunities.

2. Breakaway Gaps:

The breakaway gap usually does not get filled initially.

A breakaway gap occurs when the price of the stock gaps over a support or resistance level. It is like a breakout pattern, but here the actual breakout happens in the form of a gap.

This kind of gap signals strong momentum and price keeps on trending after a breakaway gap.

Furthermore, the larger the breakaway gap, the stronger is the next candle after the gap, and the stronger the prevailing trend will be.

3. Runaway /Continuation Gaps:

Runaway gaps are also referred to as measuring gaps.

Runaway gaps in an uptrend represent traders who did not get in during the beginning of the uptrend and while waiting for a retracement in price, they decided it was not going to happen.

There is increased buying interest all of a sudden. This type of runaway gap represents an almost panic state in traders.

Runaway gaps can also be caused by important news events which may cause new interest in the stock.

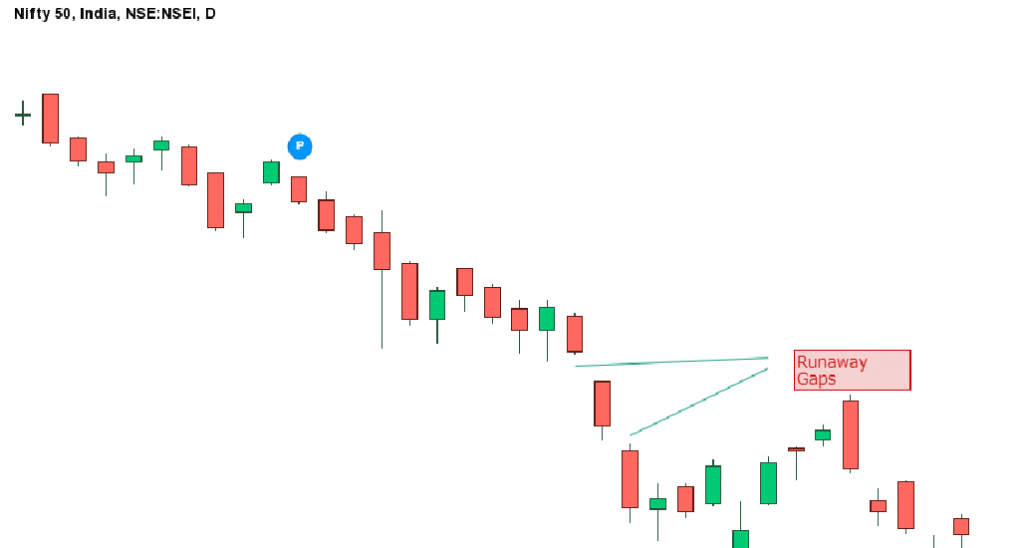
In a downtrend, runaway represents an increase in the liquidation of the stock by the buyers who are standing on the sidelines.

We can see an example of Runaway Gap in the daily chart of Nifty below:

runaway gap chart

4. Exhaustion Gaps:

Exhaustion gaps usually get filled and the best way to trade an exhaustion gap is not to speculate but use the information to time exits and entries around the pattern.

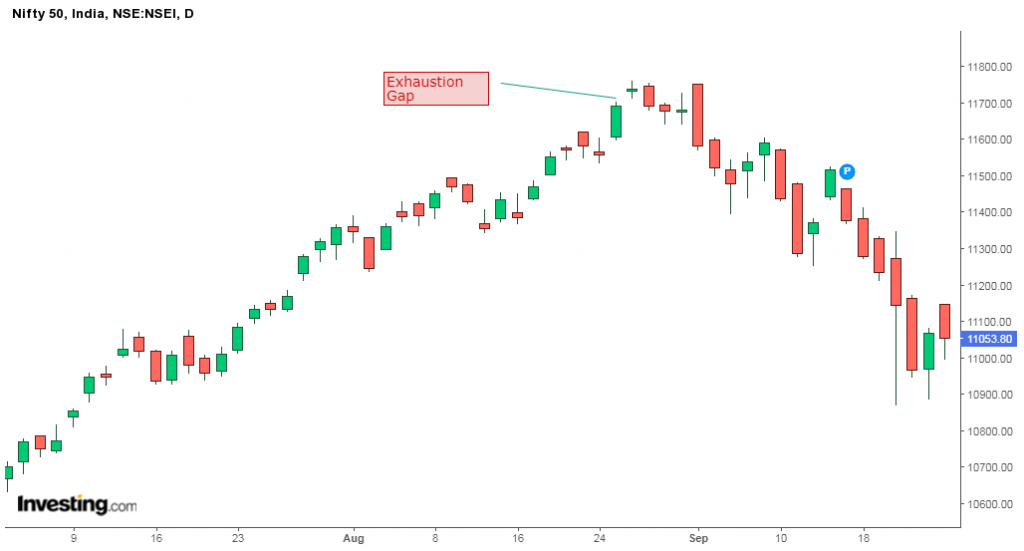
An exhaustion gap usually occurs at the end of a trend or at an important support and resistance level.

The first gap in the direction of the trend can look like a runaway gap but the following candle is usually after a Doji pattern showing the indecision or rejection of a price level.

We can see an example of the Exhaustion Gap in the daily chart of Nifty below:

exhausion price gaps

Playing with the Gaps:

Traders can build a trading strategy based on the type of price gaps formed.

As a rule of thumb, below are some points traders need to consider when trading gap:

  • Common gaps usually should be traded in the opposite direction, as the market fills the gap after they occur.
  • Continuation gaps signal a strong trend, and traders can enter in the direction of the trend after a continuation gap occurs.
  • Exhaustion gaps signal trend reversals and traders should look to enter the opposite trend after they spot this gap.

With the help of the above thumb rules, both the day traders and positional traders can analyze the gaps in the charts and trade accordingly.

You can also use technical scans to filter out stocks for trading the next day by using StockEdge App, now also available in the web version.

Tell us if you found this price gaps pattern interesting by commenting below.

Happy Learning!

Tags: englishgap theory in technical analysisgap trading strategiesintermediate
Share1TweetSend
Get Kotak Offer Get Kotak Offer Get Kotak Offer
Previous Post

क्या केवल इक्विटी मार्किट में निवेश करना सही वित्तीय निर्णय है?

Next Post

কোন মহামারী চলাকালীন আপনার কি সঞ্চয় বা বিনিয়োগ করা উচিত?

Elearnmarkets

Elearnmarkets

Elearnmarkets (ELM) is a complete financial market portal where the market experts have taken the onus to spread financial education. ELM constantly experiments with new education methodologies and technologies to make financial education effective, affordable and accessible to all. You can connect with us on Twitter @elearnmarkets.

Related Posts

5 Important Volatility Indicators that Traders should know 5
Technical Analysis

5 Important Volatility Indicators that Traders should know

September 19, 2023
57.7k
Top 5 Momentum Indicators that Analyses Trend Strength 6
Technical Analysis

Top 5 Momentum Indicators that Analyses Trend Strength

September 7, 2023
93k
5 important roles of Relative Strength Index (RSI) 7
Technical Analysis

5 important roles of Relative Strength Index (RSI)

September 11, 2023
41.2k
NR4 and NR7 Trading Strategy Setup 8
Technical Analysis

NR4 and NR7 Trading Strategy Setup

September 14, 2023
82.3k

Comments 5

  1. Rahul says:
    3 years ago

    Thank You For Sharing this awesome post on what is the gap and the different types of gaps. I was searching for information on the gap and couldn’t find a better blog where the explanation relating to gaps are perfectly explained. Looking Forward To more of the informational blog on your site which will help me improve my financial knowledge.

    Reply
    • Sakshi Agarwal says:
      3 years ago

      Hi,

      Thank you for reading our blogs!

      Keep Reading!

      Reply
  2. Murali says:
    3 years ago

    Nice information!

    Reply
  3. Soumita Mitra says:
    2 years ago

    Very informative. Thank you for answering my questions . It helps a lot.

    Reply
    • Sakshi Agarwal says:
      2 years ago

      Hi,

      We really appreciated that you liked our blog.

      Keep Reading!

      Reply

Leave a Reply Cancel reply

Your email address will not be published. Required fields are marked *

Elearnmarkets Logo

Follow Us

Facebook-f Twitter Instagram Linkedin-in Youtube Telegram

Register on Elearnmarkets

Continue your financial learning by creating your own account on Elearnmarkets.com

Register Free Account

Download App

Playstore logo
Download on app store

Categories

  • Basic Finance
  • Derivatives
  • Financial Planning
  • Fundamental Analysis
  • Technical Analysis
  • Marketshala
  • Miscellaneous

Popular On Elearnmarkets

  • Market Superheroes:
  • Vivek Bajaj
  • Chetan Panchamia
  • Ashish Kyal
  • Premal Parekh
  • Abhijit Paul
  • Jegan
  • Sivakumar Jayachadran
  • Vishal Malkan
  • Jyoti Budhia
  • Vivek Gadodia
  • Vishal Mehta
  • Piyush Chaudhry
  • Santosh Pasi
  • Gomathi Shankar
  • Market Superheroes:
  • Vivek Bajaj
  • Chetan Panchamia
  • Ashish Kyal
  • Premal Parekh
  • Abhijit Paul
  • Jegan
  • Sivakumar Jayachadran
  • Vishal Malkan
  • Jyoti Budhia
  • Vivek Gadodia
  • Vishal Mehta
  • Piyush Chaudhry
  • Santosh Pasi
  • Gomathi Shankar
  • Courses:​
  • Options Trading
  • Dow Theory
  • Momentum Trading
  • Stock Investing
  • Stock Market for Beginners
  • Harmonic Chart Patterns
  • Algo Trading
  • Elliot Wave Theory
  • Advanced Excel
  • Cryptocurrency
  • NSE Certification Course
  • Courses:​
  • Options Trading
  • Dow Theory
  • Momentum Trading
  • Stock Investing
  • Stock Market for Beginners
  • Harmonic Chart Patterns
  • Algo Trading
  • Elliot Wave Theory
  • Advanced Excel
  • Cryptocurrency
  • NSE Certification Course
  • Webinars:
  • Bank Nifty Scalping
  • Intraday Trading Strategies
  • Options Trading Strategies
  • Options selling
  • Price Action
  • Relative Strength
  • Tax Planning
  • Options Buying
  • Growth Stocks
  • Portfolio Management
  • Relative Strength Index
  • Risk Management
  • Renko Charts
  • Crude Oil
  • Traders Psychology
  • Moving Average
  • Multibagger Stocks
  • Free Learning Modules:
  • Intraday Trading
  • Options Scalping
  • Swing Trading
  • Financial Modelling
  • RSI Indicator
  • Bollinger Bands
  • Pricing of Futures
  • Personal Finance
  • Initial Public Offerings (IPO)
  • Value Investing
  • Technical Indicators
  • Candlesticks
  • Chart Patterns
  • Option Greeks
  • ELSS Funds
  • Banking and Insurance
  • Real Estate
  • Gold
  • Book Summaries:
  • Rich Dad Poor Dad
  • Psychology of Money
  • The Intelligent Investor
  • The Richest Man in Babylon
  • Think and Trade Like a Champion
  • Value Investing and Behavioural Finance
  • Trading in the Zone
  • Learn to Earn
  • Book Summaries:
  • Rich Dad Poor Dad
  • Psychology of Money
  • The Intelligent Investor
  • The Richest Man in Babylon
  • Think and Trade Like a Champion
  • Value Investing and Behavioural Finance
  • Trading in the Zone
  • Learn to Earn
  • Tools:
  • CAGR Calculator
  • SIP Calculator
  • eLearnOptions
  • Future Value Calculator
  • Present Value Calculator
  • Atal Pension Yojana
  • Cost of Delay Calculator
  • Become a Crorepati
  • Tools:
  • CAGR Calculator
  • SIP Calculator
  • eLearnOptions
  • Future Value Calculator
  • Present Value Calculator
  • Atal Pension Yojana
  • Cost of Delay Calculator
  • Become a Crorepati

© 2023 Elearnmarkets. All Rights Reserved

  • Visit Elearnmarkets
  • Courses
  • Webinars
  • Financial Guides
  • Get Free Counselling
  • Visit Elearnmarkets
  • Courses
  • Webinars
  • Financial Guides
  • Get Free Counselling

Get Elearnmarkets App

No Result
View All Result
  • Article Categories
    • Basic Finance
    • Derivatives
    • Financial Planning
    • Fundamental Analysis
    • Technical Analysis
    • Marketshala
    • Miscellaneous
  • Language
    • Hindi
    • Bengali
    • English
  • Courses
  • Webinars
  • Stories

© 2020 Elearnmarkets All Rights Reserved

View Details
View Course Details
Guidebook On Chart Patterns
Take Your Trading To The Next Level With Strategies Shared In This Ebook
Download Now