Keltner Channels are a popular technical indicator used by day traders to analyze the current trend and provide trading signals.
The Keltner Channel was discovered and named after American grain trader Chester W. Keltner, who wrote it in his book entitled “How to Make Money in Commodities” in 1960.
This is a volatility-based indicator and uses average prices to plot upper, lower, and middle lines. All three lines move along with the price and create a channel-like appearance.
Keltner Channels are volatility as well as trend following indicator that is used for identifying reversals with channel breakouts.
In this blog, we will discuss the basics of the Keltner Channel and how to use it when trading in the stock market:
What is the Keltner Channel?
The Keltner Channel is a volatility-based indicator that consists of three separate lines.
The middle line is an exponential moving average (EMA) of the price. The upper and lower bands are set two times the Average True Range (ATR).
The default period of the middle EMA is usually 20 periods.
Prices usually move between the upper and lower bands, which are known as the channel.
The direction of the channel or angle helps identify the direction of trends. When the channel is up, the price is rising, and when the channel is downward, the price is falling.
Keltner Channel Formula:
Below is the formula for calculating the Keltner Channel Bands:
Upper Band = EMA + (ATR x multiplier)
Middle Band = EMA
Lower Band = EMA – (ATR x multiplier)
The EMA period can be set for any period, according to the trader’s strategy. For day trading, an EMA is usually set for 15 to 40.
The ATR common multiplier is 2, which means that the upper band is plotted 2 x ATR above the EMA, and the lower band is plotted 2 x ATR below the EMA.
The multiplier can also be set based on the asset you’re trading. While 2 is used often, traders can also use 1.7 or 2.3.
One should remember that the higher the multiplier, the wider the channel will be; whereas the smaller the multiple, the narrower the channel will be.
How to trade with Keltner Channel?
Indicators that are based on channels or bands usually analyse the price action.
Thus, when the prices move above or below the channel lines then it attracts attention as they are relatively rare.
When the prices move above the upper channel line, they show extraordinary strength; on the other hand, when they move below the lower channel line, they show extraordinary weakness.

Such strong moves above or below the channels can signal the end or beginning of the trend.
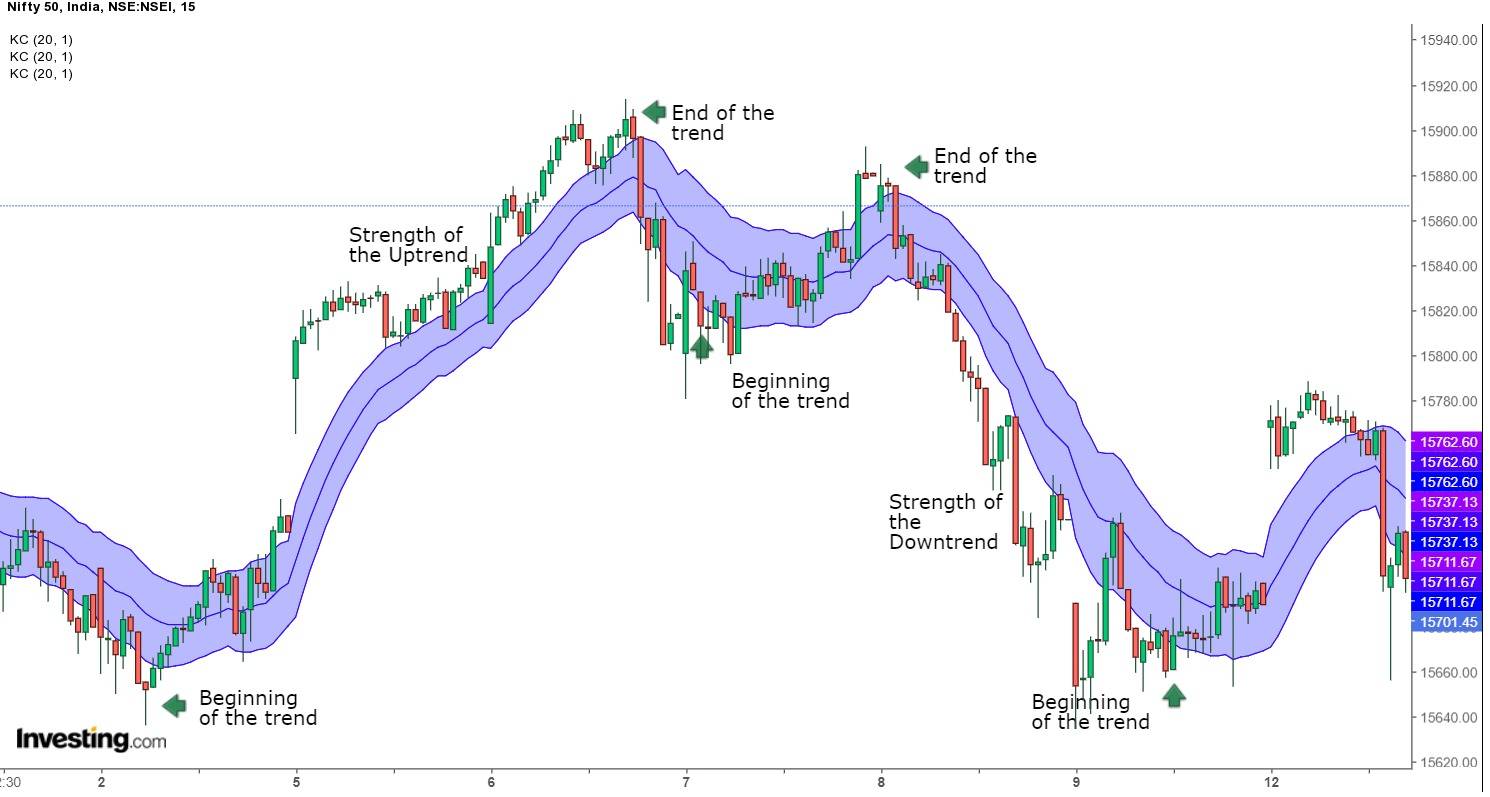
As the middle line is an exponential moving average, Keltner Channels are also a trend following indicator and lag price action.
The direction of this indicator indicates the direction of the price movement. Usually, there is a downtrend when the channel moves lower, and an uptrend occurs when the channel moves higher.
When the trend is flat, the channel moves sideways.
When the channels reverse up and break above the upper trend line, then it indicates the start of an uptrend.
On the other hand, when the channels reverse down and break below the lower trend line, then it indicates the start of a downtrend.
Sometimes, a strong trend does not take hold after the breakout, and prices oscillate between the channel lines, indicating consolidation.
Difference between Keltner Channels and Bollinger Bands
There are two main differences between Keltner Channels and Bollinger Bands.
Keltner Channels are smoother than the Bollinger Bands as the width of the Bollinger Bands is more volatile than of the Keltner channels as Bollinger Bands are based on volatility and Keltner channels are based on Average True Range.
As the middle band of the Keltner Channel is based on an exponential moving average, it is considered to be more sensitive than the simple moving average which is used by the Bollinger bands.
Bottom line
One should note that while Keltner Channels help identify the trend direction and indicate trade signals, they are best used with other price action analyses, fundamentals for the long term, and technical indicators.
For more stock related queries visit StockEdge


