Elearnmarkets - Financial Market Learning
  • Courses
  • Webinars
  • Stories
  • Language
    • English
    • Hindi
    • Bengali
No Result
View All Result
Get Free Course
  • Basic Finance
  • Derivatives
    • Futures
    • Options
  • Financial Planning
  • Fundamental Analysis
  • Technical Analysis
  • Mutual Funds
  • Marketshala
  • Miscellaneous
Elearnmarkets - Learn Stock Market, trading, investing for Free
  • Courses
  • Webinars
  • Stories
  • Language
    • English
    • Hindi
    • Bengali
No Result
View All Result
Get Free Course
Elearnmarkets - Learn Stock Market, trading, investing for Free
No Result
View All Result
Home Technical Analysis
3 Trading Strategies using Stochastics Technical Indicator 1

3 Trading Strategies using Stochastics Technical Indicator

Elearnmarkets by Elearnmarkets
March 11, 2024
in Technical Analysis
Reading Time: 7 mins read
0
18.4k
VIEWS
Share on FacebookShare on XShare on WhatsApp

A stochastics oscillator is a momentum indicator that compares a security’s closing price to a range of its prices over a given time period. The oscillator’s sensitivity to market movements can be reduced by adjusting the time period or by taking a moving average of the result. It generates overbought and oversold trading signals with a 0-100 value range.

So, In today’s blog, let us discuss some trading strategies using stochastic indicator:

Table Of Contents
  1. What is Stochastic Technical Indicator?
  2. How do you trade with this Indicator?
    • 1. Divergence Trading Strategy
    • 2. RSI Trading Strategy
    • 3. MACD Trading Strategy
  3. Stochastics Scans in StockEdge
  4. What is Stochastics?
  5. How does Stochastics work?
  6. What are the main components of Stochastics?

What is Stochastic Technical Indicator?

The stochastic oscillator, invented by George Lane in the 1970s, is a type of momentum indicator. The indicator is primarily used to determine whether the price has entered an overbought or oversold zone. 

stochastics

Over a given time period, the Stochastic Oscillator compares where the price closed relative to the price range. The Stochastic Oscillator is represented by two lines, the main line “%K” and the second line “%D,” which represents a moving average of %K.

How do you trade with this Indicator?

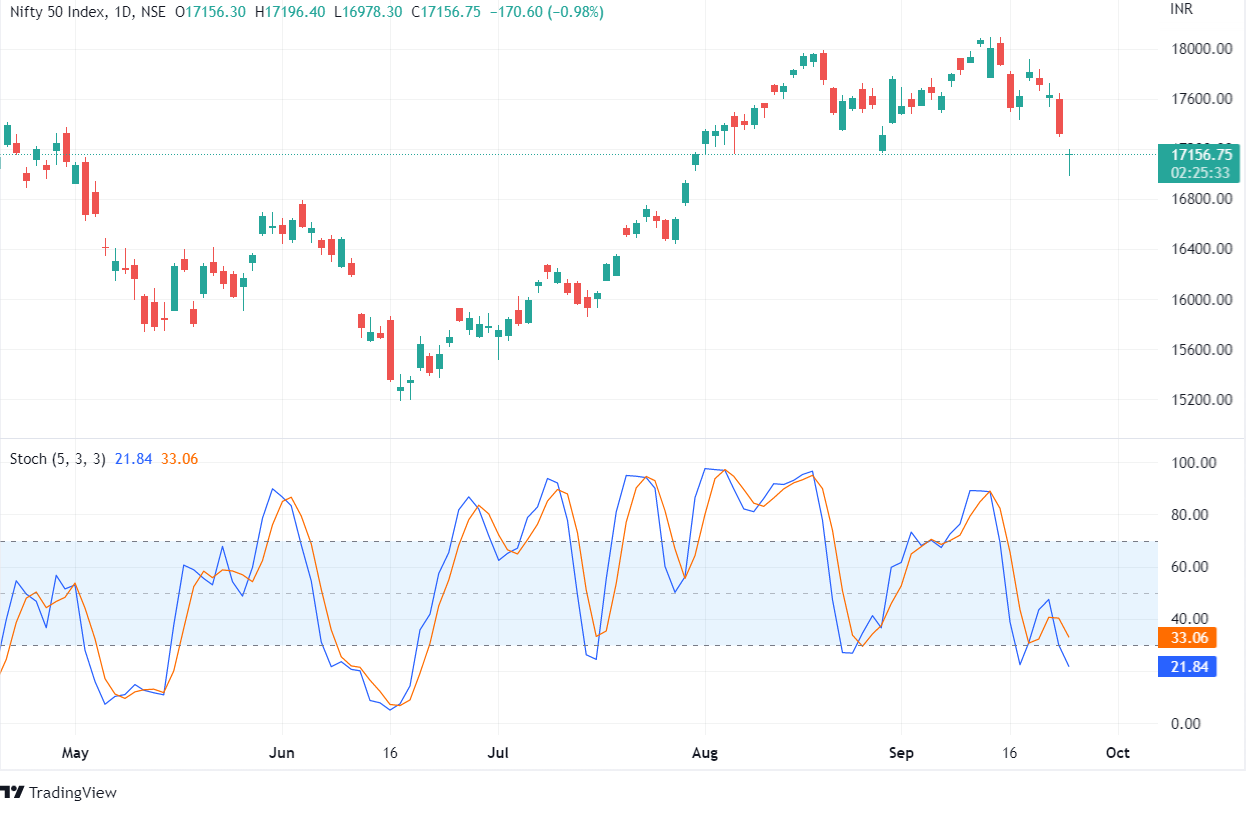
The stochastic is intended to oscillate between 0 and 100.

  • Low levels indicate that the market is oversold, while high levels indicate that the market is overbought.
  • A Stochastics Indicator value of 20 or less indicates that the market is oversold. An overbought condition is indicated by a value of 80 or higher.

Keep in mind that the price can often remain in oversold or overbought territory for extended periods of time. Although reversals from oversold and overbought levels are commonly regarded as buy/sell signals, we must remember that these are just assumptions, and this cannot be regarded as a signal for an entry.

1. Divergence Trading Strategy

Divergence is an extremely effective trading concept. Divergences, according to George Lane, the creator of the Stochastic Oscillator, were the best Stochastic strategy of his momentum oscillator. He believed that price momentum frequently reversed prior to an actual price turn, providing important insights to technical traders.

A bullish divergence occurs when prices make a lower low. At the same time, the Stochastic Oscillator makes a higher low, indicating that the downward price momentum is slowing, which often serves as a precursor for price reversals to the upside.

Bearish divergence on a chart occurs when prices make a higher high while the Stochastic Oscillator makes a lower high, indicating that upward price momentum is slowing, which often acts as a catalyst for downward price movement.

3 Trading Strategies using Stochastics Technical Indicator 2

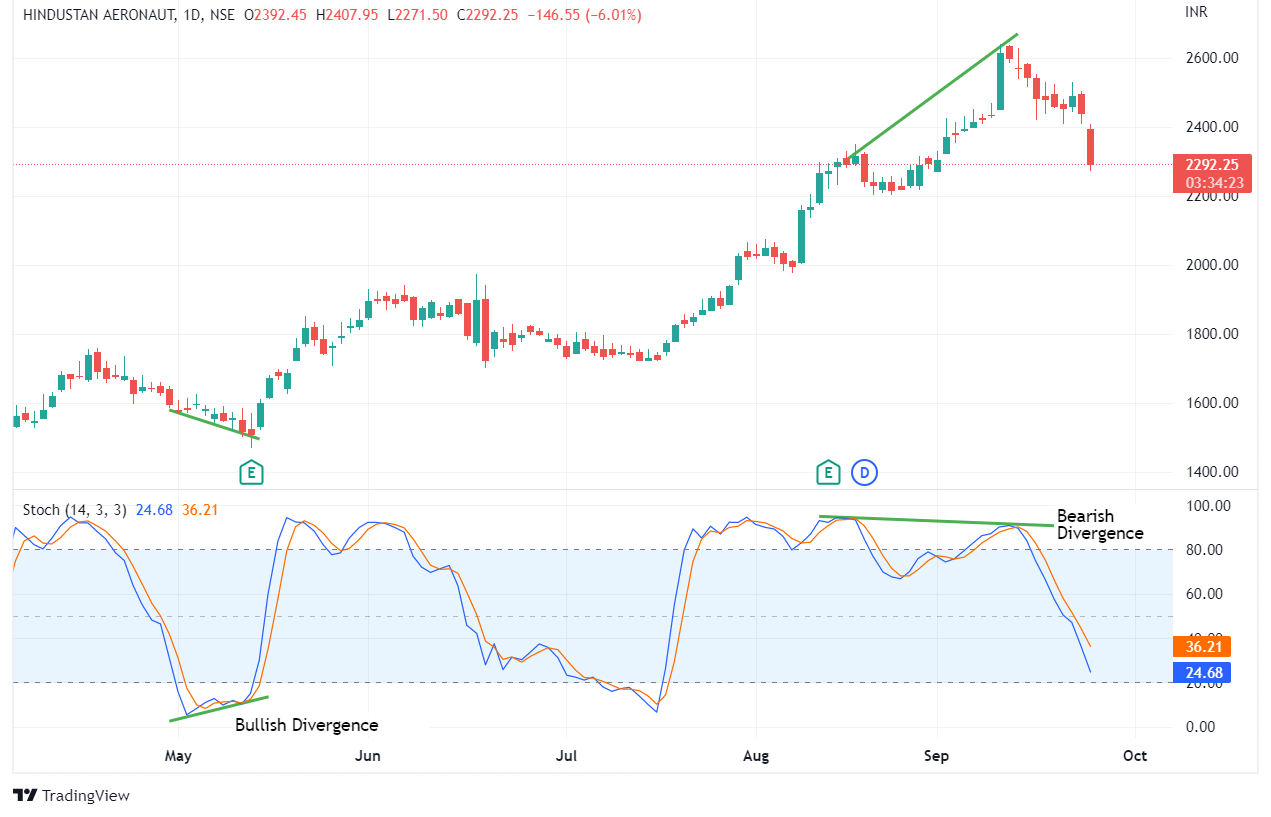
In the above example of Hindustan Aeronaut, we have used the Full Slow Stochastic Oscillator (14,3,3), where we can see how both bullish and bearish divergences on the indicator foretold of trend reversals in price.

However, one should keep in mind that divergences appear due to slowing momentum and don’t necessarily indicate a trend reversal. Hence, one should wait for a trendline break on the price chart, as shown above, to take more confirmed entries.

2. RSI Trading Strategy

This Stochastic and RSI trading system consists of three components: a 200-period EMA, a 3-period RSI with 80 as overbought and 20 as oversold levels, and a Stochastic Oscillator (6,3,3) with 70 as overbought and 30 as oversold levels.

3 Trading Strategies using Stochastics Technical Indicator 3

Look for long entries only when prices are trading above the 200-period EMA. Wait for the RSI(3) to fall below 20 and the Stochastic to cross above the 30 oversold levels. Then, go long on the next open bar. When the RSI(3) falls below 50 from above, exit the position.

Wait for the RSI to rise above 80 and the Stochastic to cross below the 70 overbought levels. Then, go short on the next open bar. When the RSI(3) crosses above 50 from below, exit the position.

3. MACD Trading Strategy

We use the default MACD(12,26,9) and Fast Stochastic in this MACD Stochastic combination strategy (5,3,3).

We only consider long entries when the MACD value is above the zero line, and the Fast Stochastic (5,3,3) falls below 20 and then rises above it. When the Stochastic Oscillator falls below 50 from above, it is time to exit the position.

3 Trading Strategies using Stochastics Technical Indicator 4

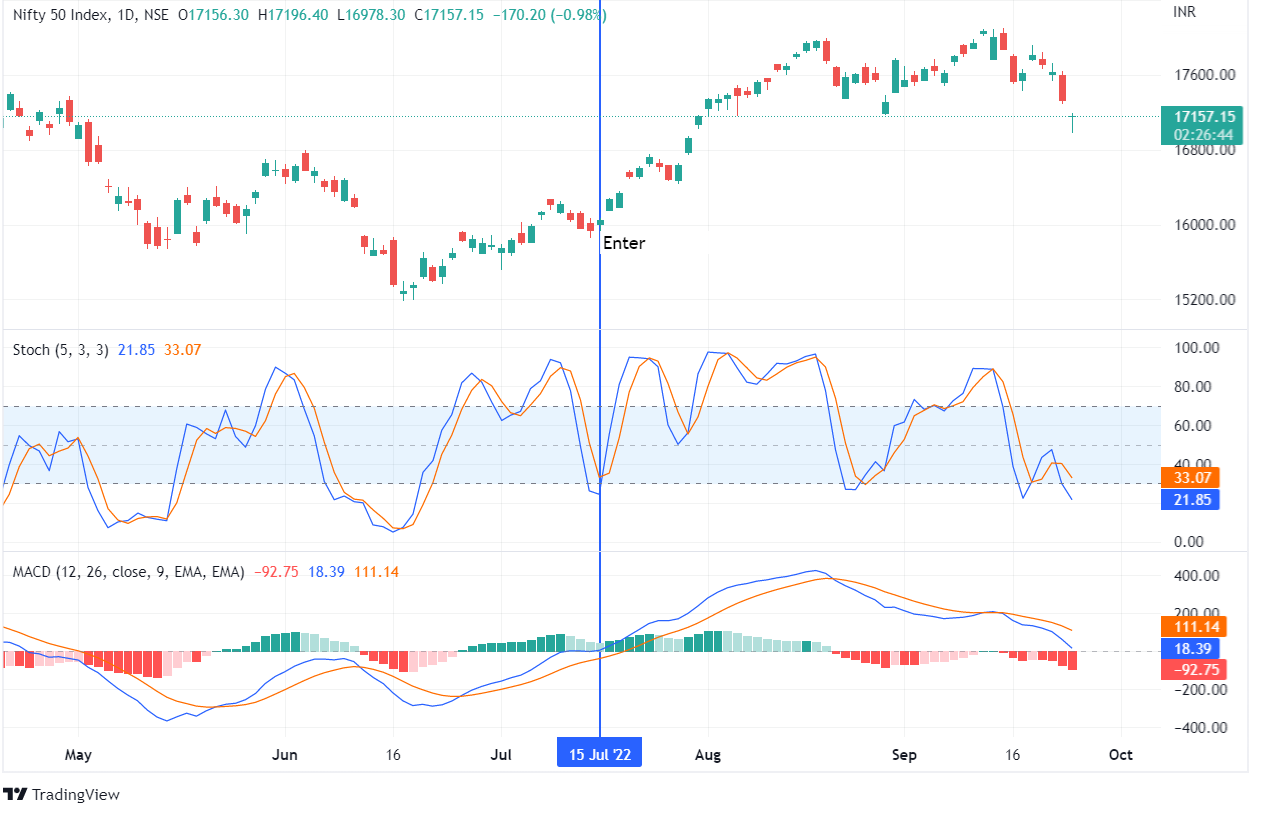
Similarly, we only go short when the MACD value is below zero, and the Fast Stochastic(5,3,3) becomes overbought above 80 and then falls below it. When the Stochastic Oscillator rises above 50 from below, one can exit the position.

You can also join our course on Certification In Online Technical Analysis

Stochastics Scans in StockEdge

You can also use Stochastics scans available in StockEdge that help us to filter out stocks based on specific criteria, as shown below:

3 Trading Strategies using Stochastics Technical Indicator 5

Bottomline

In conclusion, traders can gain important insights into market momentum and possible reversal points by using the Stochastics Technical Indicator. Using three different strategies—crossovers, divergence, and overbought/oversold levels—traders can more accurately manage tumultuous markets. Integrating Stochastics can improve trading results and reduce risks with careful research and flexibility.

Frequently Asked Questions (FAQs)

What is Stochastics?

A technical analysis indicator called stochastics is used to gauge a security’s momentum. It does this by comparing the closing price of a securities to its range of prices over a given time period, usually 14 periods.

How does Stochastics work?

Stochastics fluctuate between 0 and 100, signifying oversold circumstances below 20 and overbought circumstances beyond 80. It aids traders in spotting possible continuation patterns or trend reversals.

What are the main components of Stochastics?

The lines with %K and %D are stochastics. %D is a moving average of %K, and %K is the current closing price in relation to the high-low range.

Tags: basicenglishstochastictechnical analysis
ShareTweetSend
Get Kotak Offer Get Kotak Offer Get Kotak Offer
Previous Post

Tips for Successful Binary Options Trading

Next Post

3 Trading Strategies using Central Pivot Range (CPR)

Elearnmarkets

Elearnmarkets

Elearnmarkets (ELM) is a complete financial market portal where the market experts have taken the onus to spread financial education. ELM constantly experiments with new education methodologies and technologies to make financial education effective, affordable and accessible to all. You can connect with us on Twitter @elearnmarkets.

Related Posts

Understand Slippage in Trading
Technical Analysis

What is Slippage in Trading? Meaning & Examples

March 28, 2025
297
Breakout trading strategies
Technical Analysis

Top 5 Breakout Trading Strategies

March 12, 2025
1.1k
5 stocks for today
Technical Analysis

5 Stocks to Buy Today That Could Beat the NIFTY in 2025!

May 5, 2025
398
Image describing What is marginal trading facility
Technical Analysis

 What is a Margin Trading Facility? Advantages & Risks

April 4, 2025
661

Leave a Reply Cancel reply

Your email address will not be published. Required fields are marked *

Disclaimer

Elearnmarkets (Kredent InfoEdge Pvt. Ltd.) is a SEBI-registered Research Analyst (RA) entity (SEBI Registration No.: INH300007493). The information provided in this article is for educational and informational purposes only and should not be considered as an offer to buy or sell any securities or investment products.

The stocks, securities, and investment instruments mentioned herein are not recommendations under SEBI (Research Analysts) Regulations, 2014. Readers are advised to conduct their own due diligence and seek independent financial advice before making any investment decisions.

Investments in securities markets are subject to market risks. Please read all related documents carefully before investing. Investing in Equity Shares,
Derivatives, Mutual Funds, or other instruments carry inherent risks, including potential loss of capital. Elearnmarkets (Kredent InfoEdge Pvt. Ltd.) does not provide any guarantee or assurance of returns on any investments. Past performance is not indicative of future performance.

Elearnmarkets Logo

Follow Us

Facebook-f X-twitter Instagram Linkedin-in Youtube Telegram

Register on Elearnmarkets

Continue your financial learning by creating your own account on Elearnmarkets.com

Register Free Account

Download App

Playstore logo
Download on app store

Categories

  • Basic Finance
  • Derivatives
  • Financial Planning
  • Fundamental Analysis
  • Technical Analysis
  • Mutual Funds
  • Miscellaneous

Popular On Elearnmarkets

  • Market Superheroes:
  • Vivek Bajaj
  • Chetan Panchamia
  • Ashish Kyal
  • Premal Parekh
  • Abhijit Paul
  • Jegan
  • Sivakumar Jayachadran
  • Jyoti Budhia
  • Vivek Gadodia
  • Vishal Mehta
  • Piyush Chaudhry
  • Santosh Pasi
  • Gomathi Shankar
  • Market Superheroes:
  • Vivek Bajaj
  • Chetan Panchamia
  • Ashish Kyal
  • Premal Parekh
  • Abhijit Paul
  • Jegan
  • Sivakumar Jayachadran
  • Jyoti Budhia
  • Vivek Gadodia
  • Vishal Mehta
  • Piyush Chaudhry
  • Santosh Pasi
  • Gomathi Shankar
  • Courses:​
  • Options Trading
  • Dow Theory
  • Momentum Trading
  • Stock Investing
  • Harmonic Chart Patterns
  • Algo Trading
  • Elliot Wave Theory
  • Advanced Excel
  • Cryptocurrency
  • NSE Certification Course
  • Courses:​
  • Options Trading
  • Dow Theory
  • Momentum Trading
  • Stock Investing
  • Harmonic Chart Patterns
  • Algo Trading
  • Elliot Wave Theory
  • Advanced Excel
  • Cryptocurrency
  • NSE Certification Course
  • Webinars:
  • Bank Nifty Scalping
  • Intraday Trading Strategies
  • Options Trading Strategies
  • Options selling
  • Price Action
  • Relative Strength
  • Tax Planning
  • Options Buying
  • Growth Stocks
  • Portfolio Management
  • Risk Management
  • Renko Charts
  • Crude Oil
  • Traders Psychology
  • Moving Average
  • Multibagger Stocks
  • Free Learning Modules:
  • Intraday Trading
  • Options Scalping
  • Swing Trading
  • Financial Modelling
  • RSI Indicator
  • Bollinger Bands
  • Pricing of Futures
  • Personal Finance
  • Initial Public Offerings (IPO)
  • Value Investing
  • Technical Indicators
  • Candlesticks
  • Chart Patterns
  • Option Greeks
  • ELSS Funds
  • Banking and Insurance
  • Real Estate
  • Gold
  • Book Summaries:
  • Rich Dad Poor Dad
  • Psychology of Money
  • The Intelligent Investor
  • The Richest Man in Babylon
  • Think and Trade Like a Champion
  • Value Investing and Behavioural Finance
  • Trading in the Zone
  • Learn to Earn
  • Book Summaries:
  • Rich Dad Poor Dad
  • Psychology of Money
  • The Intelligent Investor
  • The Richest Man in Babylon
  • Think and Trade Like a Champion
  • Value Investing and Behavioural Finance
  • Trading in the Zone
  • Learn to Earn
  • Tools:
  • CAGR Calculator
  • SIP Calculator
  • eLearnOptions
  • Future Value Calculator
  • Present Value Calculator
  • Atal Pension Yojana
  • Cost of Delay Calculator
  • Become a Crorepati
  • Tools:
  • CAGR Calculator
  • SIP Calculator
  • eLearnOptions
  • Future Value Calculator
  • Present Value Calculator
  • Atal Pension Yojana
  • Cost of Delay Calculator
  • Become a Crorepati

© 2025 Elearnmarkets. All Rights Reserved

  • Visit Elearnmarkets
  • Courses
  • Webinars
  • Financial Guides
  • Get Free Counselling
  • Visit Elearnmarkets
  • Courses
  • Webinars
  • Financial Guides
  • Get Free Counselling

Download Our App

No Result
View All Result
  • Article Categories
    • Basic Finance
    • Derivatives
    • Financial Planning
    • Fundamental Analysis
    • Technical Analysis
    • ETFs & Mutual Funds
    • Marketshala
    • Miscellaneous
  • Language
    • Hindi
    • Bengali
    • English
  • Courses
  • Webinars
  • Stories
Get Free Course

© 2024 Elearnmarkets All Rights Reserved

A Handbook of Technical Analysis
To start your trading journey as a seasoned technical analyst
Download Guide For FREE
Trading Day 2025