
Central Pivot Range (CPR) is a well-known intraday indicator used by technical analysts daily.
Trading chart analysis is one of the most important aspects of any trade. Numerous methods and indicators are available for technical analysis, including the Central Pivotal Range.
For a long time, pivot points have been an effective trading indicator; however, one type of pivot point currently popular among traders is the central pivot range or CPR indicator.
Let us discuss more about this indicator and some trading strategies using this Indicator:
What is Central Pivot Range (CPR) indicator?
The Central Pivot Range (CPR) indicator is used to identify trade price-level pivot points. Traders can place trades based on the chart’s various levels. It is very popular among traders due to its versatility and simplicity.
It is very popular among traders because it is versatile and easy to understand. The CPR indicator has three levels, which are indicated on the chart. These levels are known as pivot points, with the top central pivot point being the highest and the bottom central pivot point being the lowest.

To comprehend the CPR indicator, two fundamental concepts must be grasped. These are trading charts, candlestick patterns, and support and resistance levels. The former is used to identify critical price level breakout points. Support and resistance help traders identify the lowest and highest price levels that a stock can reach. It protects and limits the trader’s potential losses.
Calculation of CPR
The CPR indicator charts three price levels based on fixed formulae. The trader must use the previous trading day’s highest, lowest, and closing levels of the stock for this.
Using the previous day’s required levels for the next schedule is to comprehend and forecast the stock’s price movement based on the previous day’s performance.
The three levels of the CPR indicator and the formula for calculating them are listed below.
- Pivot point = (High + Low + Close) / 3
- Top Central Pivot Point (BC) = (Pivot – BC) + Pivot
- Bottom Central Pivot Point (TC) = (High + Low) / 2

Trading with CPR
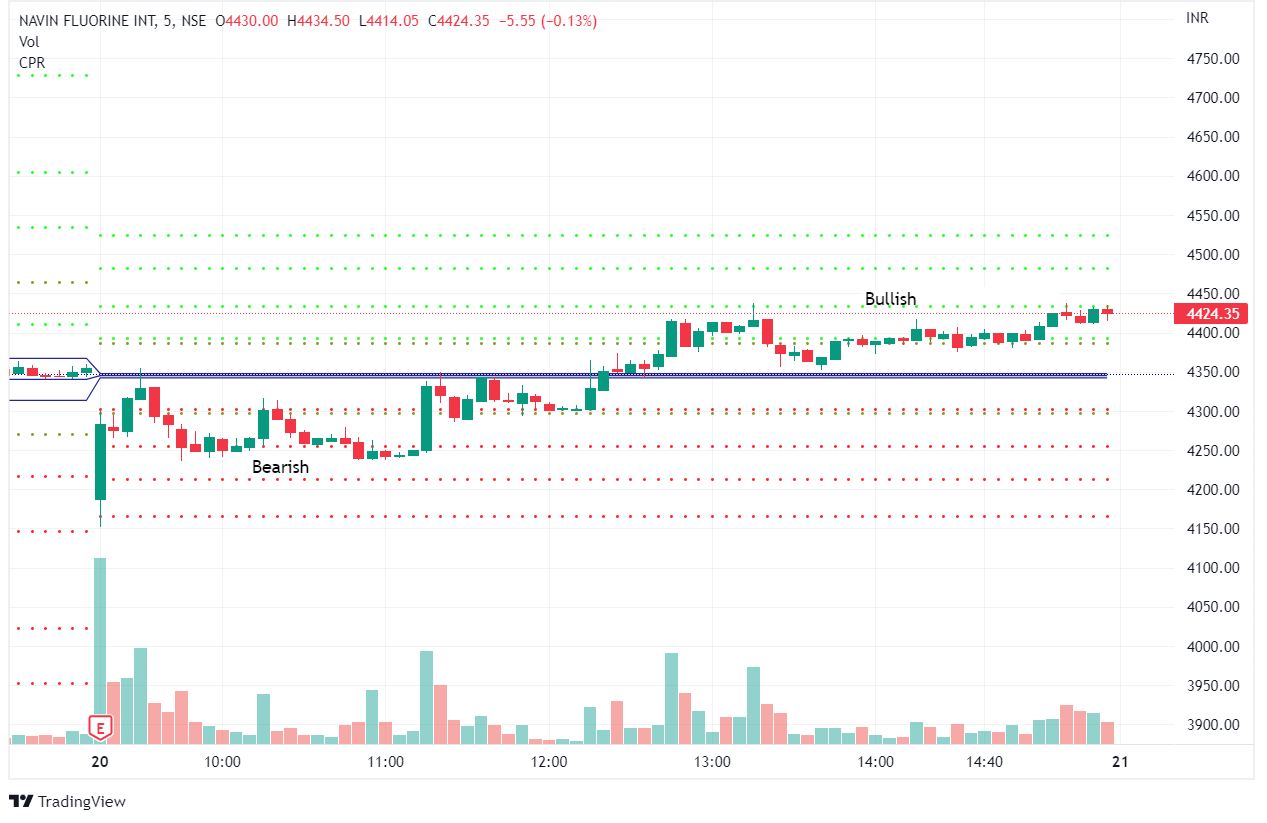
When the stock has a bullish outlook, that is, when the market price of the stock remains higher than the TC level in CPR, a trader can enter the market. In this case, the trader must look for buying opportunities, and the TC level serves as a support line.
Similarly, the trader must pursue selling opportunities when the current market price falls below the BC.
CPR gives traders the necessary advantage of predicting the trend in order to make a profitable move. When the stock price remains within the central pivotal range, trading is also possible. However, traders rarely use this. Traders can keep the TC as their goal and buy options at BC.
You can also join our course on Intraday Price Action Trading Using CPR
Trading Strategies
Below are some trading strategies that can be used when trading with this intraday indicator:
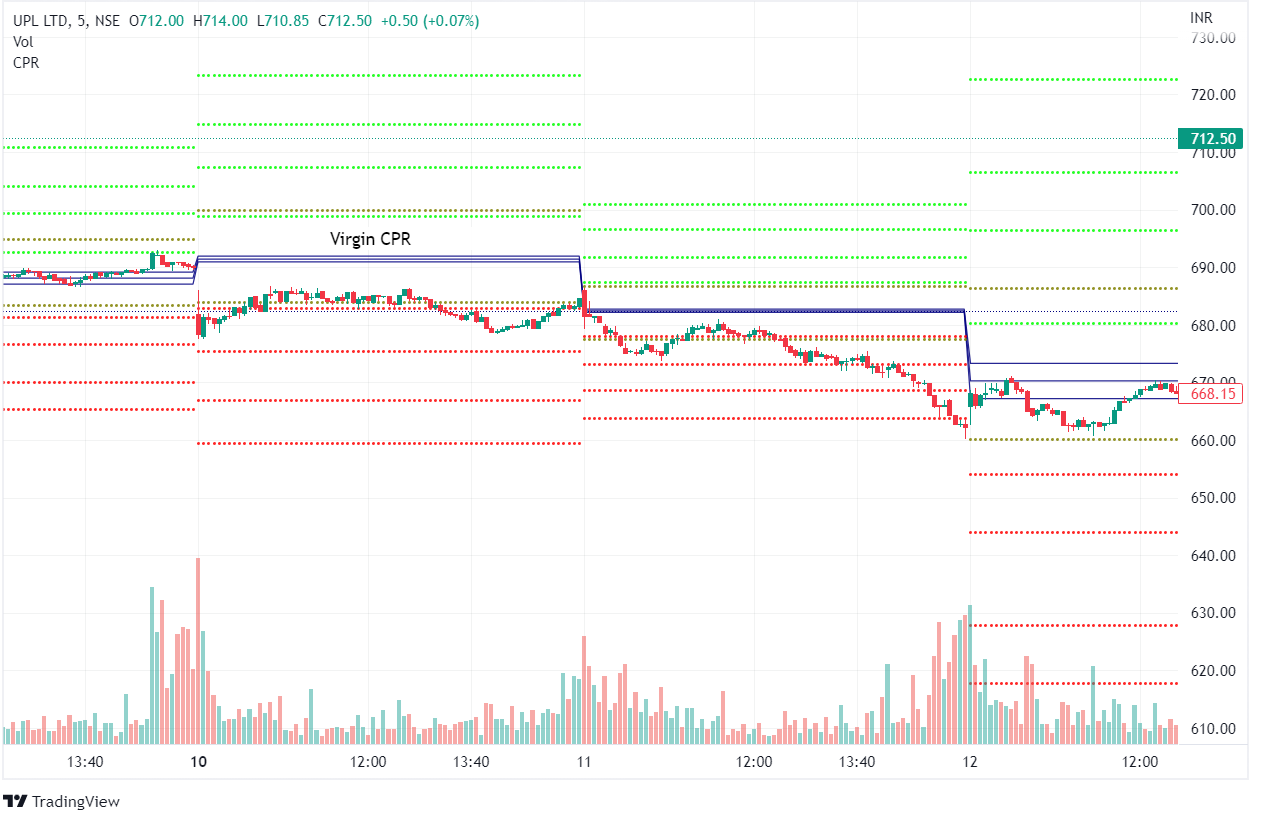
1. Virgin CPR
A virgin CPR occurs when the stock price does not cross the CPR lines. It is commonly observed that if the price of a stock fails to touch the range the previous day, the stock’s price has a 40% chance of failing to break the CPR range. It is important to note that, depending on the current market situation, a virgin CPR can be strong support or resistance.
2. Prices trading above or below CPR levels
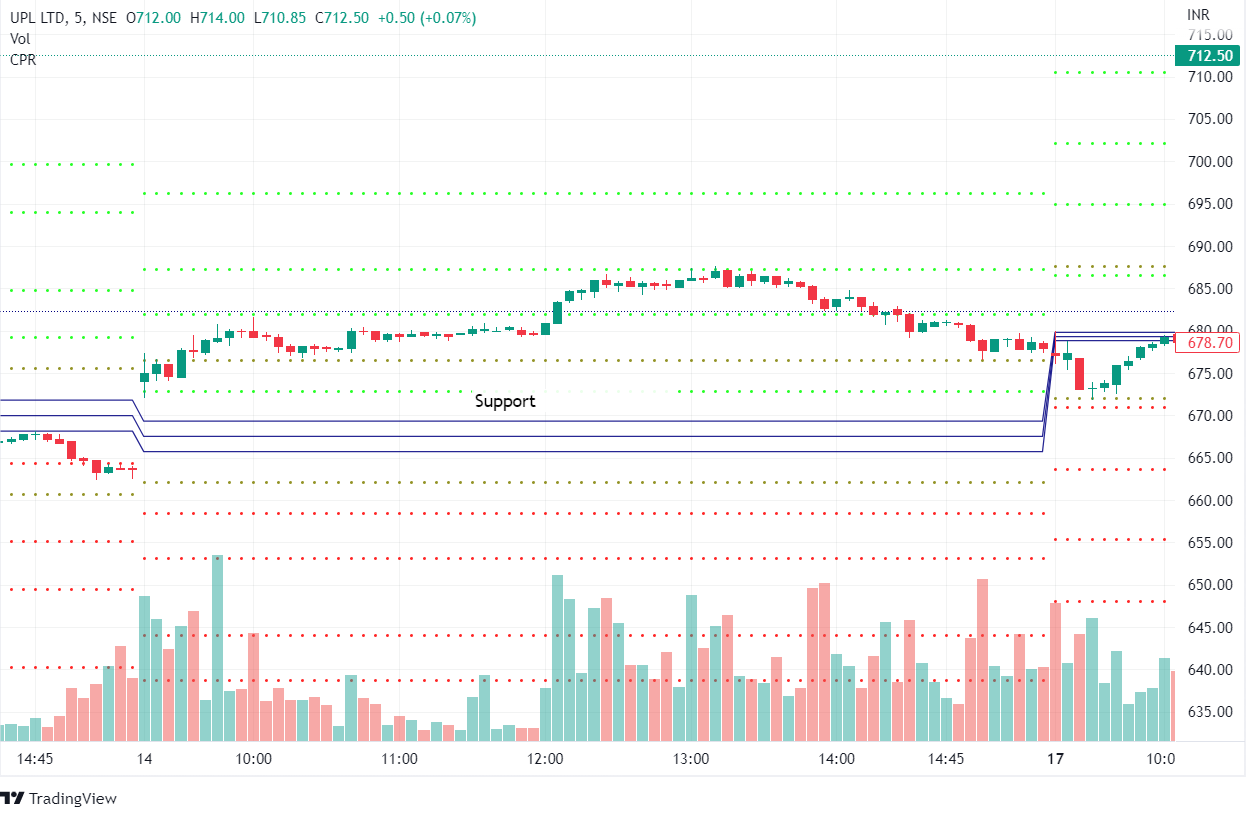
A higher current price than the Top Central Pivot Point (TC) indicates a buying trend in which traders are willing to purchase the stock even if the average price is higher. In such a case, the CPR will provide support.
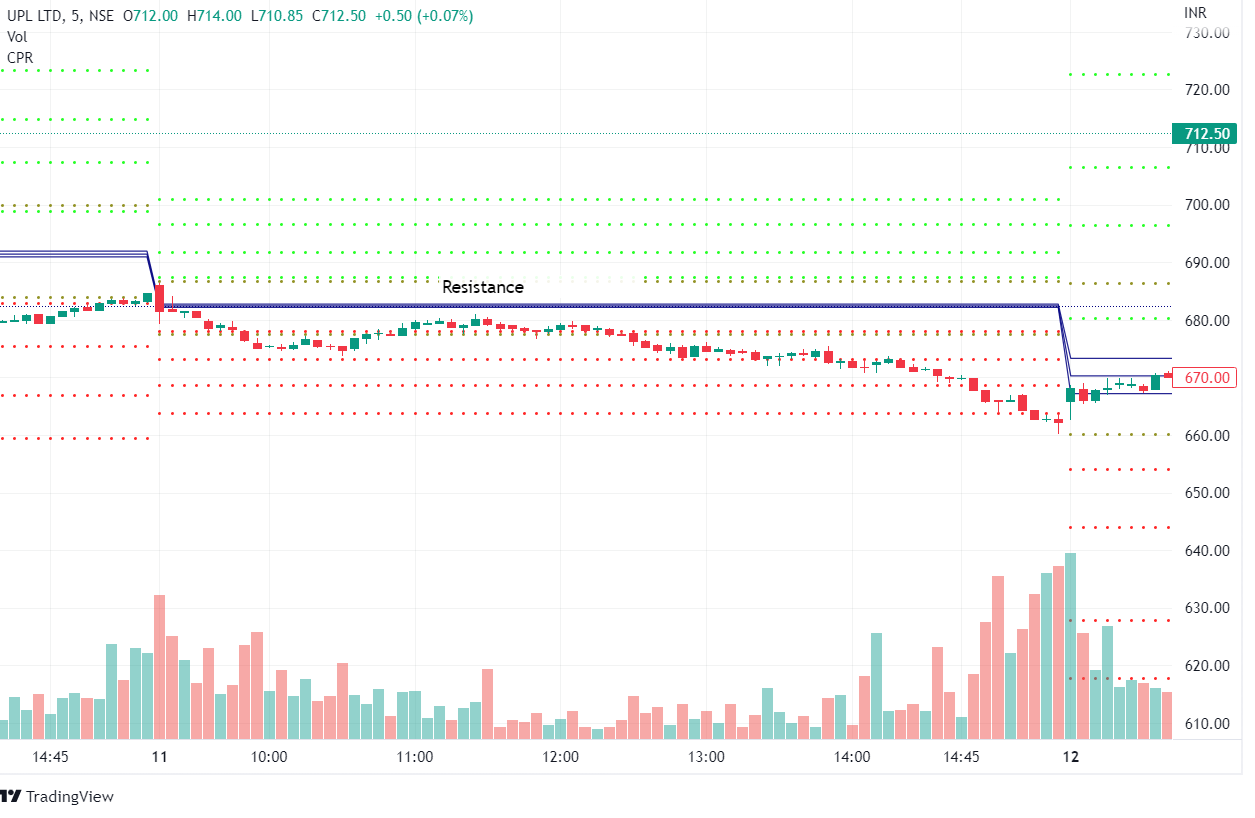
A seller’s market exists when the current price is lower than the Bottom Central Pivot Point (BC). It suggests a bearish market with numerous selling opportunities. CPR will also act as resistance in this situation.
Watch our webinar on “CPR Saves Trades” – A Multi-timeframe Approach
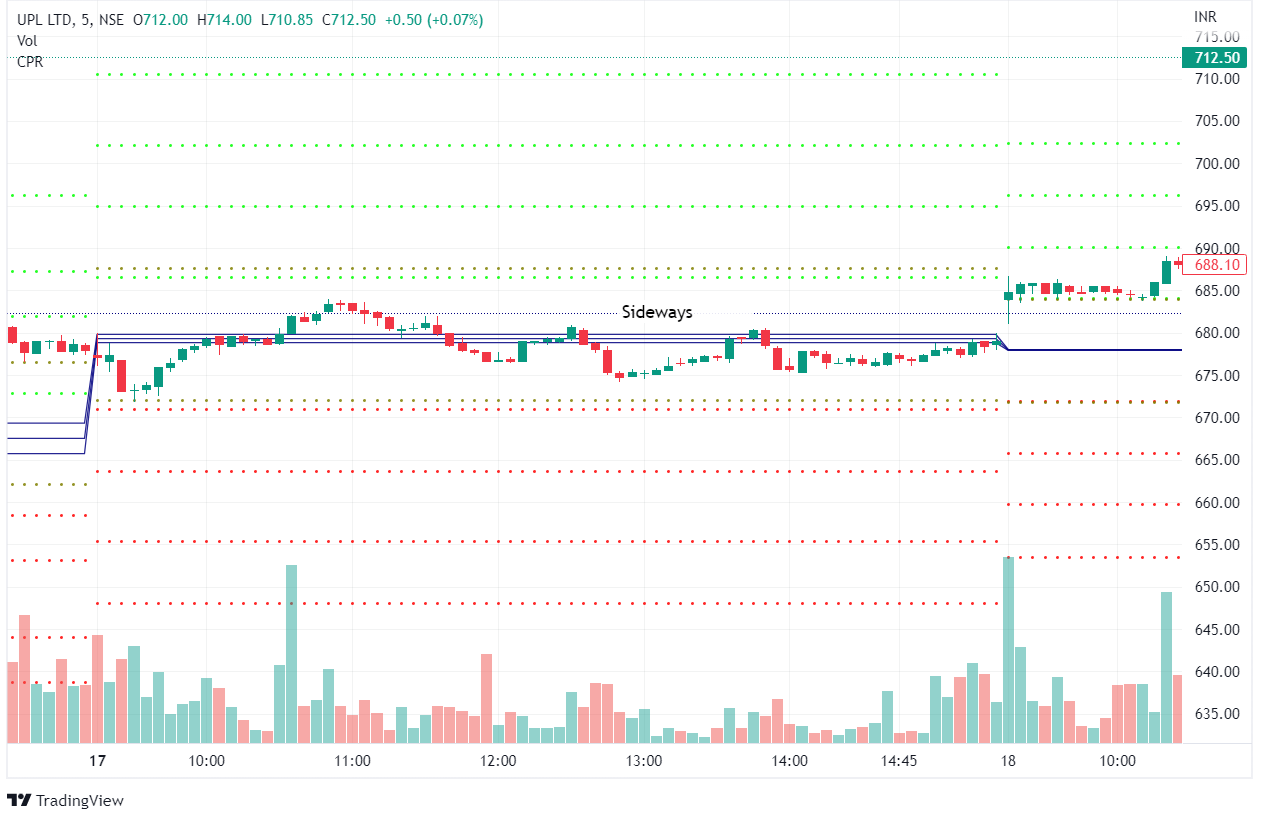
3. Prices trading within CPR lines
When the current price is trading between the CPR lines, it indicates that the market is in an accumulation phase and moving sideways. Traders can use the volume to wait for a CPR breakout above the TC. In the event of a wide CPR, another option is to buy at the bottom central pivot point (BC) while keeping the target top central pivot point (TC) in mind.
Watch our Face2Face video on Profitable Options Trading using CPR Pivot System
Bottomline
CPR indicators can be used to identify market bullish and bearish trends and take appropriate trading positions. When the stock is trading above the TC, it is a strong indicator of a bullish trend. If the stock price is consistently lower than the BC line, it is a strong indicator of a bearish trend.

Another critical aspect to consider when trading is the use of stop losses. This is especially important for new traders because it limits their potential losses or allows them to exit the markets with the bare minimum of guaranteed profits.
We hope you found this blog informative and use it to its maximum potential in the practical world. Also, show some love by sharing this blog with your family and friends and helping us in our mission of spreading financial literacy.
Happy Investing!


