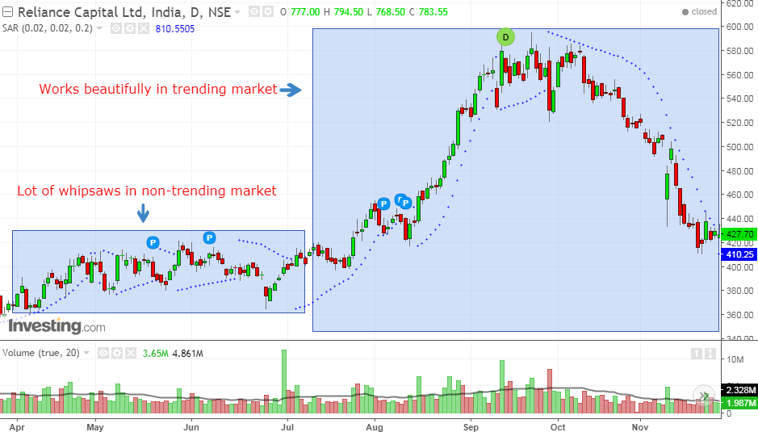
Parabolic SAR is a price and time based technical analysis tool which works very well in the trending market and also identifies potential reversal and stops.
It is plotted on the price chart which appears as a dot just above or below the candlesticks or bars.
When the price is in a bearish trend, you will notice that the Parabolic SAR dots appear above the price. On the other hand, during an uptrend, you will see the dots appear below the price.
| Table of Contents |
|---|
| Interpretation of Parabolic SAR |
| Trading strategy using Parabolic SAR and RSI |
| Bottomline |
Interpretation
Parabolic SAR is a good trend following indicator which strictly follows price.
SAR usually works like a trailing stop loss on the price chart.
In an uptrend, the SAR dots remains below the price and rises as long as the uptrend remains in place.

Once price stops going up and reverses below the SAR dots, it marks the beginning of a downtrend. Basically, in a downtrend, the SAR dots continue to remain above the price.
Some of the traders even put their stop-loss based on SAR dots.
Trading strategy using Parabolic SAR and RSI
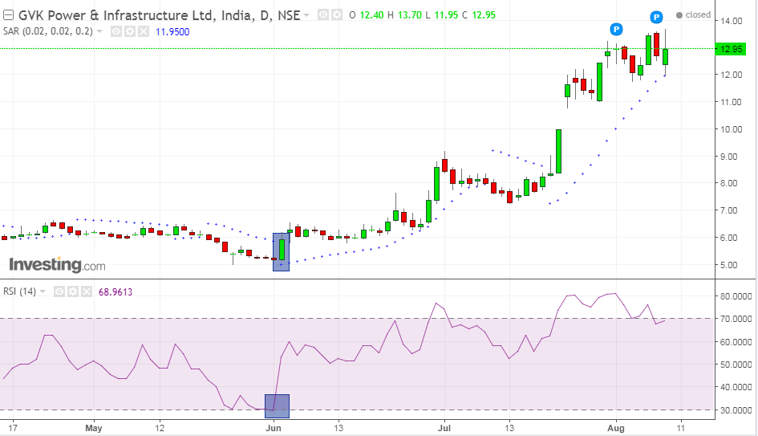
A buy signal is generated when RSI cuts 30 level from below and the first dot of Parabolic SAR comes below the price.
Learn to make best use of RSI Indicator trading strategy in 2 HRS.
The chart below is of GVK Power and Infra and as you can see in the chart that in the first week of June when the first dot of Parabolic SAR appeared below the price and simultaneously RSI also 30 level from below, a buy signal was generated.
After the signal, the stock gave a very rapid move on the upside.

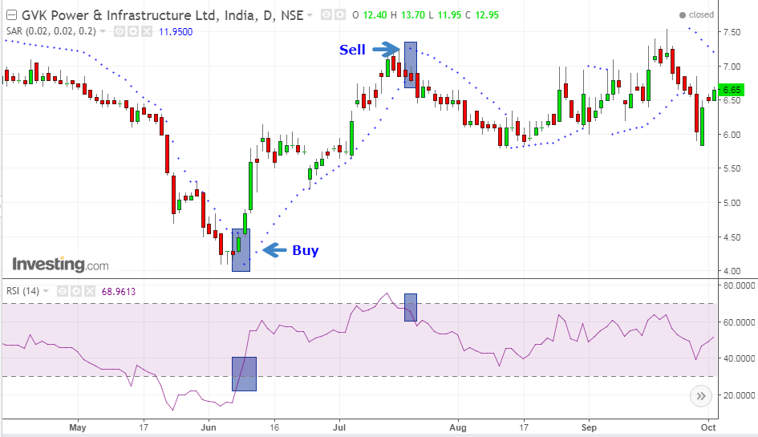
A sell signal is generated when RSI cuts 70 level from above and the first dot of Parabolic SAR comes above the price.
You may also see the video below to understand various scans using Stockedge app.
The chart below shows that when the first SAR dot came above the price and simultaneously the RSI also cut 70 from above, it generated a sell signal. The stock gave a good correction after the sell signal was generated.

Bottomline
The SAR works wonderfully with the trending securities, which according to Welles Wilder occurs about 30% of the time.
Thus you will witness a lot of whipsaws when the security is a non-trending mode.
Also Read – Parabolic SAR – Calculation, Indicators & Use
Like other indicators, the signal quality will also depend upon the characteristics of the underlying security.
It should also be used in conjunction with other indicators and technical analysis techniques to generate better trading signals.


good tool
Hello Jugal,
Thank you for your comment.
If you want to learn technical analysis from scratch you can enroll in: NSE Academy Certified Technical Analysis course on Elearnmarkets.
Happy Learning!!
Great info, thanks for sharing this!
Hi,
Thank you for Reading!
Keep Reading
EXCELLENT COMBINATION. TRADING IS EASY.
Hi,
We really appreciated that you liked our blog.
Keep Reading!