Key Takeaways
- Fundamental Analysis helps assess if a stock is overvalued or undervalued using financial data.
- EPS (Earnings Per Share) shows the company’s profit per share.
- P/E Ratio (Price to Earnings Ratio) compares share price to earnings to judge valuation.
- ROE (Return on Equity) measures how efficiently a company uses shareholders’ funds to generate profit.
- P/B Ratio (Price to Book Ratio) compares market price with the company’s book value.
- P/S Ratio (Price to Sales Ratio) helps evaluate a stock based on its revenue per share.
There are so many fundamental analysis tools present, but choosing the right one is the basis for successful investing in the stock market.
Let us explore five essential fundamental analysis tools that will help you understand a company’s financial health and make the right investment decisions.
What is Fundamental Analysis?
Fundamental analysis examines a company’s financial health at the most fundamental level possible to assess it.
It looks at a company’s important ratios to assess if the stock is currently overpriced or undervalued.
It also forecasts the company’s growth and well-being. Fundamental analysis is essential for an investor. It facilitates his or her assessment of a company’s value. Let us discuss 5 important Fundamental Analysis Tools that every investor should look into:
Fundamental Analysis Tools
Here are some fundamental analysis tools that will help the investors in making fundamental decisions like whether to invest or not in the compares-
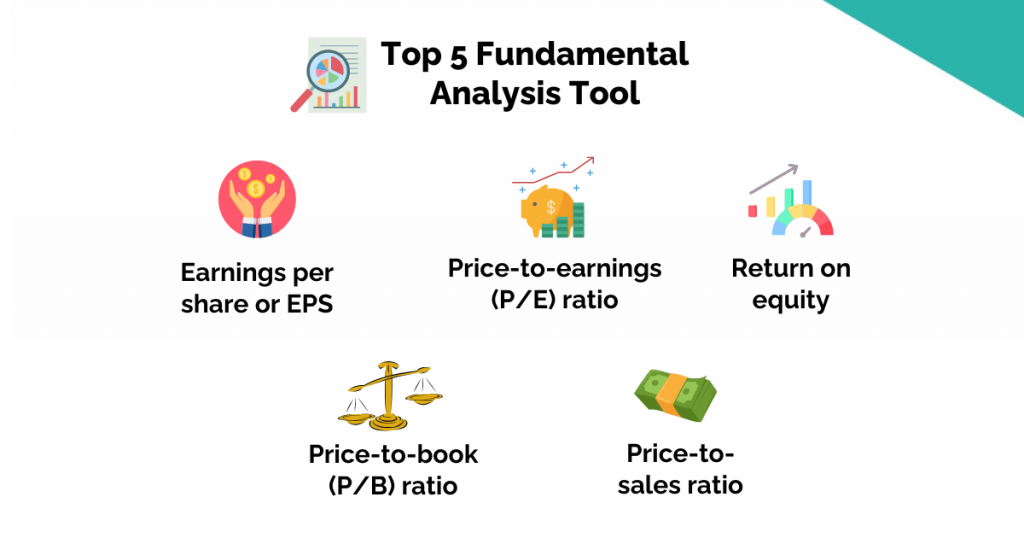
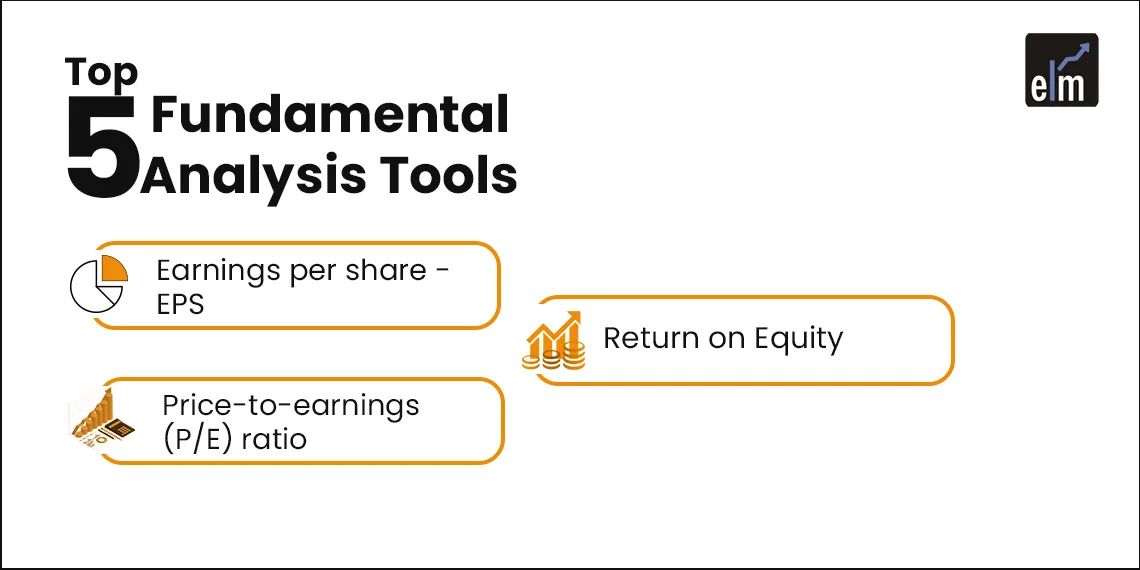
1. Earnings per share- EPS
The profit allocated to each share of the corporation is known as the earnings per share (EPS). It is computed by dividing the overall income or profit of the business by the total number of shares that are outstanding.
To choose which firm to invest in, one might analyse the earnings per share (EPS) of several companies in the same industry. To return to normal, a higher EPS could, however, either result in lower earnings or higher stock prices.
2. Price-to-earnings (P/E) Ratio
One of the key components of fundamental stock research is P/E. It shows how much the company has paid out in relation to the price of its stock. This allows you to determine whether the stock is worth the amount you paid for it.
Divide the share price by the EPS to get the P/E ratio. The P/E ratio is 10 if a corporation has a share price of Rs. 50 and an EPS of 5. Higher earnings relative to the stock price are possible when the P/E ratio is lower.
A low P/E ratio could indicate a lower share price in relation to earnings. This suggests that the stock is cheap and has room to grow in the future. With a greater P/E ratio, the situation is the opposite.
3. Return on Equity
To evaluate a company’s profitability that comes from employing its shareholders’ money, use return on equity shares.
To evaluate this statistic, divide net income/earnings/profit by investor equity shares. To maximize your returns, make sure you select businesses with a high return on equity.
4. Price-to-Book (P/B) Ratio
It contrasts the market value with the book value of stocks. It is computed by dividing the most recent closing price of the stock by the book value per share for the preceding quarter. where the cost of each asset less its total depreciation is its book value.
The P/B ratio, to put it simply, indicates how much money the company will have left over after paying down its debt and liquidating its assets. The stock is overvalued if the P/B ratio is greater than one and undervalued if it is less than one.
5. Price-to-Sales Ratio
It is the ratio of the stock price to the revenue of a business. Overvaluation is indicated by a greater P/S ratio, and undervaluation is indicated by a lower value.
Where to Find Fundamental Analysis Tools?
One can locate fundamental analysis tools on third-party services or company websites:

- Websites for companies: A company’s website may have tools for fundamental analysis.
- Tickertape: Tickertape is a third-party platform that lets users look for stocks and obtain important details about them, including holdings, predictions, and financials. Additionally, Stock Screener on Tickertape allows you to filter stocks according to your desired criteria.
- Screener: Using heatmaps or technical charts, among other visualization tools, a screener can assist traders and investors in seeing results.
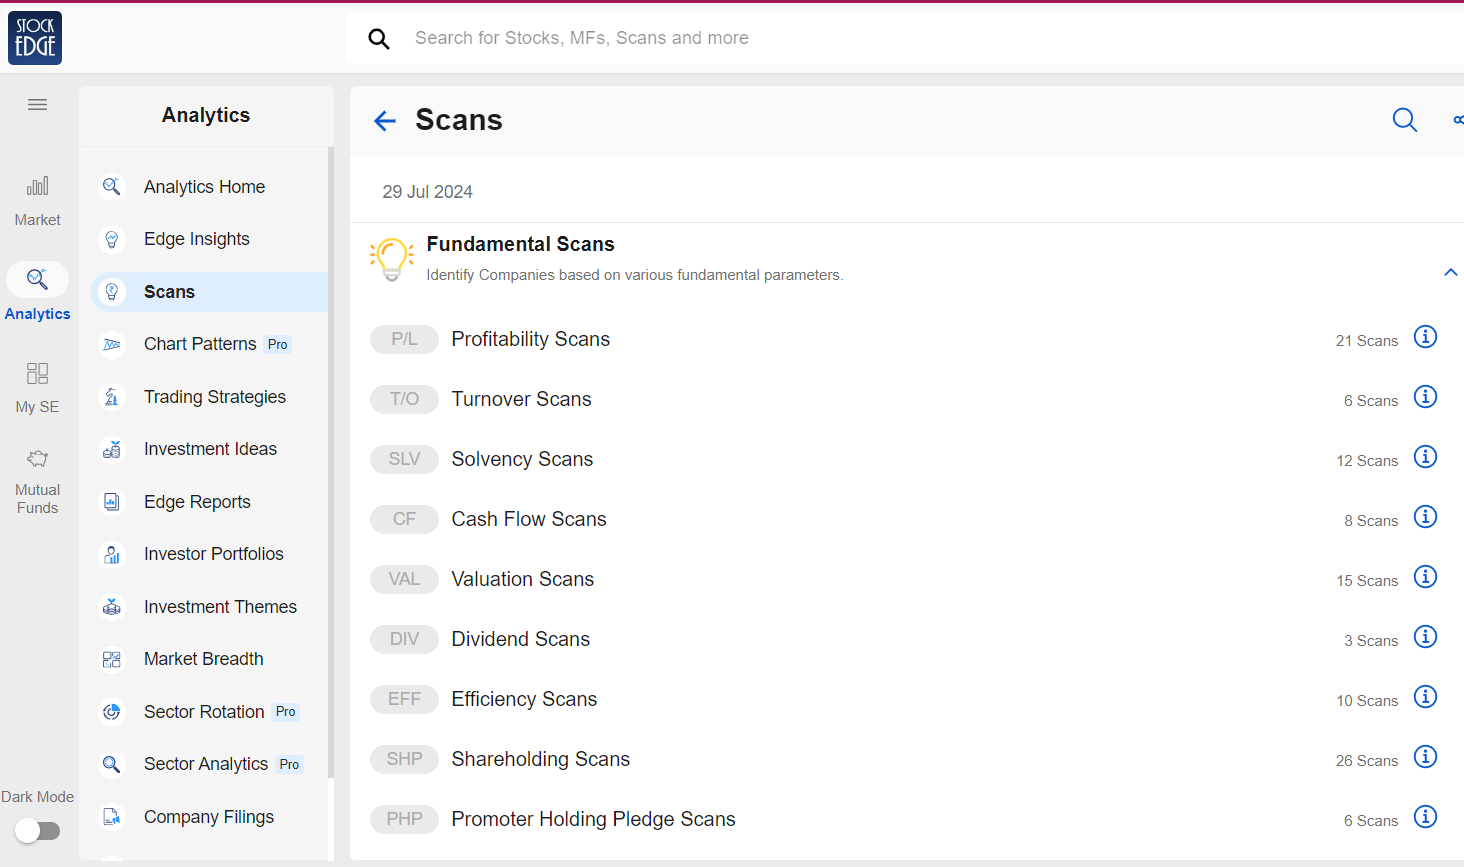
- StockEdge: StockEdge has readily available fundamental scans, that can help you to filter stocks according to the tools of financial analysis.
Conclusion
As we discussed above are the five essential tools of financial analysis that every investor should look into while investing in a company. By examining a company’s financial standing and other economic aspects, fundamental analysis assists investors in determining a stock’s actual value. It helps them determine whether a stock is fairly priced, overpriced, or too cheap so they can decide whether to purchase, hold, or sell it.
Want to build a strong investing foundation? Check out our Beginner’s Guide to Investing to get started!
Frequently Asked Questions (FAQs)
1. What are the importance of fundamental analysis tools?
Tools for fundamental analysis assist investors in assessing the performance and worth of a firm and in making defensible decisions. They can assess a company’s operations, management caliber, and financial standing in addition to assisting investors in identifying cheap or overvalued equities.
2. What are the two types of fundamental analysis?
The two most common types of fundamental analysis that you may use to ascertain a stock’s intrinsic worth and evaluate whether it is overpriced or undervalued in the market are quantitative and qualitative fundamental analysis.
3. How can I determine if a company is profitable using stock fundamentals?
The following are some components of quantitative fundamental analysis: debt-to-equity ratio, ROE ratio, P/E ratio, P/B ratio, and EPS. These are some of the few fundamental indicators that provide you with more detailed information about the stock or company.


