
John Bollinger developed Bollinger Bands, a powerful technical indicator. The bands encapsulate a stock’s price movement by providing relative highs and lows. The Bollinger Band indicator is built around a moving average, which defines the intermediate-term “trend” based on the time frame you’re looking at.
However, how do we apply this indicator to trading, and what are the winning strategies?
In this post, we’ll give you a solid understanding of the bands, as well as five trading strategies to test to see which works best for your trading style.
What are Bollinger Bands?
Bollinger Bands are a technical analysis tool for stock trading developed by John Bollinger in the 1980s. The bands are part of a volatility indicator that calculates the relative high and low of a security’s price in relation to previous trades.
Volatility is measured using standard deviation, which changes as volatility rises or falls. When the price rises, the bands widen, and when the price falls, the bands narrow. Bollinger Bands can be used to trade various securities due to their dynamic nature.
Bollinger Bands are made up of three lines: upper, middle, and lower. The middle band is a moving average, and the trader determines its parameters. The upper and lower bands are on opposite sides of the moving average band.
The trader determines how many standard deviations the volatility indicator should be set. The number of standard deviations determines the distance between the middle band and the upper and lower bands. The position of these bands indicates the trend’s strength and the potential high and low price levels that can be expected in the near future.
How to trade with Bollinger Bands?
1. Reversals
Fading stocks when they start printing outside of the bands is a simple but effective trading strategy. We’ll take it a step further and incorporate some candlestick analysis into this strategy.
For example, rather than shorting a stock as it approaches its upper band limit, wait to see how it performs. If the stock goes parabolic or gaps up and then closes near its low while trading near the outside of the bands, it is often a good indicator that the stock will correct in the near term.
Then, depending on where the stock finds support, you can enter a short position with three target exit areas: (1) the upper band, (2) the middle band, or (3) the lower band
2. Double Bottoms
A double bottom setup is a common Bollinger Band strategy.
This formation’s first bottom is characterised by high volume and a sharp price pullback that closes outside of the lower Bollinger Band. These kinds of moves usually result in what is known as an “automatic rally.” The automatic rally’s high usually serves as the first level of resistance in the base-building process before the stock moves higher.

After the rally begins, the price attempts to retest the most recent lows in order to test the strength of the buying pressure that came in at that bottom.
This retest bar should print inside the lower band, according to many Bollinger Band technicians. This indicates that the stock’s downward pressure has subsided and that there is a shift from sellers to buyers. Pay close attention to the volume as well; it should drop dramatically.
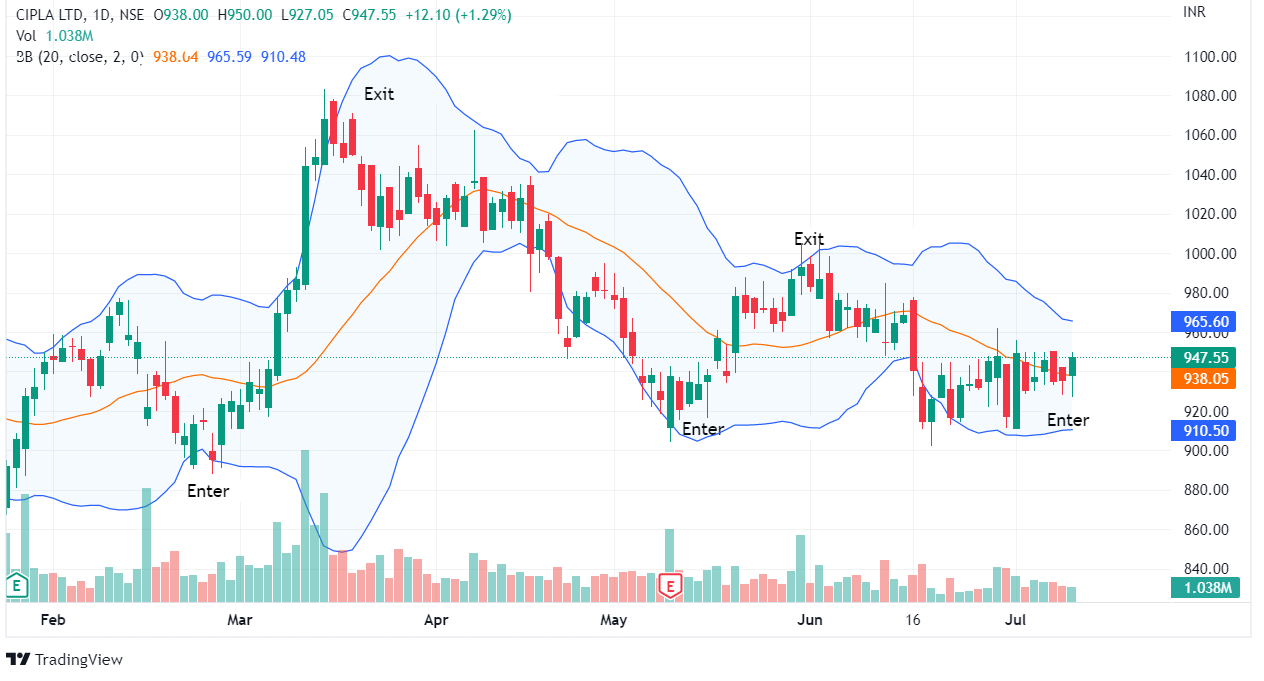
3. Riding the Bands
Many Bollinger Band newcomers make the same mistake: they sell when the price reaches the upper band and buy when it reaches the lower band. According to Bollinger, a touch of the upper or lower band does not constitute a buy or sell signal.
Look at the example below and notice how the bands tighten just before the breakout. To return to an earlier point, price penetration of the bands cannot be used to justify shorting or selling a stock.
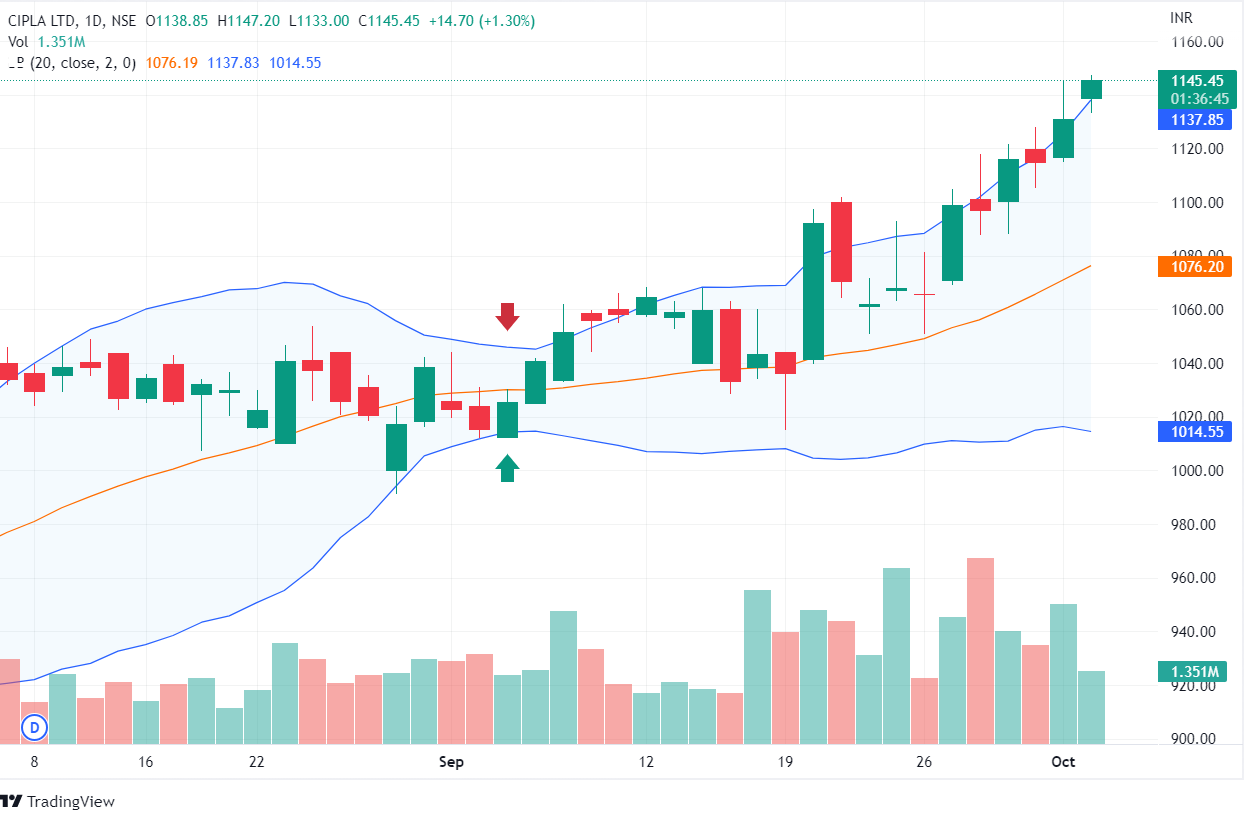
Take note of how the volume exploded on the breakout and the price began to trend outside of the bands; these can be extremely profitable setups if given enough room to fly.
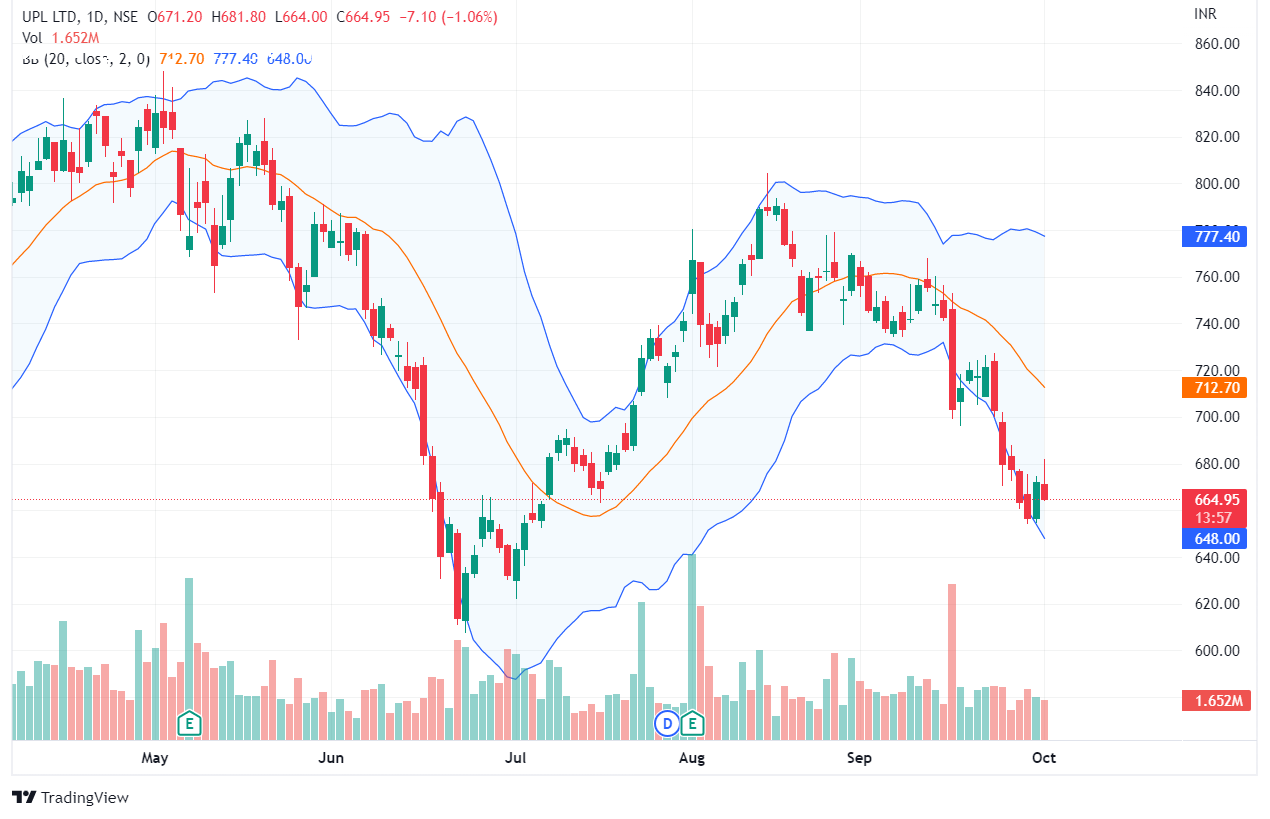
4. Bollinger Band Squeeze
Another trading strategy is to predict when a squeeze will begin. Using daily charts, the idea is that when the indicator reaches its lowest level in 6 months, volatility will rise. This relates to the tightening of the bands we mentioned earlier. The Bollinger Band indicator’s squeezing action frequently foreshadows a large move.
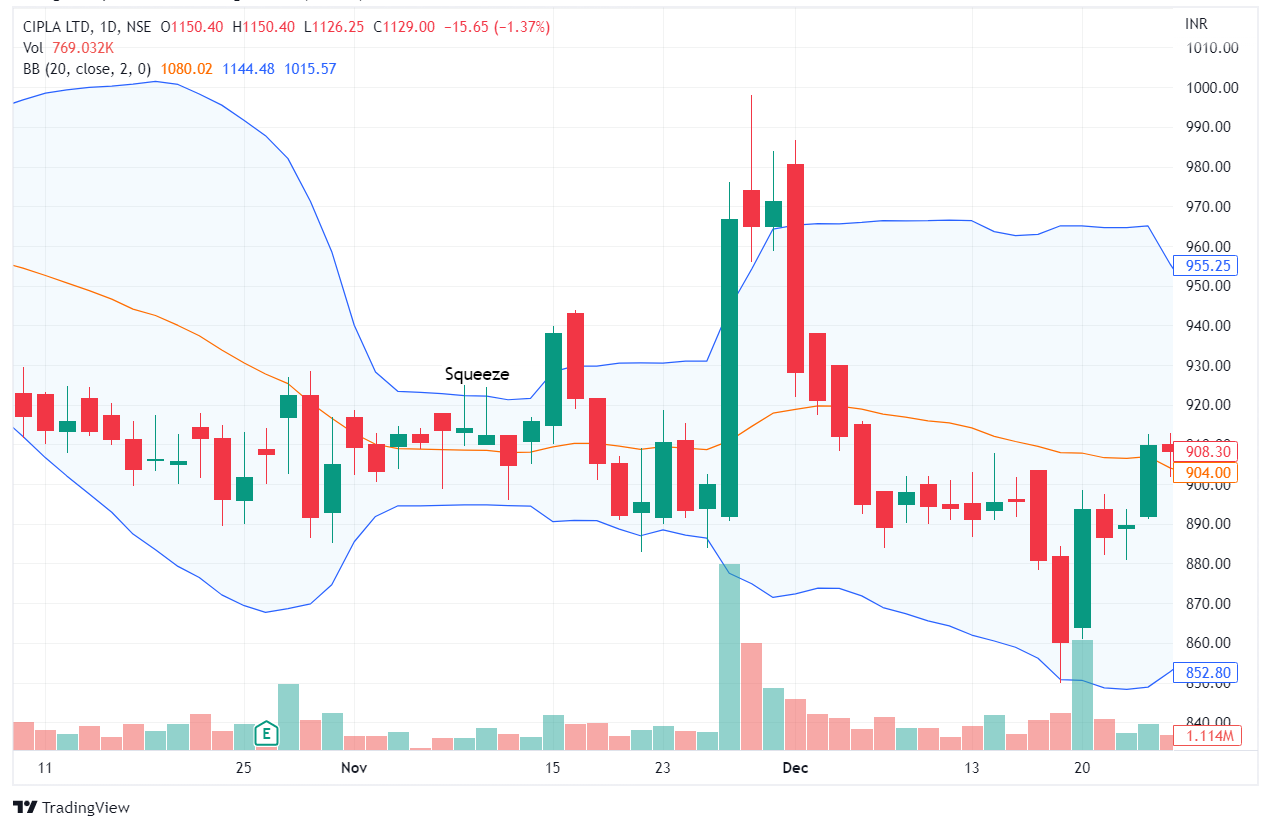
Additional indicators, such as volume expanding or the accumulation distribution indicator rising, can be used. These additional indicators add to the evidence of a possible Bollinger Band squeeze.
We need an advantage when trading a Bollinger Bands squeeze because these setups can fool even the most experienced traders.
5. Middle Bands
The middle band is configured in many charting applications as a 20-period simple moving average.
When the stock is riding the bands, the middle line can represent areas of support on pullbacks. When the price returns to the middle line, you could increase your stock position.
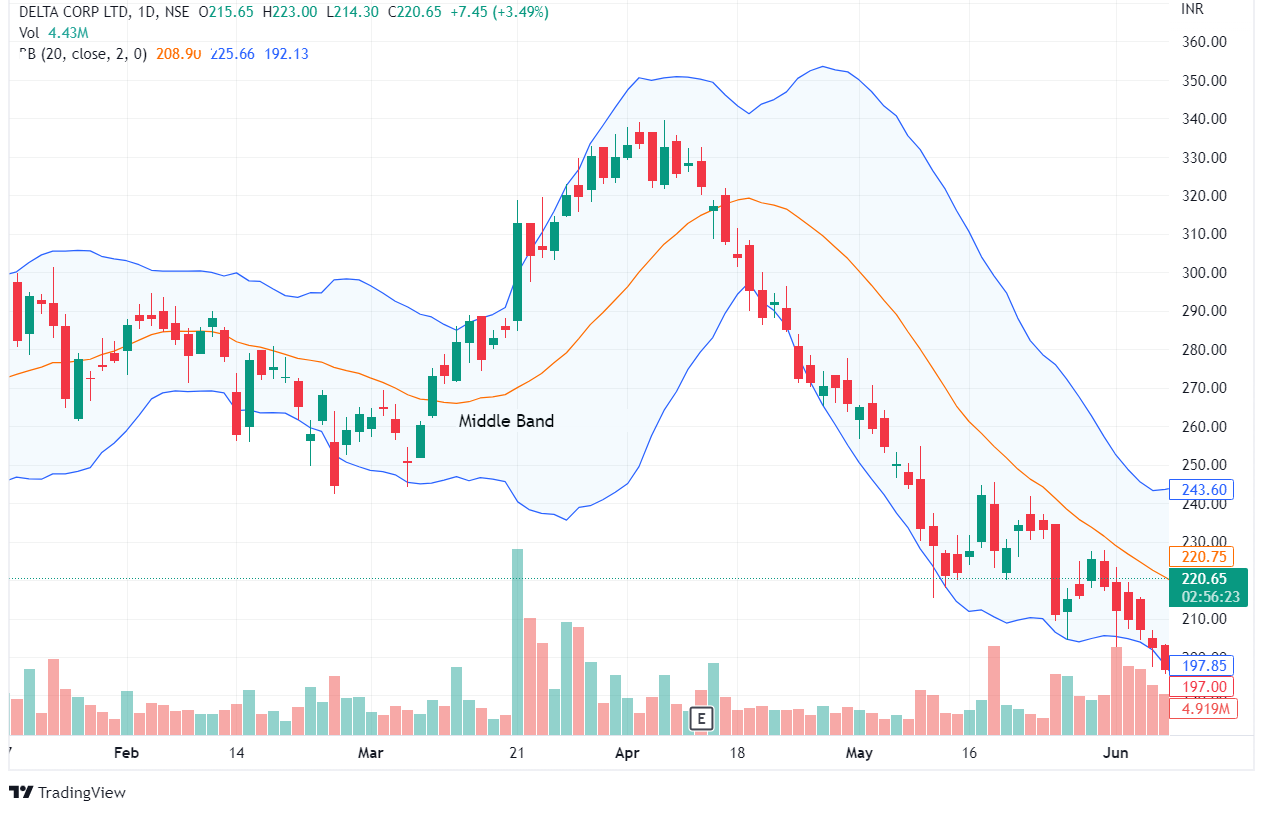
In terms of determining when a trend is losing steam, failure of the stock to continue to accelerate outside of the bands indicates a weakening in the stock’s strength. This is a good time to consider quitting or leaving a position entirely.
Bollinger Bands Strategies
1. RSI Strategy
The Bollinger Bands indicator is excellent for identifying value areas on your chart. But there’s a problem: it doesn’t tell you whether the move is strong or weak.
For example, how can you predict whether the market will continue to trade outside the outer bands or if it will mean revert?
The Relative Strength Index (RSI) indicator comes into play here. And you want to see divergence on the RSI indicator.
When the market makes a higher high, but the RSI indicator shows a lower high, this is referred to as a bearish divergence (a sign of weakness). When the market makes a lower low, but the RSI indicator shows a higher low, this is referred to as a bullish divergence (a sign of strength).
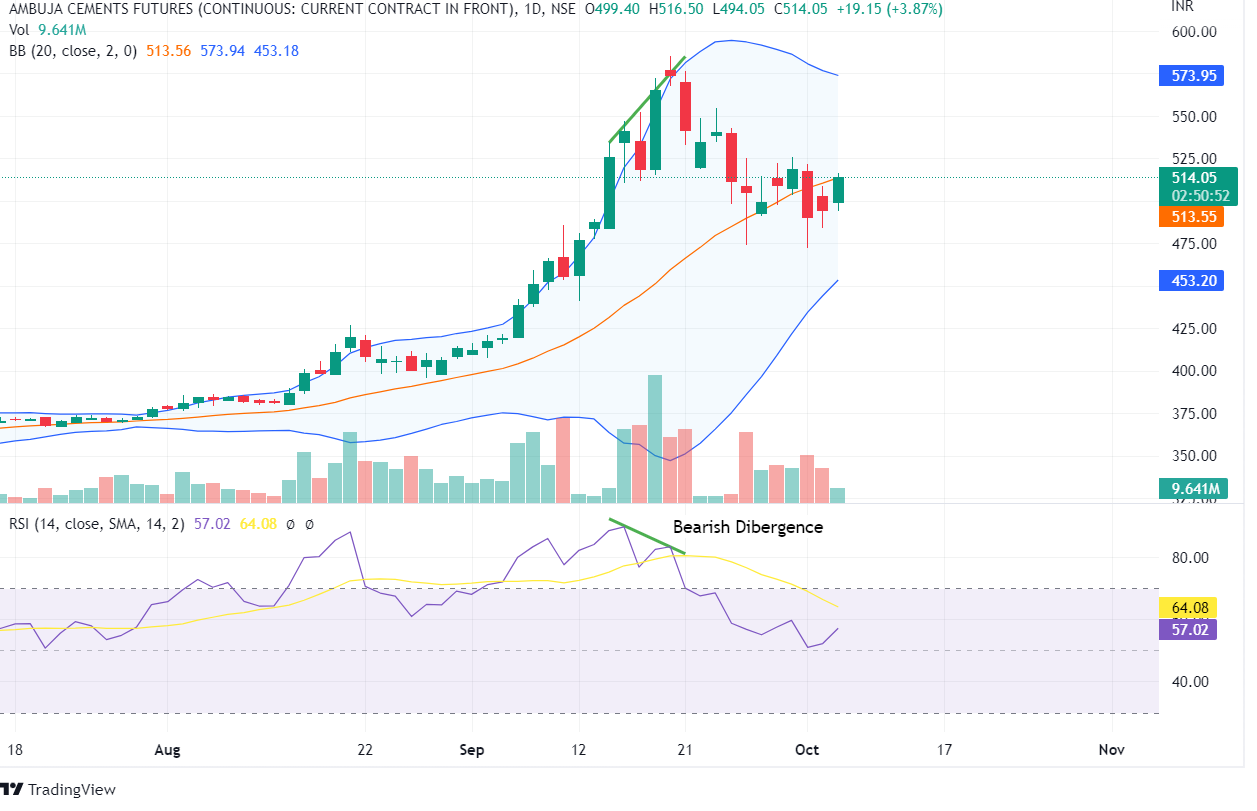
So, the question is…”How does RSI divergence interact with Bollinger Bands?
If the price is above the upper Bollinger Bands, look for a bearish RSI divergence to signal weakness in the underlying move. On the other hand If the price is trading near the lower Bollinger Bands, look for bullish RSI divergence to indicate strength in the underlying move.
2. The Options Trading Strategy
Bollinger Bands are one of the most important technical indicators for because they adjust well to volatile market conditions. This indicator can be used to identify periods of increased volatility as well as potential price changes in an asset.
In terms of volatility, Bollinger bands can show when volatility is at an all-time low in comparison to the asset’s recent history. They accomplish this by approaching each other and ‘squeezing’ together. These low-volatility periods are referred to as consolidations by options traders. They will then place their trades in accordance with the new price trends that emerge when the asset’s price breaks out, and market volatility is present.
The Bollinger Band indicator has the advantage of making it very easy to identify periods when the market is more likely to break out in the near term. The main advantages of this are that it allows options traders to, while also allowing them to identify potentially profitable trading opportunities. Bollinger Bands squeezes, and expansions indicate low and high price volatility, respectively.
This makes Bollinger Bands effective trading indicators for volatility plays in the options market, where traders can use long straddles and strangles when the market is expected to be volatile or short straddles and strangles when the market is expected to be volatile.
3. Moving Average Strategy
Trading with Bollinger Bands is not restricted to a few strategies. Here’s another way to put this indicator to use. We combine it with a Simple Moving Average this time. The length has been set to 200. This strategy necessitates a basic understanding of price action.
How should this strategy be implemented? You must consider the price’s position in relation to the MA200. If the price is higher than the Moving Average, the asset is in an uptrend. What does it imply? We’ll be looking for ‘buy’ signals.
If you look closely at the screenshot above, you will notice a hammer signal indicating that the price is likely to begin rising. This is a long term strategy. When the price breaks below the MA200, you can exit the market.

Let’s look at how to trade Bollinger Bands in a negative scenario. From above, the price crosses the MA200. Later, the price continues to fall without attempting to approach the MA200. This is an excellent opportunity to hold your position until the price reaches the MA200.
4. MACD Trading Strategy
The Moving Average Convergence Divergence indicator is an excellent supplement to a Bollinger Bands strategy. Finding the points where the Moving Averages of the MACD cross with each other below the histogram is the simplest way to use both of those indicators together. This is the first trigger you can use to keep a close eye on the current situation.

The next step is to examine the price chart and the asset’s position in relation to the Bollinger Bands indicator. The price should be hitting the lower band for long trades. When this occurs, you will be able to purchase the asset.
5. Price Action Strategy
Bollinger Bands is a very useful indicator, but it requires some additional tools to be effective. If you don’t want to use any additional indicators, we recommend working with the Price Action strategy. What is the purpose of this strategy?

This strategy has two main signals that you should always keep in mind. The price should reach one of the envelope’s borders. A Price Action signal is the second trigger. There is a morning star candlestick pattern in our example:
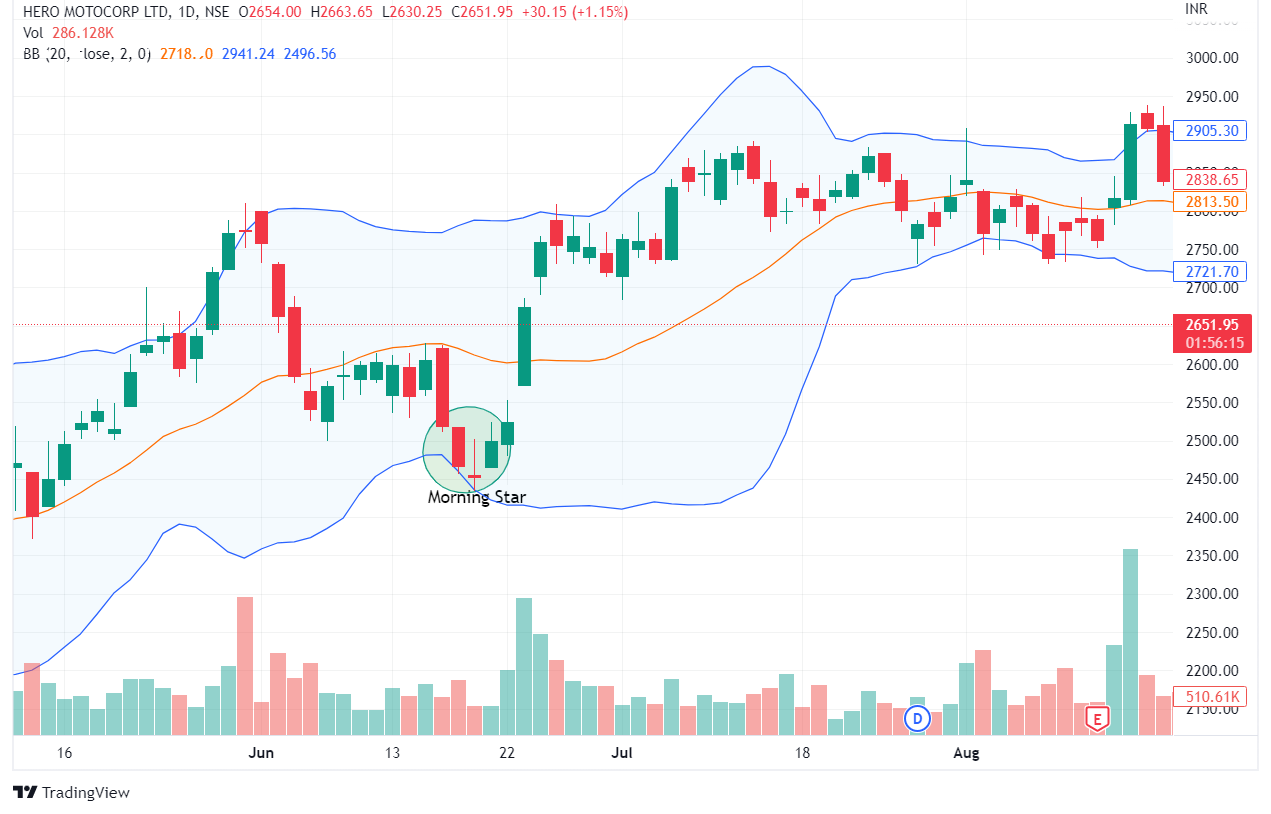
When you thoroughly understand price action, this strategy appears very simple. This morning star is easily interchangeable with any other Price Action model. The outcome will be the same.
You can also join our course on Certification In Online Technical Analysis
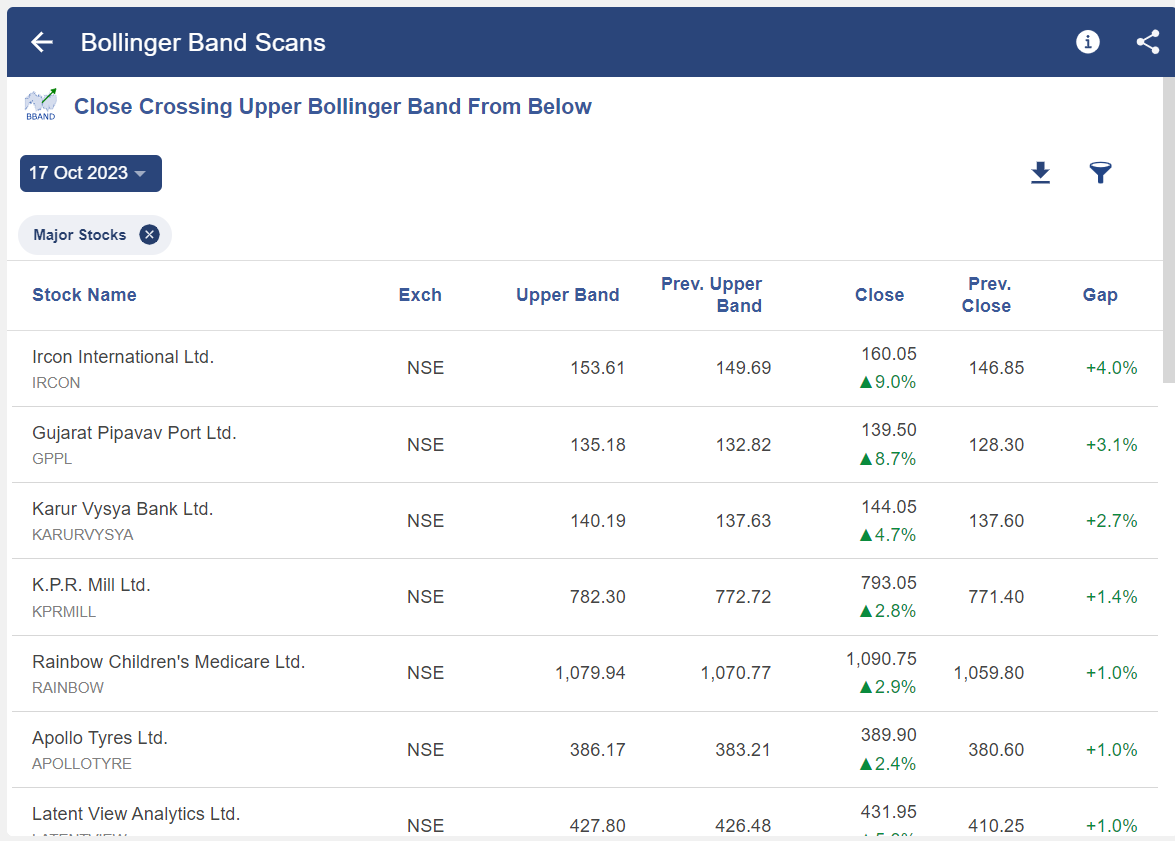
Using StockEdge for Bollinger Band Screener
StockEdge has many Bollinger Band scans which help us to filter out stocks for trading as shown below:
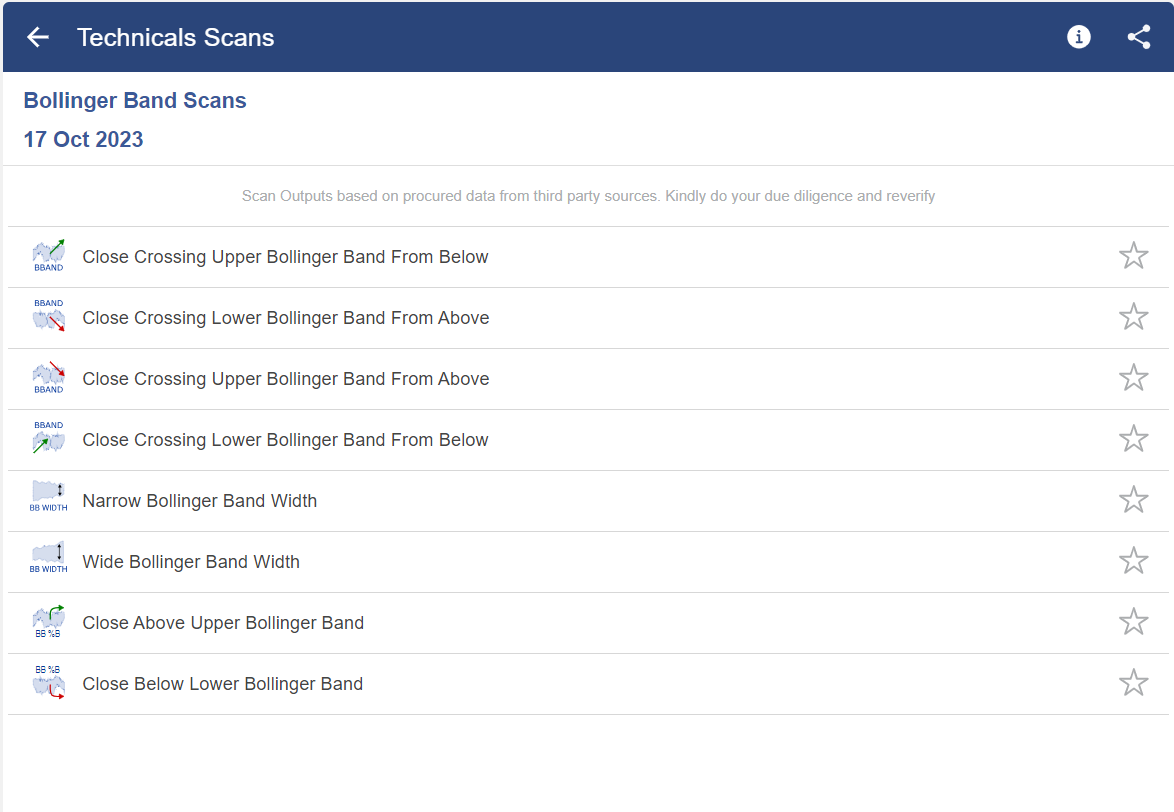
With the help of these scans, one can filter our stocks as shown below:
Bottomline
The aforementioned methods are the most widely used Bollinger Bands strategies. This list, however, is not conclusive. You can develop your own strategies by utilising this indicator’s advantages.
Master Bollinger Bands and boost your profits! Join our Learn Trading Online course to discover the Best 5 Trading Strategies. Enroll today!
Frequently Asked Questions (FAQs)
How does the Bollinger band work?
Based on price movements, Bollinger Bands® provides traders with a sense of the market’s direction. Three bands are used in this process: one for the moving average, one for the lower level, and one for the upper level. Prices that approach the upper band may be a sign of overbought conditions in the market.
What do Bollinger Bands tell me?
Bollinger bands are useful for determining the relative high and low points of a price. Both upper and lower bands are utilised in pairs, along with a moving average. Moreover, the two bands are not meant to be used alone.
Is Bollinger Bands a good indicator?
You can find possible entry and exit locations as well as quick, short-term price swings with the aid of Bollinger Bands®. Bollinger Bands® are a versatile and intuitive visual analysis tool that can be useful for many traders.


