Elearnmarkets - Financial Market Learning
  • Categories
    • Basic Finance
    • Derivatives
    • Financial Planning
    • Fundamental Analysis
    • Technical Analysis
    • Marketshala
    • Miscellaneous
  • Language
    • English
    • Hindi
    • Bengali
No Result
View All Result
  • Courses
  • Webinars
  • Learn On Elearnmarkets
Elearnmarkets - Learn Stock Market, trading, investing for Free
No Result
View All Result
Home Technical Analysis
ROC

ROC Indicator – How to trade with Rate of change Indicator ?

Elearnmarkets by Elearnmarkets
February 4, 2022
in Technical Analysis
Reading Time: 6 mins read
4
24.2k
VIEWS
Share on FacebookShare on TwitterShare on WhatsApp

ROC indicator is a non-banded oscillator.

It tracks if the speed of a trend is accelerating, slowing down or maintaining the same speed.

Table of Contents
What is ROC Indicator?
Calculation of ROC Indicator
Trading Rules and Interpretation
Trading strategies using ROC Indicator
Limitations of ROC
Key takeaways

What is ROC Indicator?

The Rate of Change (ROC) is a momentum technical indicator.

It measures the percentage change in price between the current price and the price a certain number of periods ago.

This indicator is plotted against zero, with the indicator moving upwards into positive territory if price changes are to the upside, and moving into negative territory if price changes are to the downside.

Calculation of ROC Indicator:

It tracks the relationship between the 2-period closing prices.

Join TMP Join TMP Join TMP

In a standard calculation, the period is 12 days.

It considers 12 days back closing price and gets it subtracted from its current closing price.

The difference is plotted or accepted as ROC.

It can be sometimes a positive figure and sometimes a negative figure.

ROC = [(Close – Close n periods ago) / (Close n periods ago)] * 100

Hence a central reference line is plotted as zero.

Trading Rules and Interpretation:

1. Once ROC is above the zero line and keeps on rising, it shows that the trend is not only up but the speed of the uptrend is accelerating.

2. When the Rate of Change is above zero line but falling, it shows that the speed of the uptrend is slowing down.

3. When the Rate of Change is above zero and again starts rising and crosses the previous top, it shows that the uptrend is very much in its speed.

4. When Rate of Change is below zero line but falling, it shows that downtrend is increasing its speed.

Learn about rate of change indicator with ROC Made Easy by Market Experts

5. When Rate of Change is below zero but starts rising upward, it shows that the speed of the downtrend is slowing down.

6. If  Rate of Change is below zero and starts falling, it shows that the downtrend has accelerated its speed once again.

Trading strategies using ROC Indicator

ROC is a very simple strategy which states that whenever the Rate of Change goes above zero line from below, it states a positive momentum while when the ROC goes below zero line from above; it generates a negative momentum in the price.

Learn from Experts : Technical Trading Strategies with ROC Indicator

However, in order to generate a more confirmed signal, we can incorporate moving average. We are taking a combination of 5 and 30 moving average and ROC to enter the trades.

roc strategy

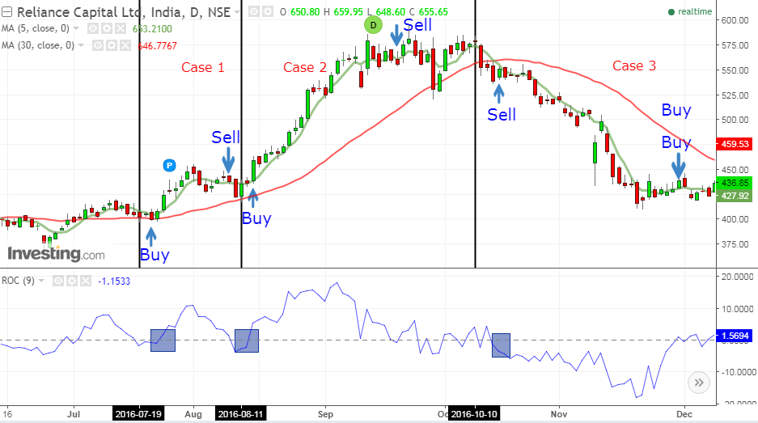
The image above is the chart of Reliance Capital and we can see that whenever 5 DMA is above 30 DMA and whenever the ROC went above the zero line from below, you should go long.

Case 1: We took a long position at the level of 410 when ROC went above the zero line and made an exit when the Rate of Change went below the zero line at 440 (approx), making a profit of 30 points.

Also read: Two effective trading strategies using William % R

Case 2: Again a buy signal was made at 445-450 (approx) when the ROC went above the zero line and 5 DMA was above the 30 DMA and the exit was made at 555-560 when Rate of Change went below the zero line.

Case 3: Next when ROC went below the zero line and 5 DMA was below 30 DMA at 550, a sell signal was generated. This position was squared off at 440 when the Rate of Change went above the zero line.

Watch this video to know more about ROC Indicator :

Limitations of ROC:

One potential problem with using the ROC indicator is that it gives equal weight to the most recent price and the price from n periods ago, despite giving more importance to determine the future price movement.

The indicator is also prone to whipsaws, especially around the zero lines.

ROC divergences sometime give false signals and so a trader must confirm a trade if other reversal signals are present from other indicators and analysis methods.

Key Takeaways:

  • ROC tracks if the speed of a trend is accelerating, slowing down or maintaining the same speed.
  • When the Rate of Change is above zero line but falling, it shows that the speed of the uptrend is slowing down.
  • When the Rate of Change is above zero and again starts rising and crosses the previous top, it shows that the uptrend is very much in its speed.
  • ROC is a very simple strategy which states that whenever the Rate of Change goes above zero line from below, it states a positive momentum.
  • Few traders also use ROC to identify extremes and forecast turning points
Tags: englishRate of changeROCtechnical analysistechnical oscillatorstrading strategy
ShareTweetSend
Previous Post

Nifty Closes in Five Figures for The First Time, Turns Bullish Ahead of FED Rate Decision and Expiry

Next Post

“RBI Monetary Policy – A Window Of Possibility”

Elearnmarkets

Elearnmarkets

Elearnmarkets (ELM) is a complete financial market portal where the market experts have taken the onus to spread financial education. ELM constantly experiments with new education methodologies and technologies to make financial education effective, affordable and accessible to all. You can connect with us on Twitter @elearnmarkets.

Related Posts

Technical Analysis in Stock Trading 1
Technical Analysis

Technical Analysis in Stock Trading

May 31, 2023
7.1k
The Ultimate guide to Trading Divergences 2
Technical Analysis

The Ultimate guide to Trading Divergences

May 26, 2023
1.1k
Trading Psychology: Guide to Master Your Mind in 5 Steps 3
Technical Analysis

Trading Psychology: Guide to Master Your Mind in 5 Steps

May 24, 2023
3.2k
Trading Psychology: 7 Keys to Successful Trading 4
Technical Analysis

Trading Psychology: 7 Keys to Successful Trading

May 22, 2023
3.1k

Comments 4

  1. BEENA VARGHESE says:
    4 years ago

    Thanks

    Reply
    • Sakshi Agarwal says:
      4 years ago

      Hi,

      Thank you for Reading!

      Keep Reading!

      Reply
  2. Sanjay Gupta says:
    2 years ago

    Well explained

    Reply
    • Sakshi Agarwal says:
      2 years ago

      Hi,

      We are glad that you liked our post, you can read more blogs on Technical Analysis from here.

      Thank you for Reading!

      Reply

Leave a Reply Cancel reply

Your email address will not be published. Required fields are marked *

Follow Us

Facebook-f Twitter Instagram Linkedin-in Youtube Telegram

Register on Elearnmarkets

Continue your financial learning by creating your own account on Elearnmarkets.com

Register Free Account

Download App

Categories

  • Basic Finance
  • Derivatives
  • Financial Planning
  • Fundamental Analysis
  • Technical Analysis
  • Marketshala
  • Miscellaneous

Popular On Elearnmarkets

  • Market Superheroes:
  • Vivek Bajaj
  • Chetan Panchamia
  • Ashish Kyal
  • Premal Parekh
  • Abhijit Paul
  • Jegan
  • Sivakumar Jayachadran
  • Vishal Malkan
  • Jyoti Budhia
  • Vivek Gadodia
  • Vishal Mehta
  • Piyush Chaudhry
  • Santosh Pasi
  • Gomathi Shankar
  • Market Superheroes:
  • Vivek Bajaj
  • Chetan Panchamia
  • Ashish Kyal
  • Premal Parekh
  • Abhijit Paul
  • Jegan
  • Sivakumar Jayachadran
  • Vishal Malkan
  • Jyoti Budhia
  • Vivek Gadodia
  • Vishal Mehta
  • Piyush Chaudhry
  • Santosh Pasi
  • Gomathi Shankar
  • Courses:​
  • Options Trading
  • Dow Theory
  • Momentum Trading
  • Stock Investing
  • Stock Market for Beginners
  • Harmonic Chart Patterns
  • Algo Trading
  • Elliot Wave Theory
  • Advanced Excel
  • Cryptocurrency
  • NSE Certification Course
  • Courses:​
  • Options Trading
  • Dow Theory
  • Momentum Trading
  • Stock Investing
  • Stock Market for Beginners
  • Harmonic Chart Patterns
  • Algo Trading
  • Elliot Wave Theory
  • Advanced Excel
  • Cryptocurrency
  • NSE Certification Course
  • Webinars:
  • Bank Nifty Scalping
  • Intraday Trading Strategies
  • Options Trading Strategies
  • Options selling
  • Price Action
  • Relative Strength
  • Tax Planning
  • Options Buying
  • Growth Stocks
  • Portfolio Management
  • Relative Strength Index
  • Risk Management
  • Renko Charts
  • Crude Oil
  • Traders Psychology
  • Moving Average
  • Multibagger Stocks
  • Free Learning Modules:
  • Intraday Trading
  • Options Scalping
  • Swing Trading
  • Financial Modelling
  • RSI Indicator
  • Bollinger Bands
  • Pricing of Futures
  • Personal Finance
  • Initial Public Offerings (IPO)
  • Value Investing
  • Technical Indicators
  • Candlesticks
  • Chart Patterns
  • Option Greeks
  • ELSS Funds
  • Banking and Insurance
  • Real Estate
  • Gold
  • Book Summaries:
  • Rich Dad Poor Dad
  • Psychology of Money
  • The Intelligent Investor
  • The Richest Man in Babylon
  • Think and Trade Like a Champion
  • Value Investing and Behavioural Finance
  • Trading in the Zone
  • Learn to Earn
  • Book Summaries:
  • Rich Dad Poor Dad
  • Psychology of Money
  • The Intelligent Investor
  • The Richest Man in Babylon
  • Think and Trade Like a Champion
  • Value Investing and Behavioural Finance
  • Trading in the Zone
  • Learn to Earn
  • Tools:
  • CAGR Calculator
  • SIP Calculator
  • eLearnOptions
  • Future Value Calculator
  • Present Value Calculator
  • Atal Pension Yojana
  • Cost of Delay Calculator
  • Become a Crorepati
  • Tools:
  • CAGR Calculator
  • SIP Calculator
  • eLearnOptions
  • Future Value Calculator
  • Present Value Calculator
  • Atal Pension Yojana
  • Cost of Delay Calculator
  • Become a Crorepati

© 2023 Elearnmarkets. All Rights Reserved

  • Visit Elearnmarkets
  • Courses
  • Webinars
  • Financial Guides
  • Get Free Counselling
  • Visit Elearnmarkets
  • Courses
  • Webinars
  • Financial Guides
  • Get Free Counselling

Get Elearnmarkets App

No Result
View All Result
  • Article Categories
    • Basic Finance
    • Derivatives
    • Financial Planning
    • Fundamental Analysis
    • Technical Analysis
    • Marketshala
    • Miscellaneous
  • Language
    • Hindi
    • Bengali
    • English
  • Courses
  • Webinars

© 2020 Elearnmarkets All Rights Reserved