ROC Technical indicator is a non-banded oscillator.
It tracks if the speed of a trend is accelerating, slowing down or maintaining the same speed.
What is ROC Indicator?
The Rate of Change (ROC) is a momentum technical indicator.
It measures the percentage change in price between the current price and the price a certain number of periods ago.
This indicator is plotted against zero, with the indicator moving upwards into positive territory if price changes are to the upside, and moving into negative territory if price changes are to the downside.
Calculation of ROC Indicator:
Roc Trading Indicator tracks the relationship between the 2-period closing prices.
In a standard calculation, the period is 12 days.
It considers 12 days back closing price and gets it subtracted from its current closing price.
The difference is plotted or accepted as ROC.
It can be sometimes a positive figure and sometimes a negative figure.
ROC = [(Close – Close n periods ago) / (Close n periods ago)] * 100
Hence a central reference line is plotted as zero.
Trading Rules and Interpretation:
1. Once ROC is above the zero line and keeps on rising, it shows that the trend is not only up but the speed of the uptrend is accelerating.
2. When the Rate of Change is above zero line but falling, it shows that the speed of the uptrend is slowing down.
3. When the Rate of Change is above zero and again starts rising and crosses the previous top, it shows that the uptrend is very much in its speed.
4. When Rate of Change is below zero line but falling, it shows that downtrend is increasing its speed.
Learn about rate of change indicator with ROC Made Easy by Market Experts
5. When Rate of Change is below zero but starts rising upward, it shows that the speed of the downtrend is slowing down.
6. If Rate of Change is below zero and starts falling, it shows that the downtrend has accelerated its speed once again.
Trading strategies using ROC Indicator
ROC is a very simple strategy which states that whenever the Rate of Change goes above zero line from below, it states a positive momentum while when the ROC goes below zero line from above; it generates a negative momentum in the price.
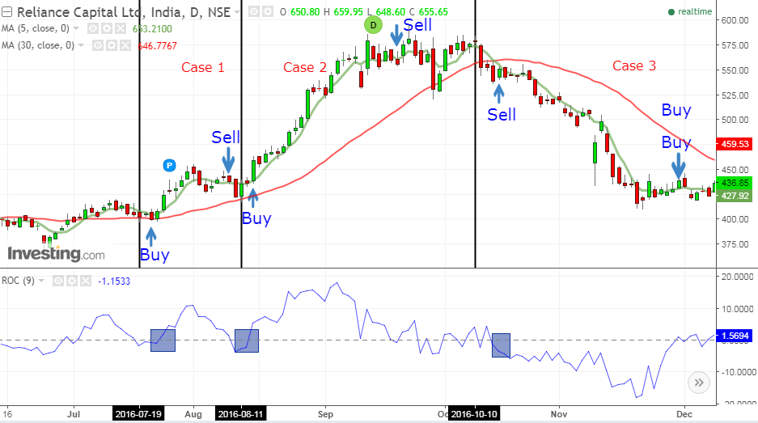
However, in order to generate a more confirmed signal, we can incorporate moving average. We are taking a combination of 5 and 30 moving average and ROC to enter the trades.

The image above is the chart of Reliance Capital and we can see that whenever 5 DMA is above 30 DMA and whenever the ROC went above the zero line from below, you should go long.
Case 1: We took a long position at the level of 410 when ROC went above the zero line and made an exit when the Rate of Change went below the zero line at 440 (approx), making a profit of 30 points.
Also read: Two effective trading strategies using William % R
Case 2: Again a buy signal was made at 445-450 (approx) when the ROC went above the zero line and 5 DMA was above the 30 DMA and the exit was made at 555-560 when Rate of Change went below the zero line.
Case 3: Next when ROC went below the zero line and 5 DMA was below 30 DMA at 550, a sell signal was generated. This position was squared off at 440 when the Rate of Change went above the zero line.
Watch this video to know more about ROC Indicator :
Limitations of ROC:
One potential problem with using the ROC stock indicator is that it gives equal weight to the most recent price and the price from n periods ago, despite giving more importance to determine the future price movement.
The indicator is also prone to whipsaws, especially around the zero lines.
ROC divergences sometime give false signals and so a trader must confirm a trade if other reversal signals are present from other indicators and analysis methods.
Key Takeaways:
- ROC tracks if the speed of a trend is accelerating, slowing down or maintaining the same speed.
- When the Rate of Change is above zero line but falling, it shows that the speed of the uptrend is slowing down.
- When the Rate of Change is above zero and again starts rising and crosses the previous top, it shows that the uptrend is very much in its speed.
- ROC is a very simple strategy which states that whenever the Rate of Change goes above zero line from below, it states a positive momentum.
- Few traders also use ROC to identify extremes and forecast turning points


Thanks
Hi,
Thank you for Reading!
Keep Reading!
Well explained
Hi,
We are glad that you liked our post, you can read more blogs on Technical Analysis from here.
Thank you for Reading!
Thank you for give this valuable information.