Elearnmarkets - Financial Market Learning
  • Categories
    • Basic Finance
    • Derivatives
    • Financial Planning
    • Fundamental Analysis
    • Technical Analysis
    • Marketshala
    • Miscellaneous
  • Language
    • English
    • Hindi
    • Bengali
No Result
View All Result
  • Courses
  • Webinars
  • Learn On Elearnmarkets
Elearnmarkets - Learn Stock Market, trading, investing for Free
No Result
View All Result
Home Technical Analysis
TRIN

The Arms Index (TRIN) explained!

Elearnmarkets by Elearnmarkets
November 24, 2021
in Technical Analysis
Reading Time: 3 mins read
0
2.1k
VIEWS
Share on FacebookShare on TwitterShare on WhatsApp

The Arms Index also known as TRIN is a breadth indicator developed by Richard W. Arms in the year 1967.

It basically serves to identify conditions where the market is short-term overbought or oversold.

It compares the advancing and declining stock issues and trading volume as an indicator to judge the overall market sentiment.

It draws the relationship between the market demand and supply data and helps to predict price movement on an intraday basis.

This index is calculated by dividing the Advance-Decline (AD) ratio by the Advance-Decline (AD) volume ratio.

You may do NSE Academy Certified Technical Analysis course to understand and develop your understanding of the various aspect of Technical analysis and improve your trading.

Join TMP Join TMP Join TMP

Calculation

TRIN = (The number of advancing stocks/The number of declining stocks)/(The composite volume of advancing stocks/The composite volume of declining stocks)

Let’s take an example to understand in detail-

Advancing Issues- 1900

Declining Issues- 1100

AD ratio- 1900/1100 = 1.8

Advancing Volume- 1400

Declining Volume- 600

AD Volume ratio- 1400/600 = 2.3

Thus, TRIN= 1.8/2.3= 0.78

The value of 0.74 indicates that far more volume went into the stocks that were advancing than the stocks that were declining.

The ratio would have been 1 in case both the ratios would have been proportionate.

However, value above 1 indicates that more stocks went into declining than advancing.

Interpretation of Arms Index

An Arms index value below 1 is considered to be bullish, a value of 1 indicates balanced market and value above 1 represents the bearish market.

Bullish reading< 1

Neutral reading= 1

Bearish reading> 1

The farther is the value from 1, the greater is the contrast in force between buying and selling on an intraday basis.

Also read: Triple screen trading system: the Alexander Elder way of trading

A value that that goes above 3 is considered oversold market and the market has turned over bearish.

A value that goes below 0.50 indicates an overbought market and that bullish sentiment is too dramatic.

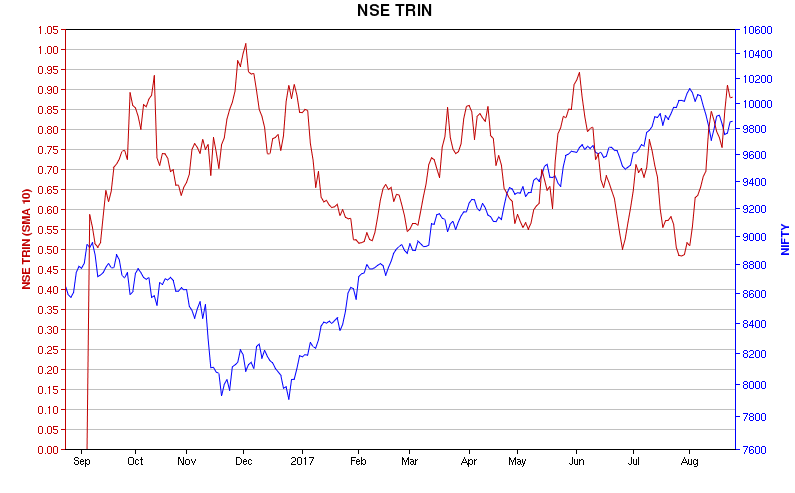
Due to the volatility of daily readings, the Arms Index is often displayed as a 10-day simple moving average plotted on a scale.

Know More:  How to trade using moving average on different timeframes?

The market is taken as overbought when this 10-day moving average goes below 0.80 and market becomes oversold when this 10 day moving average reaches 1.20.

However, the Arms index stays within this 0.8-1.2 range majority of the time.

Arms Index

Bottomline

Relative Strength Index (RSI) and Stochastic are most commonly used measures to identify overbought and oversold conditions.

Both the indicators use stock’s price in relation to its own trading range.

However, the Arms Index is based on the overall market performance, more specifically in terms of breadth and volume.

You should also combine it with other technical parameters to confirm your trades.

In order to get the latest updates on Financial Markets visit Stockedge

Tags: englishniftyrsistochasticTRIN
ShareTweetSend
Previous Post

4 Simple Mathematics Before Investing

Next Post

Post Yellen’s Speech, Nifty And Bank Nifty Set For More Consolidation

Elearnmarkets

Elearnmarkets

Elearnmarkets (ELM) is a complete financial market portal where the market experts have taken the onus to spread financial education. ELM constantly experiments with new education methodologies and technologies to make financial education effective, affordable and accessible to all. You can connect with us on Twitter @elearnmarkets.

Related Posts

Technical Analysis in Stock Trading 1
Technical Analysis

Technical Analysis in Stock Trading

May 31, 2023
7.1k
The Ultimate guide to Trading Divergences 2
Technical Analysis

The Ultimate guide to Trading Divergences

May 26, 2023
1.1k
Trading Psychology: Guide to Master Your Mind in 5 Steps 3
Technical Analysis

Trading Psychology: Guide to Master Your Mind in 5 Steps

May 24, 2023
3.1k
Trading Psychology: 7 Keys to Successful Trading 4
Technical Analysis

Trading Psychology: 7 Keys to Successful Trading

May 22, 2023
3.1k

Leave a Reply Cancel reply

Your email address will not be published. Required fields are marked *

Follow Us

Facebook-f Twitter Instagram Linkedin-in Youtube Telegram

Register on Elearnmarkets

Continue your financial learning by creating your own account on Elearnmarkets.com

Register Free Account

Download App

Categories

  • Basic Finance
  • Derivatives
  • Financial Planning
  • Fundamental Analysis
  • Technical Analysis
  • Marketshala
  • Miscellaneous

Popular On Elearnmarkets

  • Market Superheroes:
  • Vivek Bajaj
  • Chetan Panchamia
  • Ashish Kyal
  • Premal Parekh
  • Abhijit Paul
  • Jegan
  • Sivakumar Jayachadran
  • Vishal Malkan
  • Jyoti Budhia
  • Vivek Gadodia
  • Vishal Mehta
  • Piyush Chaudhry
  • Santosh Pasi
  • Gomathi Shankar
  • Market Superheroes:
  • Vivek Bajaj
  • Chetan Panchamia
  • Ashish Kyal
  • Premal Parekh
  • Abhijit Paul
  • Jegan
  • Sivakumar Jayachadran
  • Vishal Malkan
  • Jyoti Budhia
  • Vivek Gadodia
  • Vishal Mehta
  • Piyush Chaudhry
  • Santosh Pasi
  • Gomathi Shankar
  • Courses:​
  • Options Trading
  • Dow Theory
  • Momentum Trading
  • Stock Investing
  • Stock Market for Beginners
  • Harmonic Chart Patterns
  • Algo Trading
  • Elliot Wave Theory
  • Advanced Excel
  • Cryptocurrency
  • NSE Certification Course
  • Courses:​
  • Options Trading
  • Dow Theory
  • Momentum Trading
  • Stock Investing
  • Stock Market for Beginners
  • Harmonic Chart Patterns
  • Algo Trading
  • Elliot Wave Theory
  • Advanced Excel
  • Cryptocurrency
  • NSE Certification Course
  • Webinars:
  • Bank Nifty Scalping
  • Intraday Trading Strategies
  • Options Trading Strategies
  • Options selling
  • Price Action
  • Relative Strength
  • Tax Planning
  • Options Buying
  • Growth Stocks
  • Portfolio Management
  • Relative Strength Index
  • Risk Management
  • Renko Charts
  • Crude Oil
  • Traders Psychology
  • Moving Average
  • Multibagger Stocks
  • Free Learning Modules:
  • Intraday Trading
  • Options Scalping
  • Swing Trading
  • Financial Modelling
  • RSI Indicator
  • Bollinger Bands
  • Pricing of Futures
  • Personal Finance
  • Initial Public Offerings (IPO)
  • Value Investing
  • Technical Indicators
  • Candlesticks
  • Chart Patterns
  • Option Greeks
  • ELSS Funds
  • Banking and Insurance
  • Real Estate
  • Gold
  • Book Summaries:
  • Rich Dad Poor Dad
  • Psychology of Money
  • The Intelligent Investor
  • The Richest Man in Babylon
  • Think and Trade Like a Champion
  • Value Investing and Behavioural Finance
  • Trading in the Zone
  • Learn to Earn
  • Book Summaries:
  • Rich Dad Poor Dad
  • Psychology of Money
  • The Intelligent Investor
  • The Richest Man in Babylon
  • Think and Trade Like a Champion
  • Value Investing and Behavioural Finance
  • Trading in the Zone
  • Learn to Earn
  • Tools:
  • CAGR Calculator
  • SIP Calculator
  • eLearnOptions
  • Future Value Calculator
  • Present Value Calculator
  • Atal Pension Yojana
  • Cost of Delay Calculator
  • Become a Crorepati
  • Tools:
  • CAGR Calculator
  • SIP Calculator
  • eLearnOptions
  • Future Value Calculator
  • Present Value Calculator
  • Atal Pension Yojana
  • Cost of Delay Calculator
  • Become a Crorepati

© 2023 Elearnmarkets. All Rights Reserved

  • Visit Elearnmarkets
  • Courses
  • Webinars
  • Financial Guides
  • Get Free Counselling
  • Visit Elearnmarkets
  • Courses
  • Webinars
  • Financial Guides
  • Get Free Counselling

Get Elearnmarkets App

No Result
View All Result
  • Article Categories
    • Basic Finance
    • Derivatives
    • Financial Planning
    • Fundamental Analysis
    • Technical Analysis
    • Marketshala
    • Miscellaneous
  • Language
    • Hindi
    • Bengali
    • English
  • Courses
  • Webinars

© 2020 Elearnmarkets All Rights Reserved